Bell correlations – a hallmark of an entangled quantum system – have been spotted in an ensemble of 500,000 rubidium-87 atoms. The atoms were prepared in spin-squeezed states by physicists at Stanford University in the US and the correlations measured to a whopping statistical significance of 124σ.
In quantum mechanics, entangled particles have much stronger correlations than are allowed in classical physics – a property that can be exploited in quantum technologies including cryptography. In 1964 the physicist John Bell famously calculated an upper limit on how strong these correlations could be if they were caused by classical physics alone – what has become known as Bell’s inequality. Correlations stronger than this limit, Bell reasoned, could occur only if the particles are entangled.
In this latest work, Onur Hosten, Mark Kasevich and colleagues have measured these strong Bell correlations in an ensemble of 500,000 cold rubidium-87 atoms that are trapped by laser light. The atoms are put into an entangled state using a process called spin squeezing. The uncertainty principle dictates that the uncertainty in a measurement of the z-component of the total spin of the system multiplied by the uncertainty in the y-component must be larger than a certain value. Reducing (or squeezing) the uncertainty of the z-component increases the uncertainty of y-component, putting the system into a spin-squeezed state.
Not a fluke
It turns out that the technique used by Hosten and colleagues to create a spin-squeezed state in their atomic system also puts the atoms into an entangled state. The team then characterized this state by measuring two quantities. One is related to the total spin of the atoms in the z direction and the other is related to the total spin of the atoms in a direction n, which is in the z–x plane. Correlations between these two quantities can be expressed in terms of a Bell-like inequality. The team found that for certain values of n, the inequality was violated – showing that entanglement is present in the system. For some values of n, the statistical significance of the violation was 124σ, making it extremely unlikely that the measurement was a random fluke.
Kai Bongs of the University of Birmingham in the UK describes the work as “a very nice experiment done on a fantastic system”, and points out that the Stanford team has taken the atomic ensemble “deep into the quantum domain”. However, Bongs, who works in the field of quantum sensors, says that practical applications of the Bell correlation measurements are not obvious. Hosten concurs: “We do not know any immediate practical applications of the Bell correlation measurements. However the spin-squeezed states have immediate applications in improving the precision of atomic clocks and atom interferometers.”
Hosten points out that the team’s study differs from conventional Bell experiments because it does not look at correlations between measurements made at two different places. If the system could be adapted for atom interferometry – whereby the atoms can follow two different paths – it could be used to further test the predictions of quantum theory. The measurements are described in Physical Review Letters.
Leukosomes are a promising new type of nanoparticle for use in targeted drug and gene delivery. Preloaded with leukocyte proteins, the particles cloak themselves in a shroud of host protein. Researchers from the Houston Methodist Research Institute in Texas have investigated this coating to find out how they evade the host immune system.
Reaching your target behind enemy lines is easier if you can steal a uniform. Leukosomes are biomimetic lipid vesicles (liposomes) that are preloaded with host white blood cell proteins on their surface. When inside the body, they shroud themselves in host protein to slip past the immune system: it is this unknown shroud of host protein that makes them special.
When Ennio Tasciotti and colleagues in Texas and Italy compared how coated leukosomes and bare liposomes fared in the blood, they found that the liposomes were quickly swallowed up by the host immune system, whereas the leukosomes circulated far longer. In addition, the leukosomes reached sites of inflammation in greater numbers.
The researchers studied leukosomes sized from 80 to 1000 nm that coat themselves in a specific array of plasma proteins – a corona, which helps to conceal them from the deadly host immune system. This was what they investigated to find out how it might enable the stealth function of these vesicles.
Stealth mode
Tasciotti and colleagues imaged the leukosomes in mice by intra-vital microscopy. They found that the leukosomes were able to target inflamed tissue, while also circulating for longer in the blood. Moreover, the leukosomes had the ability to resist being swallowed by roaming phagocytic macrophages. In contrast, liposomes – while they did also pick up a protein corona – were more evenly spread from their point of origin and were quickly swallowed up. This induced ability to both turn on stealth mode and target specific organs was quite unexpected. Especially after the researchers analysed the protein corona and found that leukosomes adsorb fewer proteins to their surface than plain liposomes.
The final experiment of the paper seems to posit an answer: macrophage receptors. One possibility, the researchers argue, is that the macrophage receptors in the leukosome undergo receptor site–ligand binding with proteins in the blood. This effectively blocks the sites that macrophages would normally grab on to, so the leukosome goes on unimpeded.
Biomimetic particles like these have been described as Trojan horses, and were originally designed using erythrocyte membranes. Here, researchers have begun to characterize the corona – the “cloak of many colours” – an extra layer composed of hundreds of proteins that a leukosome takes on when it enters the blood of the host. Understanding this process might well help to make more bespoke, generally targeted nanoparticles, which can sneak through the immune system to deliver their precious cargo to a specific target.
Superconducting fabric is ultrathin, flexible and lightweight
A flexible fabric woven from plastic fibres and high-temperature superconductor nanowires has been unveiled by Uwe Hartmann, Volker Presser and colleagues at the University of Saarland in Germany. Potential applications of the material include coatings that screen objects form electromagnetic fields, flexible resistance-free electrical cables and friction-free motion through magnetic levitation. The material, which looks like charred paper, is a superconductor below about 73 K. However, unlike most other high-temperature superconductors – which are ceramics – the fabric is as flexible as plastic kitchen film. It has a density of just 0.05 g/cm3, which is just 1% of most supercomputing materials. “This makes the material very promising for all those applications where weight is an issue, such as in space technology,” says Hartmann, adding: “There are also potential applications in medical technology.” The superconducting nanowires are 300 nm or less in diameter and are made from yttrium-barium-copper-oxide or a similar material. The nanowire manufacturing process is described in Superconductor Science and Technology and the new material will be presented at the Hannover Messe industrial fair on 24–28 April.
Girls underestimate their mathematical ability, reveals study
Confidence booster: Lara Perez-Felkner has found that girls underestimate their mathematical ability. (Courtesy: Florida State University)
A study by psychologists in the US has found that high-school girls rate their competence in mathematics lower than boys, even for those with similar abilities, according to research reported in Frontiers in Psychology. Carried out by Lara Perez-Felkner at Florida State University and colleagues, the study asked high-school students in the 10th and 12th grade to indicate their level of agreement to statements such as “I am certain I can understand the most difficult material presented in math texts”. For boys and girls who showed a high ability in mathematics, the researchers found that boys rated their ability 27% higher than girls. The authors say that this difference could explain why more boys go on to study mathematics and science at degree level and beyond. “The argument continues to be made that gender differences in the hard sciences is all about ability,” says Perez-Felkner. “But when we hold tests scores constant, we see boys still rate their ability higher, and girls rate their ability lower.” The authors suggest that initiatives such as regular science camps, extracurricular activity in science and increased access to female scientists could help to boost girls’ confidence in mathematics and science.
Super-Earth exoplanet has atmosphere
Steamy atmosphere: super-Earth may have atmosphere rich in water and methane. Artist’s impression of GJ 1132b orbiting its host red dwarf. (Courtesy: Max Plank Institute of Astronomy)
An atmosphere has been detected on an exoplanet that is slightly larger than Earth. Previous observations of atmospheres on planets outside the solar system have involved objects much more massive than Earth. But this is the first time an atmosphere has been detected on a planet only marginally bigger than ours – 1.6 times the mass of Earth and 1.4 times the radius. The planet in question, GJ 1132b, orbits a red-dwarf star 39 light-years away and is classified as a super-Earth because it is bigger than Earth but smaller than a gas giant. A European collaboration used the GROND imager at the MPG/ESO 2.2 m telescope of the European Southern Observatory in Chile to image the changing brightness of GJ 1132b’s host star as the planet passed in front of it. By looking at seven different wavelengths, the team saw that the planet appeared bigger when observed in the infrared. This suggests that GJ 1132b has an atmosphere that is opaque to infrared but transparent to other wavelengths. Using simulations, the researchers suggest this is because the atmosphere may be rich in oxygen and methane, but with the current data it is not possible to say how similar or dissimilar GJ 1132b is to Earth. It may be a water planet with a steam atmosphere, for example. Meanwhile, as the current method for detecting life on other planets is to look for fingerprint chemical imbalances in their atmospheres, the finding, published in the Astronomical Journal, is a step towards finding life outside the solar system.
You can find all our daily Flash Physics posts in the website’s news section, as well as on Twitter and Facebook using #FlashPhysics. Tune in to physicsworld.com later today to read today’s extensive news story on Belle correlations between 500,000 atoms.
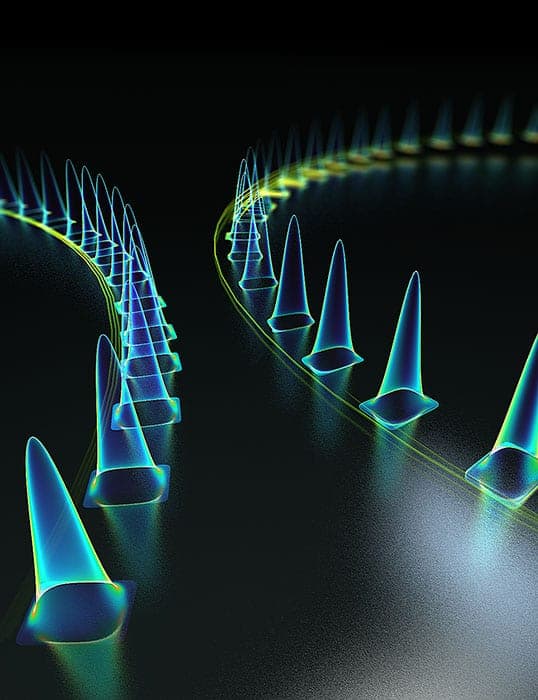
Molecules on the move: illustration of soliton molecules. (Courtesy: Claus Ropers)
Solitons – non-dispersive wavepackets – are key features of nonlinear optics and other nonlinear wave systems. Theoreticians have long predicted that solitons can bind together to form “molecules” – and experiments have confirmed this in simple cases. Now, researchers in Germany and the US have analysed the spectra of soliton molecules multiple times as they ricocheted between the mirrors of a laser cavity – gaining remarkable insights into the dynamics of pairs and even triplets of solitons.
Light in optical fibres normally behaves as the linear sum of its frequency components. Laser pulses therefore gradually spread out as different frequencies travel at different speeds in a fibre. At high powers, however, the refractive index of glass fibre becomes nonlinear, so higher-intensity pulses propagate more slowly. This acts to push pulses together and, under specific conditions, the two effects can balance each other to create solitons – waves that travel forever without dispersing.
These nonlinear effects can also allow different light pulses to influence each other. “You have two balanced pulses that, when they come into each other’s sphere of influence, start bouncing off each other like lightsabers!” says Claus Ropers of the University of Göttingen. Under some conditions, they can also form bound states.
Relative motion
Soliton molecules have been previously observed in laser cavities, but only when the pulses moved in lockstep. “If you have two soliton pulses that are circulating stably in a cavity, you can see that simply from the optical spectrum of the laser,” explains Ropers. Decades of simulations have suggested this scenario, with pulses moving stably, is a subset of a much broader, richer range of mathematically possible soliton dynamics. However, soliton pairs in constant relative motion had never previously been observed in real time.
“Once the solitons start moving, the optical spectrum of the laser is completely washed out,” says Ropers, “You don’t see anything. Basically, you need to measure the optical spectrum of every laser shot.” With the solitons bouncing back and forth at the speed of light, however, this is a near-impossible task.
In the new research, Ropers and colleagues at the University of Göttingen and the University of California, Los Angeles, developed an ingenious and relatively simple technique they call “real-time spectral interferometry”. Each time the solitons bounce against the partial mirror of their laser cavity, a small proportion of the light escapes down a kilometre-long optical fibre. “This very little extracted energy doesn’t have enough intensity to create nonlinear effects in the fibre, so [the pulses] just see the dispersion,” explains team member George Herink. “The pulses therefore disperse in time until they overlap. When they overlap they interfere, and then the spectral patterns encode the original timing.” This allowed the team to capture a movie of soliton evolution with a shutter speed of just a few nanoseconds.
High-power triplets
The researchers first created two solitons in an optical cavity and manoeuvred them closer until they formed a static bound state. They also looked at solitons with fixed relative positions, but with a continually evolving relative phase. Soliton pairs whose relative positions changed continuously were also made, as Herink explains: “The first pulse is more intense, so it runs a bit slower because of the nonlinear refractive index. The second pulse therefore catches up: when they get close enough, another nonlinear effect makes them repel again. This kind of stuff can happen continuously, and what we see in our data is two pulses continuously changing their distance.” The team also observed soliton triplets at very high powers, and found that, when they turned the power down slightly, the triplet became a pair of solitons.
The researchers now intend to investigate their solitons in more detail. “This work is a kaleidoscope of the phenomena that you can actually see,” says Ropers. “We describe a range of different solutions, but there’s a lot more in terms of the physics of this and what exactly causes these dynamics.” He says this set-up acts as an “analogue simulator” of soliton dynamics, which appear in many other physical systems, some of which – such as Bose–Einstein condensates in ultracold gases – are much harder to investigate experimentally. Beyond this, Herink says that, if the researchers can control the evolution of the time lag between two pulses, this could be useful to chemists using pump-probe spectroscopy to follow ultrafast reaction dynamics.
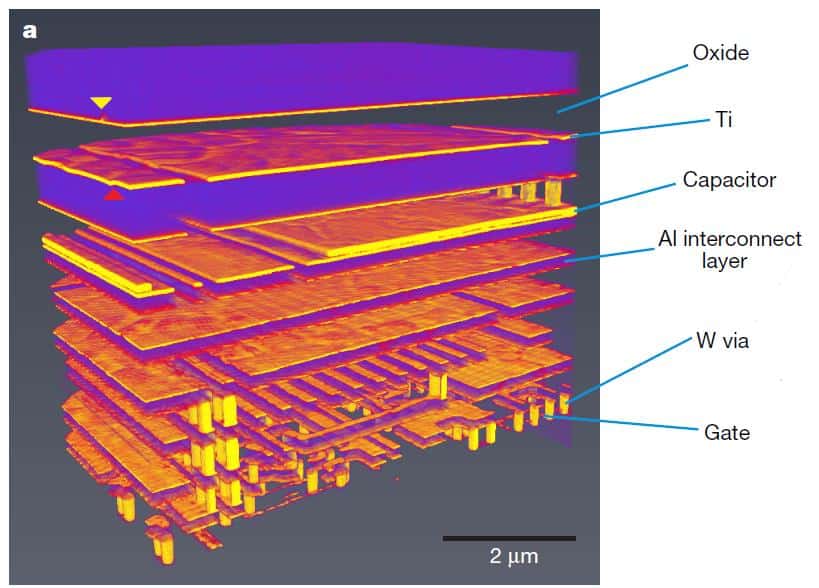
The 3D render of a detector chip obtained via the new X-ray process. Credit: Nature
As the scale of integrated circuits (ICs) continues to shrink, the lack of practical methods for imaging their complex internal structure has hampered feedback for quality control and product development. A collaboration led by Mirko Holler at the Paul Scherrer Institut in Switzerland has published work in Nature that shows how X-rays can be used to produce 3D renderings of the internal structure of ICs with resolutions as low as 14.6 nm in all three dimensions.
Modern ICs are highly complex structures with feature sizes well below 100 nm and multiple layers of silicon, metals and silicon dioxide. Making these tiny devices is a mammoth engineering challenge, but another surprising problem faced by IC manufacturers is the ability to see what they have actually made. The current options for high-resolution imaging are atomic force microscopy, which is a surface technique and electron microscopy methods, which have a penetration depth of only a few nanometres. Seeing inside ICs currently relies on the laborious and destructive process of sectioning the device with an ion beam and imaging each layer with scanning electron microscopy.
To overcome this problem, Holler’s team in Switzerland demonstrated an innovative approach using X-rays that can build a high-resolution 3D model of an IC’s internal structure. A coherent X-ray beam penetrates the sample and produces a diffraction pattern. They moved each sample to obtain several hundred such patterns, which are combined to produce a 3D model by a process known as tomography. The researchers used the so-called ptychographic scan method to obtain the diffraction patterns. This method takes 2 dimensional scans of the sample perpendicular to the X-ray beam. By using overlapping scan positions it allows the phase of the x-rays to be determined, which produces higher resolution images than is normally achievable.
Drawbacks and limitations
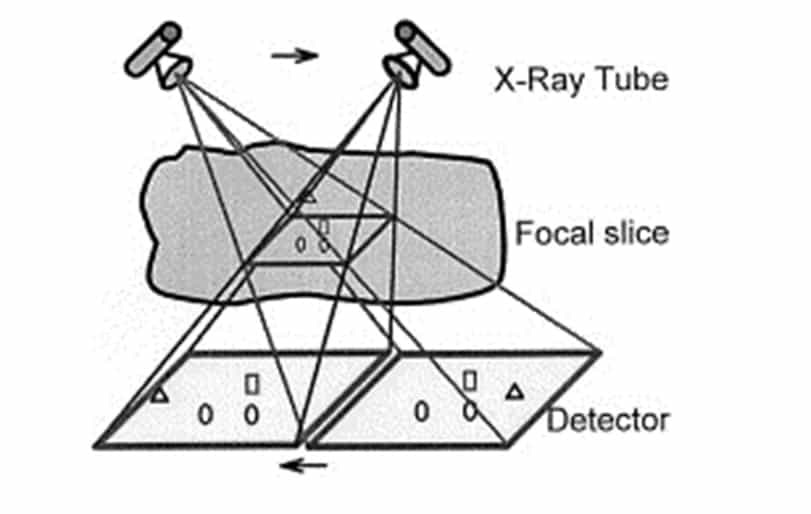
Although the imaging method itself is completely non-destructive, the implementations presented by the collaboration still require a destructive sample preparation process. The first example requires access to a small sample from all angles. Holler and his team achieved this by cutting out an 11 µm cylindrical pillar from the chip. However, the researchers believe that whole chips could be imaged using laminography instead of tomography. This method forms a 3D image in a series of planes by collecting diffraction patterns through the sample, thereby needing access for the X-ray sources and detectors only from above and below. To achieve this for a complete off-the-shelf chip would require a higher power X-ray source than the researchers had available. Currently, there is also a lack of scanning instruments for the method.
A schematic of the set-up required for full-field laminography based on laboratory sources. Credit: S Gondrom et al; X-ray computed laminography: an approach of computed tomography for applications with limited access; Nuclear Engineering and Design; 190 (1–2) 141-147; 1999 http://dx.doi.org/10.1016/S0029-5493(98)00319-7.
The other major drawback to the method is imaging speed, as a practical method must be able to image whole chips in reasonable timescales. The current system can image a 5 µm square region in just under a minute, but anticipated advances in synchrotron radiation sources and X-ray optics suggest that a 0.5 mm square region will soon be possible in the same imaging time. Synchrotron sources are available in all areas with significant IC industries, but do impose a high cost. These costs however, are considered comparable to alternative imaging methods – such as transmission electron microscopy – as well as being potentially more powerful.
The team has managed to achieve non-destructive imaging of the internal structure of an IC with excellent 3D resolution. With further development of X-ray sources and optics this promises to be a transformative technology for the analysis and quality control of integrated circuits.
Just 40 light-years from Earth, TRAPPIST-1 is relatively small compared with the size of our Sun, with a mass 80 times that of Jupiter. Researchers were able to spot periodic drops in intensity of light from the star, as observed by the TRAPPIST telescope in Chile. Using the “transit” method of exoplanet detection, the astrophysicists were able to infer the presence of seven planets sweeping across the face of the star. Remarkably, all seven objects appear to be similar in size to Earth, with radii ranging from 0.77–1.13 Earth radii. The team was able to determine the mass and density of six of the exoplanets, which suggests that they have rocky compositions.
In this podcast, Glester meets researchers involved in the discovery to find out what they know so far about the system. What would it be like to stand on the surface of a TRAPPIST-1 planet and stare out at the night sky? What is the geology of the planets? How can future space missions enable us to learn more about the system?
With his characteristic enthusiasm, Glester discovers that these planets could be even more intriguing than we first thought. You can also hear Glester’s extended conversation with lead researcher Michael Gillon on the Cosmic Shed podcast .
Worldwide telescope attempts to image a black hole
An attempt to obtain the first ever image of the Milky Way’s supermassive black hole has begun. The Earth-sized Event Horizon Telescope (EHT) has launched a 10 day run to obtain the portrait via very-long-baseline interferometry (VLBI). The telescope comprises eight radio dishes across the globe, including the Atacama Large Millimeter/submillimeter Array (ALMA) in Chile, the South Pole Telescope (SPT) in Antarctica, and the IRAM 30 metre telescope in Spain. Since its first measurements in 2007, the EHT has yielded tantalizing results even without the full array of telescopes. Now, all eight are linked and looking at our black hole, Sagittarius A* (Sgr A*), as well as the even bigger one in the neighbouring galaxy M87. Although black holes are inherently invisible because of their extreme density and gravitational field, the researchers hope to image the point where matter and energy can no longer escape – the so-called event horizon. “This week heralds an exciting and challenging endeavour for astronomy,” says France Córdova, director of the funding agency National Science Foundation. For more information on the EHT, see our feature “Portrait of a black hole“.
Nanoparticles help molten polymers flow
The addition of tiny particles to a molten polymer can help the material to flow more easily, according to a study led by Erkan Senses and Antonio Faraone of NIST and the University of Maryland in the US. This comes as a surprise because normally the addition of nanoparticles to a polymer results in a reduction of flow. Polymer materials comprise long strand-like components that entangle together to form familiar materials such as plastics. Melting polymers so that they can be moulded and extruded plays an important role in manufacturing. However, the entangled nature makes it difficult for some molten polymers to flow. Senses and Faraone added gold particles just 3 nm in diameter to the polymer polyethylene oxide. Using a number of different analysis techniques, the team showed that the viscosity of the mixture was lower than that of pure polyethylene oxide. The nanoparticles are smaller than the gaps between the entangled strands, and by settling into these gaps, the team believes that the nanoparticles are able to push the strands apart and cause the molten polymer to flow more freely. The team also looked at what happened when 20 nm particles are introduced. These are larger than the gaps between the strands and they had the opposite effect of reducing the viscosity. The research is described in Physical Review Letters.
“Background-free” neutrinoless double-beta decay search comes up cold
GERDA – an array of semiconductor detectors immersed in a bath of liquid argon – has failed to see any evidence for neutrinoless double-beta decay. Neutrinoless double-beta decay is a hypothetical process whereby two neutrons in a nucleus decay to two protons and two electrons – but no neutrinos. Expected to be extremely rare, this decay process is only possible if the neutrino is its own antiparticle – a Majorana particle – which is a feature of some extensions to the Standard Model of particle physics. Measuring neutrinoless double-beta decay would provide important information about the masses of neutrinos – physicists know the particles have mass, but not what the masses of different types of neutrinos are. One of the few nuclei that could possibly undergo neutrinoless double-beta decay is the naturally occurring isotope germanium-76. GERDA takes advantage of the fact that germanium can be used to create very good radiation detectors. Neutrinoless double-beta decay would produce two electrons within a germanium detector, which creates two pulses of positive charge that are collected by an electrode. Because these pulses are created very close together in the detector, they will arrive at the electrode at more or less the same time. This allows GERDA physicists to reject background events involving stray gamma rays scattering twice from different places in a detector. To be extra sure of rejecting such background events, GERDA also looks for flashes of light in the liquid argon, which are produced when gamma rays pass through. The experiment is also surrounded by a tank of water that eliminates background signals from cosmic rays. Now, after running with this configuration since December 2015, the team has announced that the measurement is essentially free of background signals. While the researchers have not seen any evidence for neutrinoless double-beta decay, they can say that the half-life for the process in germanium-76 is greater than about 5 ×1025 years. Because of the background-free nature of GERDA, expanding its size and running it for longer times could help physicists decide whether neutrinos are Majorana particles. The results are described in Nature.
You can find all our daily Flash Physics posts in the website’s news section, as well as on Twitter and Facebook using #FlashPhysics.
Dangerous affair – an extreme ultraviolet image of a tangle of arched magnetic filed lines in the Sun’s corona, taken in January 2016 by NASA’s Solar Dynamics Observatory. (Courtesy: Solar Dynamics Observatory, NASA)
We all love a good disaster movie, but when it comes to real life it’s all too easy to downplay a dangerous but distant threat. Many people choose to live on active volcanoes, the citizens of San Francisco know that “the Big One” could strike at any moment, and yet they believe that the benefits of living in those locations outweigh the risk of a severe event happening in their lifetime.
The same dilemma faces the community of scientists, engineers and policy-makers who are working to understand the impacts of space weather – changes in the Earth’s environment that are largely are driven by physical processes originating from the Sun. Space weather has the potential to disrupt or even damage critical infrastructures on Earth, such as the power grids, aviation routes and communication systems that modern societies depend on, but the last notable event dates back to 2003.
That’s why Mike Hapgood, who heads up the Space Weather Group at RAL Space, part of the UK’s Rutherford Appleton Laboratory, has written a new, free-to-read Physics World Discovery ebook called Space Weather. “I thought it would be a great opportunity to highlight what space weather is really about, and to show how we are linking our scientific knowledge to a better understanding of the impacts on society,” he comments.
I am a mathematician at University College London with a key interest in seven-dimensional geometry. This sounds pretty far away from the real world of physics, so why am I writing an article in Physics World? I hope to convince you that this type of geometry not only is an exciting area of research being pursued by some of the world’s top mathematicians, but may also play a crucial role in enabling us to formulate a unified theory of physics.
(Courtesy: Science Photo Library/Harald Ritsch)
I have been fascinated by both maths and physics ever since my school days – a combined interest that has fundamentally shaped my academic career. Quantum theory and gravity in particular captured my imagination and I wanted to learn more. During my maths degree, I did very little geometry and instead took every physics option I could. It was only when I wanted to study Albert Einstein’s general theory of relativity that I realized it would be useful for me to know some more sophisticated aspects of geometry. Once I took my first geometry class, I was hooked, and when I found out that the connections between geometry and physics went much further than I thought, I knew that it was the research topic for me.
Luckily, I managed to do a PhD in this area and ended up studying it for a living. Along the way, I have found that it is possible to interpret many ideas in physics using geometry and, conversely, to use physics as a motivation in geometry to spectacular effect. The links between geometry and physics go back a long way and perhaps the most prominent player in the interaction is gravity.
Dimensions of gravity
When observing the everyday effects of gravity such as objects falling to the ground, one might intuitively think of gravity as a force of attraction between objects. This was the point of view Isaac Newton took, and although it was certainly very useful, it led to an incomplete theory.
Einstein’s fundamental idea in general relativity is to replace the notion of gravity as a force with, instead, gravity as an effect of the curvature of the universe. Describing gravity in this way shows that general relativity is inherently geometric. Einstein’s theory has concrete physical implications that have stood up to all experimental data so far, even those at extremely high precision: it enables us to use GPS; it correctly describes the behaviour of Mercury’s orbit; and it predicted gravitational waves, which were detected in 2015 by the Laser Interferometer Gravitational-Wave Observatory in one of the most exciting recent developments in physics.
Geometry is an invaluable (and arguably indispensable) tool in understanding gravity
Since Einstein’s pioneering work, it has been clear that geometry is an invaluable (and arguably indispensable) tool in understanding gravity. Additionally, we must consider geometry in more than our usual three dimensions, since general relativity is formulated in terms of space–time: a four-dimensional view of our universe where the three dimensions of space and one dimension of time can interact.
Most of us perceive the world in the familiar three spatial dimensions, so it can be challenging to conceptualize additional dimensions, which are not necessarily spatial. Let me illustrate with an example. Suppose you want to buy a piece of furniture, say a wardrobe. The size of a wardrobe is obviously important, since it has to fit in your home, so you need to know its height, width and depth – the three dimensions we know very well. However, there are many other factors involved in choosing the wardrobe, including its weight (if you have to get it up some stairs) and its cost. These are properties of the wardrobe that we can measure on a scale, just like height. Colour is another characteristic that can be assigned a number on a scale, using wavelength. In fact we can measure all sorts of aspects of the wardrobe, all of which can be thought of as dimensions.
In this way, we can have as many dimensions as we like, and we should not be worried by the idea of adding in more dimensions; they are just ways of talking about additional properties of an object. Of course, it becomes hard to picture what higher dimensions look like. This is where I and other mathematicians come in, since we have the tools to deal with geometry in any dimensions, not just describing it but solving problems there too.
In relativity, the idea of adding a fourth dimension, time, should now not be a concern. In fact, having time as another dimension is a very old idea in physics, but the key observation of Einstein is that the universe should curve in the time dimension; this is why clocks run more slowly when gravity is stronger.
For mathematicians, even though adding another dimension is easy, the geometries in three and four dimensions are very different, so the number of dimensions in the theory is very important. In fact, some of the most celebrated works in mathematics involve these geometries. In three dimensions we have the famous Poincaré conjecture, a Millennium Prize Problem worth $1m, which was solved by Grigori Perelman (though he refused both the prize and the Fields Medal – the top award in mathematics). On the other hand, Simon Donaldson was awarded the Fields Medal primarily for his work using inspiration from physics (specifically Yang–Mills theory, which forms the basis for the Standard Model of particle physics) to understand 4D geometry.
Clarifying M-theory Jason Lotay performs science stand-up explaining the concept of multiple dimensions using a toy lightsaber. (Courtesy: Bright Club)
Despite the successes of Newton and Einstein’s theories, our understanding of gravity is still incomplete. The most well-known shortcoming is that we have no theory that unifies gravity with quantum theory, which explains the behaviour of elementary particles. The struggle for this unified theory plagued Einstein and still remains an open problem.
There are also three gravitational phenomena that general relativity struggles to explain. The first is the “missing mass” known as dark matter, which various clues point to, including a mismatch between the speeds at which stars are predicted to move around their galactic centres, and those observed. The second is that, using the cosmic microwave background, the universe appears to “look the same” in all directions, which is most easily explained using the idea of inflation: that the universe underwent a period of rapid expansion after the Big Bang. The mechanism of inflation, however, is not readily compatible with general relativity. Finally, there is the problem that not only is the universe expanding, but that the rate of expansion is increasing; this is typically explained by so-called dark energy. General relativity can account for the rate of expansion, but only by introducing a cosmological constant, as Einstein himself did. However, the observed value of the constant does not match with any currently consistent theoretical prediction.
Taking a jump
In an attempt to unify gravity with quantum theory, physicists introduced string theory. The key idea of this theory is that rather than modelling particles by points or little round balls, as one does in quantum theory or from an intuitive perspective, we should instead view particles as being little “strings”: one-dimensional objects that can either be closed loops or open pieces with free ends. These strings can vibrate just like the strings on a guitar or in a piano, and understanding these vibrations then allows us (or at least string theorists) to describe and understand the particles.
This relatively simple idea has important physical consequences in that it can potentially provide a unified theory. It also adds geometry, and in particular curvature, into the game in a fundamental way. Unlike a point or round ball, a string can be curved and how it is curved can be influenced by the world around it. For example, if we lay a string flat on the table in a straight line it is not curved at all, but if we push it flush against a sphere, say a globe, then it will be curved since the sphere is curved.
Although string theory seems like a pretty simple idea, it has a complicated consequence. In order for the theory to make sense one needs to take a major jump: we have to add extra dimensions to the universe beyond the four we know. For a mathematician this is easy, but for a typical physicist this is quite tricky and hard to swallow (though hopefully my wardrobe analogy has made it a little bit easier). The theory does not say what these extra dimensions are: they are not something as concrete as space or time that we can add on. However, they do behave a bit like our usual spatial dimensions, and they are curved too in a special way, inspired by relativity.
So how many extra dimensions do we need to describe the geometry of our world? Well, it varies, but most string theories use 10 dimensions, so six more than the usual four. This seems like a lot, but in the past string theorists have considered using as many as 26, and for mathematicians the number six is still pretty small.
M-theory happens in 11 dimensions, so seven more than our usual space and time
Actually, when I said there is a theory called string theory in 10 dimensions, this is not quite true. There are actually several different string theories in 10 dimensions. This is quite embarrassing, because if we are looking for a unified theory then there should be just one. This problem caused consternation in the field until theoretical physicist and Fields Medal winner Edward Witten proposed a new theory of physics called M-theory.
M-theory happens in 11 dimensions, so seven more than our usual space and time. It has the great property that it shows that all of the string theories in 10 dimensions, which as I said all look different, are actually all special cases of this single 11D theory. So M-theory seems to be the unification of the string theories that the community was looking for. This means adding another dimension, but since we were already at 10, going to 11 does not seem like much of a stretch.
There is some debate as to what the M actually stands for. Some say it is for master theory or mother-of-all theory (since there is also an F-theory that might be father-of-all), or perhaps membrane theory. The last one makes sense because M-theory is not a string theory, as the fundamental objects are no longer 1D, but are instead higher-dimensional surfaces or membranes.
Inspired by bubbles
(Courtesy: Shutterstock/Yuliya Evstratenko)
We can write down equations for the seven-dimensional objects we are interested in, but it is hard to solve them. This should come as no surprise, as Albert Einstein’s equations describing only four dimensions gave rise to the same problem. Solving such equations is the key reason why studying gravity, and the analogous geometric problems that arise, is particularly challenging. However, I have been looking into a new approach to solving these equations that takes inspiration from a much more mundane topic in physics: bubbles.
When you blow a soap bubble, it starts off as some weird blob, but gradually becomes a sphere, as long as it does not pop. The reason is simple physics: the bubble will reach equilibrium when the pressure on the inside and outside match, which means the bubble will become a sphere. The bubble’s route to equilibrium can also be phrased in terms of its surface tension, which mathematically can be expressed as the fact that the bubble wants to minimize its surface area, given the volume of air it contains. The bubble does this automatically, and since we can model its evolution using an equation similar to one of the simplest evolution equations in physics, which describes how heat dissipates, we can solve it, or at least analyse it quite effectively.
Now, it turns out that the 7D objects we are looking for minimize a kind of area or energy like a bubble. This is not so surprising since these objects are supposed to come from physics, and we know that physical objects try to reach the state of least energy if they can. So, when starting from some (not quite random) 7D blob, we can write down a kind of heat equation, as devised by mathematician Robert Bryant of Duke University, North Carolina, US. When we solve this, it should hopefully lead us to the G2 geometry we are looking for (see main article), just like a soap bubble blob eventually becomes a sphere.
As I warned you before, the soap bubble can pop, and this is a real problem for our 7D equation, where the blob may well burst before we can reach the answer we want. However, I have been able to show that sometimes it does work and finds the 7D spaces we want.
The seven extra dimensions can be studied completely separately from the four dimensions we are familiar with from space–time, before being later combined in the full 11D M-theory. Although we cannot say what the seven extra dimensions are, they are not completely arbitrary. In fact, they are very special, satisfying equations similar to those appearing in general relativity, which makes sense because they are supposed to help us describe gravity.
The key to why 7D geometry is interesting in mathematics and physics is symmetry
What is really fascinating is that the simplest case of these equations also appears in geometry and is a key equation that mathematicians have long been studying and continue to explore. Some of the best mathematicians study this geometry, including three Fields Medallists: Michael Atiyah, as well as Simon Donaldson and Witten. This is something I have also been working on, taking inspiration from physics (see “Inspired by bubbles” box above).
The key to why 7D geometry is interesting in mathematics and physics is symmetry. We know that objects like cubes and spheres have lots of symmetry, in that they look the same from many (and sometimes all) angles, whereas other shapes such as oblongs and rugby balls have less symmetry. A crucial mathematical fact is that the types of symmetries that can occur for various geometric objects depends very much on how many dimensions we are working in. Even more important is that there is a special type of symmetry that can occur only in seven dimensions. This symmetry leads to so-called G2 geometry in seven dimensions, and it is this geometry that plays a major role both in modern mathematics and in M-theory.
Progress through collaboration
Theory is all well and good, but can we link any of this M-theory stuff to experiments? Well, yes we can. I have been discussing research with King’s College London physicist Bobby Acharya, who has worked with Witten on studying fermions in M-theory and is currently focused on trying to link the theory to observations in cosmology as well as experiments at CERN’s Large Hadron Collider.
One of the most exciting recent discoveries in particle physics has been the Higgs boson, but why does it have the mass we observed? This is a question that M-theorists hope to answer. As we get more information from space telescopes, and powerful ground-based telescopes too, we learn more about black holes, the acceleration of the universe and the rotation of galaxies. As a consequence, we get more observations that help us to understand dark matter and dark energy, and their effects. With these insights, it is hoped that one can use M-theory to give a satisfying explanation of these phenomena, which currently cannot be explained well by general relativity.
Again, in order to achieve this, we need to know a lot about the possible 7D geometries that can occur, and so I (and other mathematicians) have been talking with Acharya and other physicists such as Sergei Gukov at the California Institute of Technology, US,and James Sparks at the University of Oxford, UK, to see if we can make progress in both maths and physics through collaboration.
Although G2 geometry plays a key role in M-theory, there is still much that we do not understand. On the mathematical side, we have a limited understanding of 7D geometry and so we need to work hard to find and analyse the kinds of objects that are needed to make M-theory work. On the physics side, we need to continue to strive to connect M-theory to concrete observations so it can be tested, and we need to pin down precisely the 7D geometry that forms the extra dimensions in M-theory. These are certainly difficult problems, but there has been a recent upsurge in activity in this area so it is an exciting time in the field, on both the maths and the physics side. I am hopeful that soon, by having mathematicians and physicists working together, we will have major breakthroughs that will shed light on 7D geometry and bring us a step closer to that elusive unified theory of physics.
In his Prague lab in the late 1800s, the Austrian botanist Friedrich Reinitzer was studying a substance called cholesteryl benzoate (C34H50O2) when he discovered something odd. The stuff was solid at room temperature and, as Reinitzer applied heat, it melted at 145.5 °C to form a cloudy fluid and then, above 178.5 °C, turned completely clear. As if that wasn’t puzzling enough, when the transparent liquid cooled, rather than reverting to the cloudy liquid as one might expect, it first turned blue and then violet. Confused, Reinitzer wrote to Otto Lehmann, a German physicist in Aachen, to see if he could confirm and explain these mysterious observations.
Lehmann concluded, with the aid of an advanced microscope, that the cloudy liquid Reinitzer had seen was a new kind of matter that could flow, like a liquid, yet contained microscopic crystals, like a solid. Lehmann named the substance a “liquid crystal” – a term that has stuck ever since. We now know there are several types of liquid crystal, the simplest of which consists of rod-like molecules that line up in parallel. These “nematic” liquid crystals are used in countless laptop, computer and smartphone screens, underpinning a multi-billion-dollar display industry.
In the 1920s the French crystallographer Georges Friedel discovered that the cloudy liquid that Reinitzer had seen was a “cholesteric” liquid crystal, in which the rod-like cholesteryl-benzoate molecules are arranged in layers. Although the rods can move freely in 3D, they always point along a common axis, with this axis pointing in a direction that twists by a small angle as you go from one layer to the next. As for the blue liquid, in time it was discovered that there are three blue phases – dubbed I, II and III – each with its own microscopic structure. Reinitzer had seen them all, but being unable to fine-tune the temperature of his primitive lab equipment, he could not stabilize or study the different phases.
The properties of each phase remained a mystery for decades and it was not until the 1980s that researchers eventually identified the intricate molecular structures of two of the blue phases – I and II. Discovering the inner workings of these phases required beautiful analytical and numerical research, notably by groups led by Shmuel Shtrikman at the Weizmann Institute of Science in Israel and James Sethna at Cornell University in the US. But the properties of blue phase III – dubbed the “blue fog” – left scientists stumped.
Making inroads
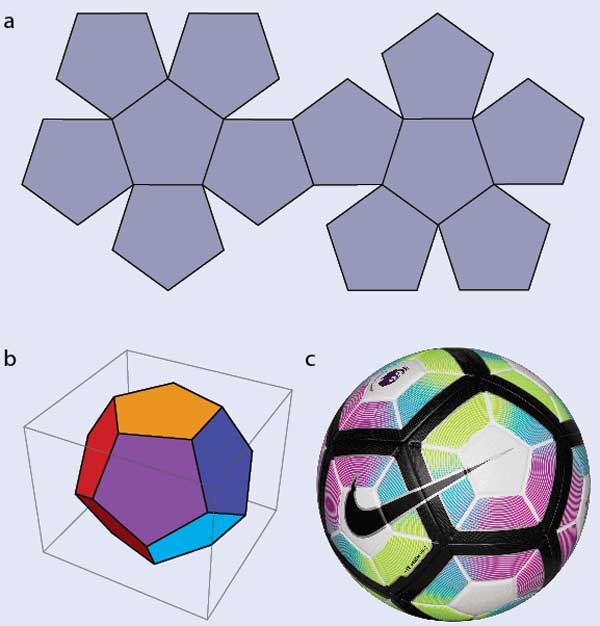
1 Keep feeling frustration Try to tile a floor with pentagons and you’ll end up with gaps (a). Pentagons, however, fit nicely on a dodecahedron (b) or, if you bend them slightly, on a sphere such as the official 2017 English Premier League football (c). Hexagons, on the other hand, can’t cover a sphere properly; if you tried, you’d need to place pentagons between the hexagons to patch up the structure. Being unable to fill a surface is known as geometrical frustration and is the key to the blue liquid-crystal phases. (Ball image courtesy: Nike Media Europe)
Understanding blue liquid-crystal phases requires first grasping some key concepts. Let’s start with a seemingly unrelated problem: how to tile your bathroom or kitchen floor. Square or rectangular tiles are simple and will do the job nicely, and hexagonal tiles would too. Pentagonal tiles, however, are a complete non-starter: there’s no way to arrange them on a flat surface without leaving gaps (figure 1a). In 3D, it’s a different story: pentagons can form a dodecahedron (figure 1b) and, if you let them curve slightly, a 2017 Premier League football (figure 1c.). If you tried to make a football from hexagons, however, you’d find that you need to add pentagons where the hexagons don’t meet.
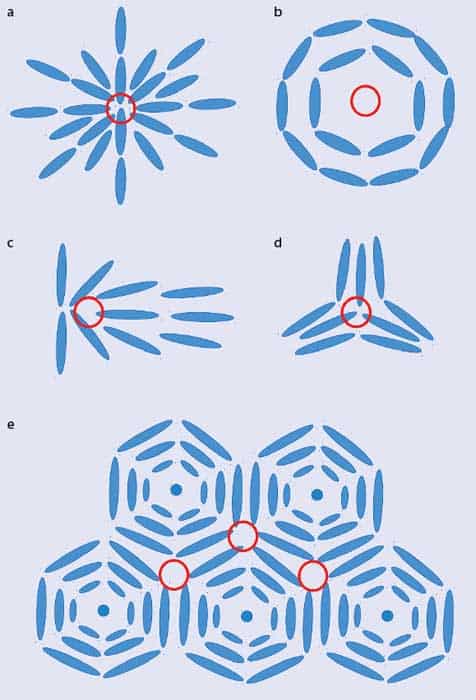
Unsuccessfully trying to tessellate shapes, such as pentagons on a flat surface or hexagons on a sphere, is dubbed geometrical or topological “frustration” and it leads to defects where the shapes don’t fit together nicely. The same phenomenon is also found in liquid crystals. While most liquid-crystal molecules are locally aligned within their layers, there are regions where the local direction of the molecules is undefined. At these “topological defects”, the molecules point all over the place. Example defect structures include the hedgehog, the vortex, the central ridge field and the triradius (figures 2a–d). You can see similar patterns in your own fingerprints: the friction ridges on your finger align locally but there are also features, such as deltas and cores, where the ridges point in many directions, meaning that the underlying physics (and patterns) are broadly the same.
2 Liquid-crystal defects Defects are bad news as they raise the energy of liquid crystals but hold the key to their blue phases. Nematic liquid crystals, which consist of rod-shaped molecules, can form patterns such as a hedgehog (a), a vortex (b), a central ridge field (c) and a triradius (d), with the defect sites marked by the red rings. The pattern in (e) shows that “doubly twisted cylinders”, with axes perpendicular to the plane of the paper, cannot fill space nicely. There is instead frustration, and triradii show up where the cylinders touch. In the blue phases, therefore, the cylinders are arranged in 3D.
To understand the blue phases, as opposed to regular phases of liquid crystals, requires one more step. Liquid-crystal molecules can form blue phases only if they are “chiral” – in other words, they don’t look the same as their mirror image. It was pure coincidence that cholesteryl benzoate, which Reinitzer was studying, was not only the first liquid crystal to be observed but also cholesteric. But whereas a standard cholesteric liquid crystal has a twist along a single axis, in a blue phase the twist can be along many different directions. Figure 2e, for example, is a schematic 2D representation of “double-twist cylinders”, in which the twist of the molecules is around two different directions.
The key point is that a parallel array of double-twist cylinders doesn’t properly fit together. Instead, like pentagons on a bathroom floor or hexagons on a sphere, the cylinders show frustration and defects appear between them, often as triradii. It’s an energetically unfavourable situation because the material isn’t in its lowest possible energy state. Forming double-twist cylinders is simply a case of making the best out of a bad job.
A structure such as the array of double-twist cylinders in figure 2e, which has a uniform 2D cross section, is useful to explain the origin of blue phases but in practice it forms only if there’s a strong enough electric or magnetic field. Under normal conditions, blue phases I and II have the cylinders arranged in 3D. In blue phase I, the resulting symmetry is that of a simple cubic lattice, and in blue phase II that of a face-centred cubic lattice. The materials are so vividly coloured because the lattices’ unit cells are each roughly the same size as the wavelength of visible light, giving rise to interference and diffraction patterns.
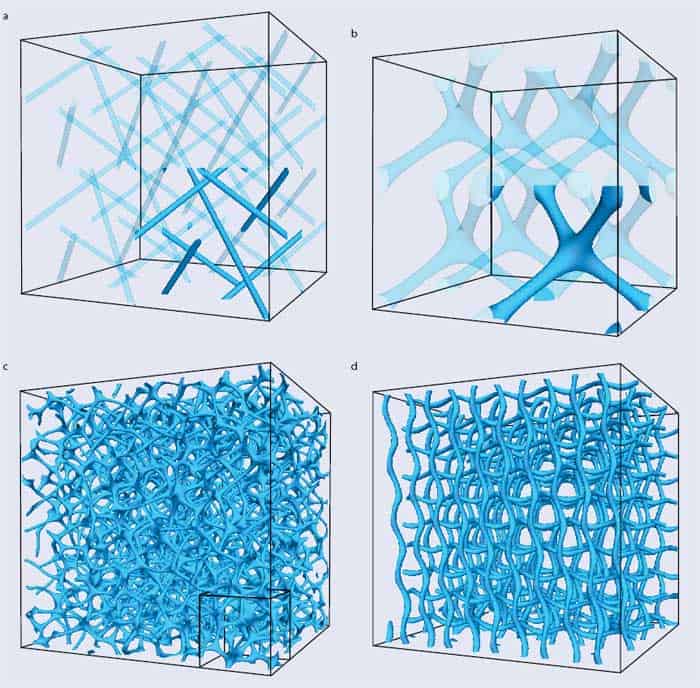
As drawing the orientation pattern of all molecules in 3D would be messy, we visualize blue phases by showing either the pattern of double-twist cylinder packing, or the defects only. The latter choice leads to visually striking patterns: the defects join up in lines to form “disclinations”. In blue phase I (figure 3a) these disclinations avoid each other, whereas in blue phase II they merge to form four-fold junctions (figure 3b). Such junctions are complex defects, and theory suggests that they are the weakest point of the blue phase II network, being first to rupture if the sample is subject to an external flow or an electric field.
Lifting the fog
3 Final structures Simulations of the defect networks for (a) blue phase I, (b) blue phase II, (c) a candidate structure for blue phase III with the small cube showing a region similar in size to those of the unit cells highlighted in I and II, and (d) an ordered blue phase III in an electric field. (a and b courtesy: Advanced Materials28 8998; b and c courtesy: Oliver Henrich and Davide Marenduzzo)
By the late 1980s blue phases I and II were well understood, but the properties of blue phase III (the blue fog) still remained elusive. There were clues to its structure but no proof, and by the late 1990s research into this phase of matter was losing steam. To the rescue came supercomputers. Researchers had started developing powerful algorithms that could reveal how liquid-crystal molecules arrange in space, helped in part by the growth of parallel computing, which allows complex calculations to be more easily carried out. Various groups specializing in simulations of soft condensed-matter systems started returning to the old blue phases, including those led by Julia Yeomans at the University of Oxford in the UK, Slobodan Zumer at the University of Ljubljana in Slovenia, and ours in Edinburgh.
They realized that computers are ideal tools for studying blue phases, which have such intricate 3D structures that old-fashioned paper-and-pencil calculations are too cumbersome to yield answers. Indeed, the disclination networks in figures 3a–b come from large-scale simulations of blue phases I and II. Interest in the blue phases was also rekindled by potential technological applications as well as the fact that they could now be stabilized over a wide range of temperatures.
Over the last decade, computer simulations have revealed a potential candidate structure for blue phase III. As we reported in a paper published in 2011 with our Edinburgh colleagues Kevin Stratford and Mike Cates (now at Cambridge), once seeds for double-twisted cylinders were planted in an isotropic background, they grew to form amorphous networks such as that in figure 3c (Phys. Rev. Lett.106 107801). The structure was deemed a candidate for the blue fog because it arises spontaneously from a physically plausible initial condition, and appears in the right part of the phase diagram where experiments typically observe blue phase III.
The amorphous network had additional features that further reinforced the possible link to the blue fog. First, our simulations showed it was very stable, rearranging very little even over several milliseconds. Second, its free energy was lower than that of other cubic blue phases, or indeed any other regular structures to have been proposed. The stability and low free energy of the structure we found was surprising because window glass – the archetypical amorphous material – is metastable, with the true equilibrium state being a regular crystal. Blue phase III, instead, may be a very rare example of a thermodynamically stable glassy material. A final intriguing feature of the proposed amorphous network was that it becomes ordered in the presence of an electric field, just as blue phase III does in reality, transforming into the more regular network seen in figure 3d.
Confirmation and memory
It was all well and good to have simulations suggesting that the blue fog is an amorphous network of defects, but what researchers really needed was experimental verification. However, observing the disclinations directly seemed an impossible goal given that these defects are about 10 nm thick and optical microscopes can resolve distances down only to about 200 nm. Fortunately, experimentalists had a trick up their sleeve. By mixing long-chain polymer molecules equally throughout the blue phase, they realized they could cover up the network of disclinations. As the defects are the most energetically costly parts of a liquid crystal, eliminating them stabilizes the material by lowering the overall energy of the system. That, in turn, allows all three blue phases to be studied over a much wider range of temperatures – as much as 60 °C rather than 1 °C.
Researchers in Liang-Chy Chien’s group at Kent State University in the US then realized that if they could wash away the liquid crystals in a polymer-stabilized blue phase III, they’d end up with a polymer scaffold that retains a “memory” of the original disclination. They could then use, say, a scanning electron microscope to view this network and see the defects. In practice, Chien and his group didn’t add polymers directly but instead added small molecules that they then fused together with light to create long chains. The resulting images were qualitatively consistent with the simulated network and confirmed that the blue fog is an amorphous network of disclinations.
As a bonus, the experimental technique for creating the scaffold is technologically useful. If it’s refilled with a non-chiral liquid crystal, the resulting sample becomes like the blue fog. The scaffold causes the liquid-crystal molecules to recreate the orientation pattern of the original blue phase. This imprinting is useful as it can occur outside the temperature range for which the blue fog was initially stable.
Liquid crystals are used mainly in technology for display applications, where the ability to switch between two different phases is used to let light through, or not. Applying an electric field to the refilled scaffold with the blue fog state creates a field-induced state, in which the molecules all lie along the field direction and let light through. In principle, switching between the two states can be done in barely a few milliseconds – faster than for common liquid-crystal devices based on the simpler nematic phase.
Korean hi-tech giant Samsung Electronics once showcased a blue-phase liquid-crystal-display (LCD) panel at the Society for Information Display’s 2008 international symposium, seminar and exhibition in Los Angeles. Although that first prototype did not move into production, some novel designs have recently been proposed. Blue phase III-based displays offer great promise for future devices, possibly sooner than we might think. So is the mystery of the blue fog over? Yes, at least partly, with Chien and collaborators’ work strongly pointing to it having an amorphous disclination network structure. But questions remain. Can we use polymer scaffolding to view the structure that the blue fog morphs into under a field to see how it compares to predictions from simulations? More fundamentally, can experiments reveal more about the mechanism that creates the amorphous fog network? The story of the blue fog may not, after all, be quite over yet.