NASA has launched the first US mission to take samples from an asteroid and return them to Earth. The $1bn Origins-Spectral Interpretation-Resource Identification-Security-Regolith Explorer (OSIRIS-REx) took off yesterday from Cape Canaveral in Florida at 19:05 local time aboard an Atlas V rocket. It now begins a two-year journey to the asteroid Bennu, where it will aim to gather around 60 g of dust, soil and rubble from the body and return it to Earth.
Weighing 1500 kg, OSIRIS-REx’s main aim is to measure the abundance and types of organic materials that make up asteroids. This could give researchers a better understanding of how life began on Earth. Bennu, which was discovered in 1999, is an ideal target as it was supposed to have formed at the same time as the Earth. It is a chunk of dust and rubble around 500 m in diameter that is thought to be rich in carbon and organic molecules.
“This represents the hopes and dreams and blood, sweat and tears of thousands of people who have been working on this for years,” says Dante Lauretta from the University of Arizona, who is principal investigator for OSIRIS-REx. “I can’t tell you how thrilled I was thinking of the people who played a part in this.”
Extending an arm
Once OSIRIS-REx arrives at Bennu in 2018, it will spend a couple of years surveying the body using its five instruments – three spectrometers, a camera suite and a laser altimeter – to select a suitable site for sampling. The craft will then carefully approach the asteroid – although never actually landing on it – and extend a 3.3 m arm that will fire nitrogen gas at the surface. This jet will break off samples that the probe will collect to return to Earth in 2023.
OSIRIS-REx will also attempt to measure – for the first time – the force acting on a rotating body in space caused by photons. Known as the “Yarkovsky effect”, after the Russian civil engineer Ivan Osipovich Yarkovsky, it is a result of the asteroid absorbing sunlight and then re-emitting it as heat. A better understanding of the effect will let scientists more accurately predict the path of an Earth-approaching asteroid. “The knowledge from the mission will help us to develop methods to better track the orbits of asteroids,” notes Jim Green, director of NASA’s planetary science division.
If successful, OSIRIS-Rex is set to become the third mission to return a sample of an asteroid to Earth. In 2010 the Japanese Space Agency’s Hayabusa mission returned around 15,000 “grains” from the Itokawa asteroid. In 2014 Japan launched Hayabusa 2, which will aim to return samples from asteroid 1999 JU3 – an almost spherical carbon-rich asteroid that is 920 m in diameter and is thought to contain organic matter and hydrated minerals – by 2020.
NASA also hopes that the mission will demonstrate advanced imaging and mapping techniques that will be required for future science missions, as well as upcoming commercial asteroid-mining trips. Indeed, just last month Deep Space Industries announced the firm’s first commercial mining mission. Prospector-1, which is planned to launch around the end of the decade, will monitor an asteroid close to Earth and land on it to determine the body’s hardness and other geological characteristics.
Nancy Levenson appointed deputy director of US telescope institute
Looking ahead: Nancy A Levenson has been appointed deputy director of the Space Telescope Science Institute (STScI) in Baltimore, Maryland, US. (Courtesy: N Levenson and STScI)
Nancy Levenson has been appointed deputy director of the Space Telescope Science Institute (STScI) in Baltimore, Maryland, taking up the position in early November. The Institute is the science operations centre for the Hubble Space Telescope and the James Webb Telescope, which is scheduled to launch in 2018. Levenson studied physics at Oxford before doing a Masters and PhD in astronomy from the University of California, Berkeley. A year after completing a postdoc at Johns Hopkins University in 2001, she moved to the University of Kentucky. Since 2009, she has been deputy director and head of science at the Gemini Observatory in La Serena, Chile.
πΚ atoms reach discovery status after nine-year effort at CERN
Atom-like bound states of π and Κ mesons have been discovered by physicists working on the DIRAC collaboration at CERN in Switzerland. The atoms come in two types – π–Κ+ and π+Κ– – and were first sighted by DIRAC in 2007. However, those measurements were far off the statistical significance of 5σ, which is required for discovery status in particle physics. Now, after nine years of effort to understand and reduce background effects and improve the detector set-up and response, the team has observed a total of 349 πΚ atoms with a significance of 5.6σ. The atoms are made by firing 24 GeV/c protons from CERN’s Proton Synchrotron into a thin nickel target. Further study of the atoms could lead to better computational strategies for using quantum chromodynamics to calculate the properties of particles (such as mesons) that are made of quarks. The work is described in Physical Review Letters.
Super bright: simulating monster pulsars The new lighthouse model and simulation results from the present research (inset on the right.) In the simulation results, the red indicates stronger radiation, and the arrows show the directions of photon flow. In this figure, many photons are produced near the surface of the neutron star and escape from the side of the accretion column. (Courtesy: NAOJ)
Simulating ultra luminous ‘monster pulsars’
Researchers at the National Astronomical Observatory of Japan (NAOJ) have used a supercomputer to recreate a “monster pulsar”. The team’s numerical simulations suggest that the main energy source of such pulsating “ultraluminous X-ray sources” (ULX) could be a neutron star. As ULXs are so bright, they were previously thought to be powered by black holes, but a 2014 observation of periodic pulsed emissions in a ULX puzzled astrophysicists, as black holes would not produce such pulsed emissions. On the other hand, a regular pulsar would be too faint to be a ULX. Led by Tomohisa Kawashima, the team performed simulations to see if there is some way the accretion columns of gas falling into a pulsar could flow smoothly and become hundreds of times brighter than normally allowed. The research is published in the Publications of the Astronomical Society of Japan.
Researcher honoured for studies of glass under pressure
You can find all our daily Flash Physics posts in the website’s news section, as well as on Twitter and Facebook using #FlashPhysics. Tune in to physicsworld.com later today to read today’s extensive news story on the launch of NASA’s OSIRIS-Rex asteroid-mining mission.
Physicists in China have devised a new way of sending tiny amounts of liquid uphill and around bends. They do so using very narrow, artery-like structures made from a liquid crystal polymer that changes shape when exposed to light. The technology could be used in so-called laboratories-on-a-chip or in tiny mechanical systems activated by light, they say.
The work is the latest development in a field known as microfluidics, which involves studying the behaviour of fluids with volumes as small as a trillionth of a litre that are channelled along tubes a few micrometres in diameter. Labs-on-a-chip integrate many such channels on a single tiny substrate in order to carry out on a far smaller scale – and potentially much more quickly – the kinds of experiments usually performed using test tubes, beakers and other traditional lab equipment. Applications include wide-ranging medical diagnoses and the monitoring of atmospheric trace gases.
Microfluidic operations are often implemented using external transducers – such as pumps, valves or electrodes – that are in direct contact with the fluid. However, according to Damien Baigl of the École Normale Supérieure in Paris, the use of such transducers tends to make devices complex, expensive and fragile, and can also limit potential applications. Light, on the other hand, can impart energy to fluids without direct contact, he points out. It can also be tuned over a wide range of wavelengths and power levels, provides excellent spatial and temporal resolution and is biocompatible.
Capillary forces
Exploiting light’s attractive properties in a practical device is a challenge, however. One option is to use the force of light directly – either through radiation pressure or using what are known as optical tweezers to trap tiny solid particles in a liquid – but this tends to require very powerful laser beams. An alternative approach is to make use of the capillary forces caused by liquids’ adhesion to other molecules. These are commonly seen when a liquid rises up the inside of a narrow tube in opposition to gravity.
This latter approach has been taken by Yanlei Yu of Fudan University in Shanghai, and colleagues. Yu’s team exploits the fact that a droplet of liquid confined in a cone-shaped tube will be pushed towards the narrower end of the tube as a result of the lower pressure there. The trick was to find a substance to make structures that could be changed from cylinders to cones when exposed to light. Specifically, the researchers needed to identify a liquid-crystal structure that was mechanically and also chemically robust when undergoing such transformations.
They succeeded. To do so they took inspiration from natural arteries, vessels that carry blood away from the heart using alternate layers of muscle and elastic material. The team built tubes about 0.5 mm across made up of multiple layers of liquid crystal polymer, and exposed the tubes to blue light from an LED. The light shifted the orientation of the liquid crystal molecules so as to slightly squeeze the tubes – changing their cross section from a circle to an ellipse and thereby increasing their cross-sectional area. By progressively increasing the intensity of the light along the length of the tubes the researchers were able to transform the tubes into cones.
Slug sandwich
By sandwiching a “slug” of one fluid between portions of another inside a tube and illuminating the tube, the researchers found, as expected, that they were able to move the slug in the direction of decreasing light intensity (see video, above). They did so with various combinations of fluids, including silicone oil interspersed with either air or rapeseed oil, as well as with more complex fluids used in biomedical and chemical engineering. They were able to repeat the trick for tubes inclined at up to 17°, for snakelike tubes, helical tubes and also tubes shaped in a Y that allowed two silicone oil slugs to fuse. They could even push slugs around when placing a 1 mm thick piece of lean pork between light source and tube. “These experiments demonstrate that our [tubes] have promise for application in microfluidic systems embedded in biological tissues,” they write.
Miles Padgett of the University of Glasgow, who works on optical tweezers, is also confident that the latest work could lead to important applications. “So often labs-on-a-chip look more like chips in a much larger lab,” he says. “So replacing external pumps with light sources that could themselves be integrated and provide sufficient drive to mix liquids together is a significant step forward.”
Baigl describes the work as “a totally new concept” in light-driven microfluidics, arguing that it “greatly expands the available optical toolbox” in this field. The challenge now, he says, will be to “demonstrate that real-world microfluidic applications can be achieved by this method, using light instead of pumps”.
The designer of a simple refrigerator, which cools vaccines being distributed in remote regions of the world, has been awarded the 2016 UK James Dyson Award, worth £2000. William Broadway, an industrial design and technology student at Loughborough University, invented the device, called ISOBAR, to help stop vaccines from spoiling before they reach recipients. It contains a mixture of ammonia and water and is primed with an external heater, which causes the mixture to separate. The ammonia is held in a separate chamber and, when cooling is required, the ammonia and water are allowed to recombine in a process called two-phase absorption refrigeration. The process was first patented in 1906 by Albert Einstein and was used commercially in the early 20th century before being largely forgotten.
Australian gravitational-wave observatory announced
The Australian Research Council (ARC) has announced a new A$31.3m ARC Centre of Excellence for Gravitational Wave Discovery, which will be hosted by Swinburne University of Technology. The centre, to be named OzGRav, will open in early 2017 and is set to boost the country’s work on gravitational waves, which were first detected by scientists working at the US Advanced LIGO (aLIGO) detectors in Washington and Louisiana earlier this year. OzGRav also aims to help improve aLIGO’s sensitivity, thus increasing the volume of the universe that can be probed by an order of magnitude. “Through this centre, Australian scientists and students will have the opportunity to fully participate in the birth of gravitational wave astronomy,” says Centre director Matthew Bailes. “It will enable us to develop some amazing technologies like quantum squeezing to further enhance the detectors, supercomputers and advanced algorithms to find the waves, and these will lead to a revolution in our understanding of the universe.”
The ARC has also announced eight other Centres of Excellence that will receive funding in 2017 including the ARC Centre of Excellence for All Sky Astrophysics in 3 Dimensions, at the Australian National University; the ARC Centre of Excellence for Quantum Computation and Communication Technology, at the University of New South Wales and the ARC Centre of Excellence in Exciton Science, to be established at the University of Melbourne.
Nobel laureate Yang objects to China’s super-collider plans
Nobel-prize winning physicist Chen Ning Yang has come out against China’s proposed plans to build a super particle collider, reports the South China Morning Post. In an article released by Yang this weekend, the laureate claims that the project does not have enough scientific value and said that the project would become an investment “black hole”, citing the cancellation by the US of a similar $3bn supercollider in 1993. Yang’s critique is the latest in the ongoing debate surrounding the project, which was proposed four years ago and would see China build a collider four times the size of the Large Hadron Collider in Geneva. According to the Post, the first stage of the project was estimated to cost 40bn yuan by 2030, and the total cost would exceed 140bn yuan when construction is completed in 2050, making it the most expensive research facility built in China.
Mapping how the Milky Way has aged
A new map showing the age and location of more than 130,000 “blue horizontal branch” stars in our Milky Way galaxy has been created by Daniela Carollo, Timothy Beers and Vinicius Placco at the University of Notre Dame in the US, and colleagues, using data from the Sloan Digital Sky Survey. The age of these very old stars can be determined by their colour alone. The map shows that older stars tend to cluster closer to the centre of the Milky Way, whereas younger stars tend to be located further out. “Once you have a map, then you can determine which stars came in first and the ages of those portions of the galaxy,” says Beers. “We can now actually visualize how our galaxy was built up and inspect the stellar debris from some of the other small galaxies being destroyed by their interaction with ours during its assembly.” The map is published in Nature and supports the hierarchical model of galaxy formation, whereby small agglomerations of stars and gas come together to form a galaxy like the Milky Way.
You can find all our daily Flash Physics posts in the website’s news section, as well as on Twitter and Facebook using #FlashPhysics. Tune in to physicsworld.com later today to read today’s extensive news story on sending fluids round the bend.
We all know that space is big. Exactly how big, though, is hard to measure. The distances to stars and other celestial objects are rarely known accurately, or even measured directly. Instead, astrophysicists calculate cosmic distances based on a “ladder” of successive calibration steps. This process begins by using a variety of methods to calibrate the relationship between the period of pulsation and the intrinsic luminosity for certain types of stars, known as Cepheid and Mira variables. Next, these variable stars are used to determine the distances to galaxies in which type Ia supernovae have exploded. Finally, the brightnesses of these type Ia supernovae are corrected to account for their intrinsic diversity.
This complex process inevitably introduces systematic errors. A relatively well-known example is the two “classic” determinations of the cosmological Hubble constant, which were both derived from Hubble Space Telescope data, and which differed by 10%. But the effects of such systematic errors are widespread, touching everything from exoplanet astronomy and stellar evolution to dark-matter dynamics and fundamental physics.
The reason why astronomical distances are so difficult to measure directly can be summed up in one word: parallax. As the Earth travels around the Sun, the position of nearby stars appears to shift relative to more distant background objects. The angle of parallax is defined as the apparent change in line-of-sight direction to an object caused by the changing position of the observer, and basic trigonometry shows that this angle is inversely proportional to the star’s distance from Earth. But because even the nearest stars are (astronomically) far away, their associated parallaxes are tiny. Most amount to less than a few hundred microarcseconds (μas), where 1 μas is equivalent to the thickness of a human hair seen from a distance of 10,000 km.
To measure such small angles, astronomers must make repeated, highly accurate position measurements over a period of several years, in order to separate parallax from a star’s “proper” motion (motion due to its orbit in the galaxy) and from perturbations caused by the gravitational field of an associated companion star and/or planetary system. In 1989 the European Space Agency (ESA) launched a satellite, Hipparcos, to perform such measurements. During its three-year mission, it measured the absolute parallax of more than 30,000 stars, with an accuracy of better than 10%. But in a galaxy that contains 100 billion stars, the Hipparcos measurements could only show us a small part of the picture.
Now, however, the field of precision astrophysics is about to enter a new era. This month marks the first major release of data from ESA’s Gaia mission, a follow-up to Hipparcos that was launched on 19 December 2013 and is now orbiting around the L2 Sun–Earth Lagrangian point, some 1.5 million kilometres from Earth. Gaia’s data-collecting ability is truly astonishing: in one hour of operations, its instruments can take 10 million astrometric measurements and record 300,000 spectra of 100,000 stars. During its five-year sky-scanning mission, Gaia will observe each of its targets around 80 times, enabling scientists to quantify the variability of stars and other light sources; determine their positions and motions (astrometry); and measure their apparent brightness and energy distribution (photometry).
All told, Gaia will make precision distance measurements on some 1.5 billion stars, with an accuracy of up to 10 μas for the brightest among them. The sheer volume of data means that Gaia is set to revolutionize astronomical distance measurement. In doing so, the mission will have broad implications for almost the entire field of astrophysics.
An orbiting optical bench
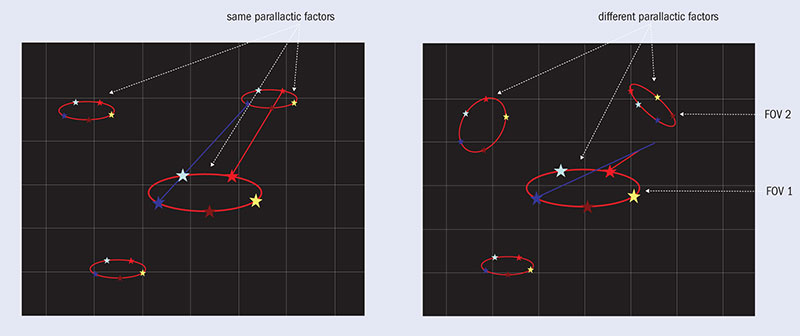
The Gaia spacecraft is elegantly simple, consisting of a circular optical bench that supports two telescopes. The pair of telescopes is a crucial part of Gaia’s design. With a single telescope, it is only possible to calculate a star’s parallax relative to other stars within that telescope’s field of view (figure 1a). However, with two telescopes that are separated by a (very precisely known) large angle, and that each feed light into a single optical camera, it is possible to measure parallaxes absolutely (figure 1b).
1 Astronomical parallax measurements The apparent location of a star as seen from Earth varies systematically depending on the position of the Earth in its orbit around the Sun. Over the course of a year, each star appears to trace out an ellipse on the sky, and the semi-major axis of this ellipse is inversely proportional to the star’s distance from Earth. Colours indicate the positions of the stars at different seasons of observation. (a) shows these parallax ellipses in a single small area of the sky, which means that the ellipses are all aligned. In (b), parallax ellipses from different parts of the sky (field of view 1 and field of view 2) have been projected onto the same image. In this case, the ellipses are not aligned, while the large angle between the two fields of view can be calibrated independently to a very high accuracy. This angle, together with the small angles in the focal plane, allows the parallax displacements to be disentangled, giving more accurate measurements.
This two-telescope method of measuring parallax was first used on the Hipparcos satellite, but other aspects of Gaia’s instrumentation are novel. Its 0.9 m-long, billion-pixel camera is exceptionally large by spacecraft standards, and its 106 charge-coupled device (CCD) sensors deliver impressive dynamical range, collecting light from objects whose apparent magnitudes range from –1.5 (the bright star Sirius) to 20.7 (more than 5 × 10⁸ times fainter). For each of the 1.5 billion stars Gaia detects, the spacecraft is measuring the broadband optical flux and associated image centroid. This, together with spectrophotometry over the 300–1000 nm range, makes it possible to derive the temperatures and surface gravities for each star, and also to quantify how much cosmic dust is blocking our view of it. A moderate dispersion spectrograph is used to derive radial velocities for the 100 million stars brighter than about magnitude 15.5.
Another innovation is that Gaia’s entire structure is made of silicon carbide (SiC), a compound with a very high strength-to-mass ratio and very low coefficient of thermal expansion. But space is a harsh environment, and the angle between the two telescopes changes as the optical bench and telescope structure react to small temperature variations. By normal standards, the angle variation is tiny: it is equivalent to moving one of the telescope’s primary mirrors by roughly the diameter of a single helium atom. This is, however, “large” by Gaia’s standards – an indication of just how precise this spacecraft has to be.
Other technical challenges include local mechanical adjustments, known as “clanks”, which are caused by local thermal variations. Clanks torque the spacecraft, and are often linked to specific orientations of the satellite, but they are not repetitive enough to predict and so must be accounted for using the data itself. Stray light is also an issue: small threads at the edge of the spacecraft’s solar shield can refract stray sunlight into the telescope, while light from the galactic plane has found a few “unauthorized” ways of getting through the telescope to reach its focal plane. And early in the mission, Gaia experienced a few problems with water condensation on mirrors, which were resolved by occasionally heating the mirrors.
Just getting started
The task of processing Gaia’s data (and dealing with the above-mentioned systematic effects, which add just enough complexity to keep things interesting) falls to a consortium of 450 scientists at six data processing centres: ESAC and Barcelona in Spain; CNES in France; Cambridge, UK; Geneva, Switzerland; and Torino, Italy. This consortium is due to release the first big set of Gaia data on 14 September, in the form of two catalogues: one containing positions and magnitudes for around 1.4 billion stars down to magnitude 20.7; and one containing valuable astrometric data for around two million bright stars.
Before the end of its initial five-year mission (it may be extended for a further five years), Gaia aims to deliver a census of more than a billion stars, providing astrometric, photometric, spectrophotometric and spectroscopic data at unprecedented levels of accuracy, precision and volume. Even in its early stages, it is already proving a success: the spacecraft and data-processing systems are working well, the first “taster” of science data is now public, and there is much, much more to come. The astrometric revolution is truly under way.
Galaxy structure
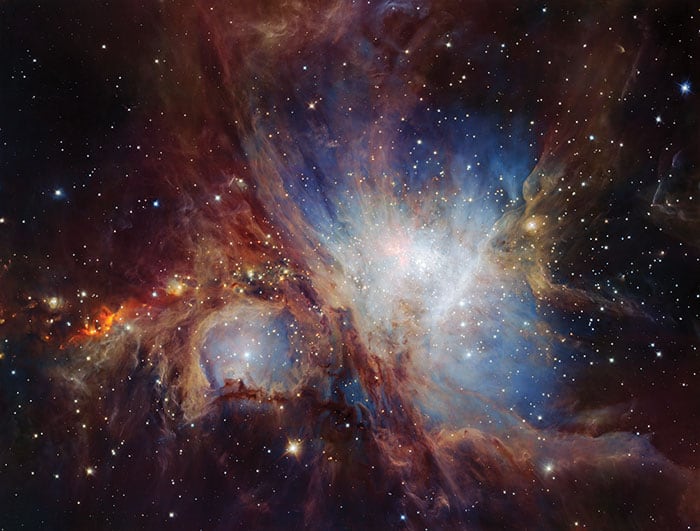
The Orion nebula star-formation region. (Courtesy: ESO/H Drass et al.)
The stars in the Milky Way disc primarily form in small clusters inside larger star-forming regions (such as the Orion nebula) before diffusing away from their origins. During this spatial diffusion, their velocities remained clustered. Hence, if we know their distances and velocities very precisely, we can in effect “turn the clock back” and determine how the diffusion process happened. Many stars in the disc – Gaia will tell us how many – end up being shepherded into “moving groups” of stars that travel together in velocity space and/or coordinate space. Finding and mapping these groups will give us a wealth of information about the large-scale structure and evolution of galactic discs.
Away from the discs, the stars in the Milky Way’s “halo” have (at least) two origins. Some (unknown) fraction formed early on, in situ, in what is now the galaxy. Others formed in small satellite galaxies that were later accreted and dispersed by the galactic tides – a process that continues today. In the outer galaxy, distances are large and timescales are long, so small satellite galaxies are stretched out like a comet tail. Gaia will find these ghostly star streams, and directly recount the assembly history of the outer galaxy.
Perhaps most importantly, the dynamics of these streams is determined by the presence of dark matter – the invisible but gravitationally dominant substance that makes up approximately 27% of the universe’s mass-energy. Gaia’s measurements of stellar kinematics will enable us to determine the 3D distribution of dark matter in our galaxy much more accurately and reliably than is currently known. Such data may even provide clues as to the nature (or natures) of this still-mysterious type of matter.
Exoplanets
Most of the exoplanets that we know about were discovered either photometrically (by measuring the slight dimming that occurs when a planet passes between us and its parent star) or kinematically (by measuring the change in the parent star’s velocity along our line of sight due to the reflex motion induced by the planet). Because Gaia makes highly accurate measurements of stars’ reflex motion in 2D, it is a very sensitive kinematic planet-detector. Simulations show that Gaia can detect planets with a mass equivalent to that of Jupiter (or higher), and there may be as many as 70,000 such planets in orbit around nearby stars. These nearby systems make good targets for detailed follow-up measurements using large ground-based telescopes or special-purpose space observatories.
In addition to its huge numbers, the Gaia exoplanet sample has two other advantages. One is that Gaia’s 2D kinematics measurements give us the information required to calculate an exoplanet’s mass as well as detecting its presence. Even more importantly, since Gaia measures parallaxes for everything nearby, we will know which stars lack massive planets, making it possible to determine how often planetary systems occur around various types of parent star.
Stellar evolution and star clusters
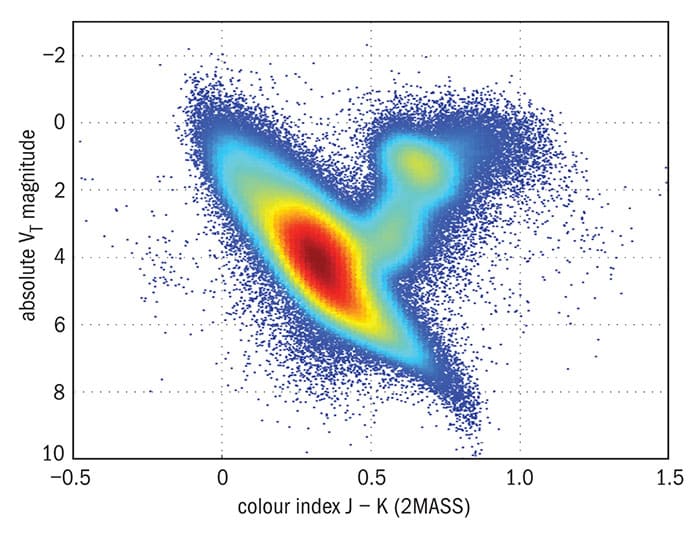
Colour index A Hertzprung-Russell diagram relating the intrinsic luminosity of stars (vertical axis) to their colour (horizontal axis). This data set is part of the Gaia DR1, released publicly on 14 September.
Gaia will provide an unprecedented observational insight into stellar evolution via its measurements of star clusters. These dynamically bound groups of stars have a shared formation history, which gives us a unique opportunity to observe so-called “isochrones” – the tracks that stars with different masses, but similar ages and compositions, trace out on stellar evolution graphs such as the Hertzsprung-Russell diagram (see figure).
Gaia contributes to these data in many ways. One is that accurate proper motion and parallax measurements give us a highly reliable indication of which stars are actually members of the cluster. For clusters relatively close to the Earth, the same data will also show the cluster’s 3D structure, and highlight how the distribution of stars varies within the cluster as a function of stellar mass. Gaia will provide such data for clusters of many different ages, from the young, open clusters in the plane of the Milky Way galaxy to a few old globular clusters nearby.
General relativity
One of the earliest successes for Einstein’s theory of general relativity was its ability to describe the precession of the (elliptical) orbit of Mercury. Another was the theory’s prediction (famously tested by Arthur Eddington and Frank Dyson during the 1919 solar eclipse) that light from distant stars would bend as it passed near the Sun. Gaia will substantially improve and extend the accuracy of these two tests. The most sensitive tests of Mercury’s precession use an object on an elliptical orbit that takes it deep into the Sun’s gravitational well. There are several known asteroids that are ideal for such tests. Gaia will determine the orbits of these asteroids very precisely, making it possible to test certain parameters in the theory to an accuracy of a few tens of parts per million – a significant improvement.
Solar light-bending is a huge effect at Gaia’s levels of precision. The data that Gaia collects will make it possible to test the predictions of general relativity in a more complicated scenario, where light is bent by a secondary mass (Jupiter, in this case) in the presence of a much larger one (the Sun). This test will probe general relativity down to a level that is relevant for distinguishing between different gravity theories. Happily, this Jupiter test is scheduled to take place in 2019 – the centenary of the test that established general relativity and Einstein in popular culture.
Pulsating stars and the distance ladder
The Messier 54 globular cluster, a dense and faint group of stars found in the Saggitarius Dwarf Elliptical Galaxy, one of the Milky Way’s near neighbours. (Courtesy: ESA/Hubble/NASA)
Some stars experience temporary imbalances between convective and radiative energy transport in their outer layers. Such imbalances make the stars pulsate, and this shows up in Gaia’s dataset as periodic changes in a star’s brightness, or “light curves”.
Pulsation is observed for specific groups of stars at different stages of their evolution, and is tightly linked to the stars’ surface temperature, mass and size. Only stars with certain properties will pulsate, and these properties (such as particular features of the light curves and the period of pulsation) are also closely linked to the stars’ intrinsic luminosities. This linkage means that pulsating stars can be used as “standard candles” to calibrate the distance to objects that are too far away for their parallax to be measurable. Three groups of stars make particularly good standard candles: the RR Lyraes, with periods around half a day; Cepheids, with periods of 10–40 days; and Miras, with periods of up to a year.
Gaia is observing thousands of stars in each of these groups. Data from the mission will make it possible to calibrate the relations used to determine extragalactic distances more accurately than ever – so accurately, in fact, that the cosmological distance ladder will no longer be limited by local calibration errors. Instead, the local systematic limit will be set by how well we can calibrate the degree to which light from the Cepheids is being extinguished by cosmic dust located between us and the Cepheid.
Transient events
Gaia is scanning the sky repeatedly, detecting and measuring all sources that are bright enough. However, some sources can suddenly change dramatically in brightness, putting them over the threshold at which they become “visible” to Gaia. These transient and variable sources are the subject of a special data analysis procedure, known as the Gaia photometric science alerts, which is run at the Cambridge Institute of Astronomy DPCI data centre. The Gaia Science Alerts system detects these transients and provides preliminary classifications for what they are – for example supernovae, cataclysmic variable stars, tidal disruption events, gravitational microlenses and so on.
These detections are published so that they can be followed up by ground-based astronomy facilities and, through a dedicated programme, by amateur astronomers and even groups of schoolchildren using a network of remotely controlled robotic telescopes distributed across the globe. A paper based on one such Gaia discovery (authored by a consortium of professional and amateur astronomers) has already been published. It describes a pair of white-dwarf stars whose orbit is aligned such that the stars occult each other in turn, allowing unusually precise study of the physical properties of the system.
An app to follow these events is available at gaia.ac.uk.
Fish scales extracted from food waste have been used to build tiny generators that can convert mechanical energy, such as a touch or sound vibrations, to electrical energy. The work was done by physicists in India, who say that the piezoelectric device could be used to develop environmentally friendly, self-powered electronics with a wide-range of applications.
Piezoelectric materials respond to mechanical stress by separating positive and negative electrical charge, and therefore can be used to convert the mechanical energy of vibrations into electrical energy. Piezoelectric generators that harvest energy from vibrations in the living environment would allow the development of fully independent, battery-free devices. These could be particularly useful for medical devices, such as pacemakers and insulin pumps, and targeted drug-delivery systems that consume little power, but need it continuously.
But, to realize the full potential of such devices, researchers need to develop new environmentally friendly piezoelectric materials. Dipankar Mandal, a physicist at Jadavpur University in Koltata, India, says this is “simply because most of the traditional piezoelectric materials contain toxic elements, such as lead and bismuth”. As well as being useful for biomedical applications, Mandal adds that non-toxic and environmentally friendly piezoelectric materials would also reduce electronic waste and society’s dependence on traditional energy sources, like batteries, which often contain toxic elements.
Tipping the scales
Fish is a popular food in India and one possible source of non-toxic piezoelectric materials in that country is the large quantity of fish scales that are disposed of as waste. The scales are composed of collagen nano-fibrils, which are known to have piezoelectric properties, and this inspired Mandal and colleague Sujoy Ghosh to see if they could use waste scales to produce a cost-effective, piezoelectric nano-generator.
Collagen consists of three polypeptide chains that twist together to form a triple-helical structure. Hydrogen bonds between the polypeptide chains all orientate in the same direction and act as molecular dipoles, resulting in spontaneous electrical polarization and piezoelectric properties.
Within fish scales, collagen nano-fibrils self-assemble and align. “We wanted to explore what happens to the piezoelectric yield when a bunch of collagen nanofibrils are hierarchically well aligned and self-assembled in the fish scales,” Mandal explains. To build their piezoelectric device, the researchers washed and then treated fish scales – collected from a local fish market – with an acidic demineralizing solution to make them transparent and flexible. They then attached gold electrodes to these flexible, transparent scales and laminated them with a polypropylene film to create a robust “bio-piezoelectric nano-generator”.
Tests showed that the device had an intrinsic piezoelectric response of around 5 pC/N. And it was able to harvest energy from various ambient motions, including body movements, machine and sound vibrations, and wind flow.
Green power source
When subjected to a repeated compressive stress of 0.17 MPa the nano-generator produced an output of 4 V with a current of 1.5 μA – or 6 μW of power. The researchers also linked four of the devices together and were able to produce a voltage of 14 V. By gently slapping this device with their hands, they were able to switch on more than 50 LEDs. According to the researchers, this demonstrates that it is “a sustainable green power source”.
Mandal told physicsworld.com: “The piezoelectric output is really promising, particularly if we look at the instantaneous piezoelectric energy-conversion efficiency and similar-sized available biocompatible piezoelectric materials.” He adds that the research could have enormous potential for “tiny electronic gadgets, health-care monitoring, self-powered implantable bio-medical devices, targeted drug delivery, national security and defence applications”.
The researchers now plan to scale up the nano-generator and “test it in different bio-medical and self-powered devices”.
A novel imaging technique that can capture a single atomic ion and its motion with unprecedented nanoscale sensitivity has been unveiled by researchers at the Joint Quantum Institute in the US. This adaptive-optics method uses a combination of high-performance lenses and computer processing to get rid of aberrations and distortions that lead to image inaccuracies. The team says that its imaging system was able to detect ion movements on the scale of a few nanometres and could be used to measure quantum superpositions of two different motional states of a single ion. It may also have applications in other fields that include point-like sources, such as biology and astronomy. The work is published in Nature Photonics.
Coherently coupling spins to a nitrogen vacancy
Researchers have coherently coupled three spins to a nitrogen vacancy and the system could have applications in building quantum sensors and simulations. Normally, physicists try to avoid coupling diamond nitrogen vacancies (NVs) to nearby electron spins because this causes decoherence and makes the NVs unsuitable for storing quantum information. But now, Helena Knowles, Dhiren Kara, and Mete Atatüre of the University of Cambridge have stored and read out quantum information using an NV that is coherently coupled to three nearby spins. Possible applications of the system include measuring extremely small magnetic fields in living organisms and building quantum simulators on a chip. The work is described in Physical Review Letters.
Large Hadron Collider hits luminosity target
Last week, the Large Hadron Collider at the CERN particle-physics lab in Geneva hit a new milestone as the integrated luminosity delivered to its ATLAS and CMS detectors reached 25 fb–1 – the lab’s target for the whole of 2016. LHC researchers have been hard at work all year round to develop new ways to boost the device’s performance and thanks to the improvements, the LHC was routinely operated with peak luminosities 10%–15% above the design value of 1034 cm–2 s–1 in July and August. This success was achieved despite an unexpected animal incident involving a small beech martin in May and a control fault in the cryogenics plant in August that meant that the ATLAS experiment had to ramp down its magnets, requiring five days to get back to normal conditions. The accelerator team is now preparing for the “season finale”, where forward proton–proton physics and proton–lead physics will replace the familiar proton–proton physics.
Burning bright: the OMEGA laser’s 20 cm disc amplifiers at the University of Rochester’s Laboratory for Laser Energetics. (Photo by Adam Fenster/University of Rochester)
OMEGA laser sets new fusion-yield record
Scientists working on the OMEGA laser at the University of Rochester have created the conditions capable of producing a fusion yield that’s five times higher than the current record – as long as their results can be scaled up to work at the National Ignition Facility (NIF) at the Lawrence Livermore National Laboratory in California. The OMEGA laser was used to fire 60 laser beams directly at a millimetre-sized fuel pellet. Their results show that if their “direct-drive” method of fusion can be replicated at NIF – which instead uses “indirect-drive”, where the light from 192 laser beams is first converted into X-rays before hitting the fuel capsule – then it would be possible to produce more than 100 kJ of fusion energy, bringing the facility nearer to its “ignition” target.
UK “supercouncil” will boost research and industry collaboration, says science minister
Plans to merge Innovate UK with the UK’s research councils (RCUK) to create a “supercouncil” of UK research and innovation will allow the UK to “exploit the knowledge and expertise we have for the benefit of the whole country”, according to a letter written by science minister Jo Johnson and presented to the House of Lords Science and Technology Committee. According to Johnson, such a merger will remove the barriers between research and businesses. Johnson’s letter was in response to one of his peers on the committee, who had earlier expressed “serious concerns” about the merger plans, which are a part of the higher-education and research bill that is currently passing through the Commons.
You can find all our daily Flash Physics posts in the website’s news section, as well as on Twitter and Facebook using #FlashPhysics. Tune in to physicsworld.com later today to read today’s extensive news story on creating a piezoelectric generator from fish scales.
The dark ages of the universe were nearing their end 700 million years after the Big Bang, which is 150 million years later than previous measurements indicated. That is the conclusion according to astronomers who have analysed data from the European Space Agency’s Planck spacecraft. The research provides important information about when the first stars and galaxies formed in the early universe.
The first billion years of cosmic history are shrouded in mystery. This shroud began to lift when ultraviolet light from the first stars and galaxies ionized the fog of neutral hydrogen gas that filled the universe. This time period is known as the epoch of reionization and was more or less complete about 12.9 billion years ago, or about 900 million years after the Big Bang. However, exactly when reionization began has long been a source of debate amongst astronomers.
Polarizing effect
The answer lies in how photons in the cosmic microwave background (CMB) radiation are scattered by the electrons liberated from ionized hydrogen atoms. Electrons scatter the photons in preferential directions, causing the CMB to become polarized. Finding out when this polarization took place provides the answer to when the first stars and galaxies began ionizing the hydrogen in the universe.
“The polarization of the CMB is the best way to constrain reionization almost independently of other cosmological parameters,” explains Jean-Loup Puget of the Institut d’Astrophysique Spatiale in France, who is lead scientist of the High Frequency Instrument (HFI) on board Planck.
With that in mind, a team led by Matthieu Tristram of the Laboratoire de I’Accélérateur Linéaire, also in France, used the HFI to measure the point at which the reionization was half complete. To do this they used polarization data to determine the “Thomson optical depth”, which is a measure of how much scattering occurred at a given redshift (age of the universe). They found that the greatest amount of electron scatterings occurred about 700 million years after the Big Bang (13.1 billion years ago), which suggests that this was the time when reionization began in earnest.
Painstaking analysis
The data from HFI took several years because of the delicate nature of the instrument. HFI’s 52 bolometers measure infrared and millimetre-wave radiation by capturing heat and must be cooled to just 0.1 K to detect the faint CMB. “The result came after several years of painstaking data analysis, since it is very difficult to control spurious instrumental effects at such low brightness,” says Puget.
Earlier attempts to measure the epoch of reionization had given different results. NASA’s Wilkinson Microwave Anisotropy Probe (WMAP) had previously indicated that the reionization process was active just 450 million years after the Big Bang. Last year, Planck’s Low Frequency Instrument, operating at longer wavelengths than HFI, concluded that the reionization process began 550 million years after the Big Bang. Now, HFI has pushed the date even further forward.
The recent findings suggest that the first stars and galaxies received no help in their reionization efforts from quasars, which are active supermassive black holes. Surveys indicate that quasars were relatively few in number 700 million years after the Big Bang, whereas stars and galaxies were more plentiful.
The most distant galaxy ever seen is called GN-z11 and was identified by Hubble earlier this year. It existed 13.4 billion years ago, when the universe was just 400 million years old. Planck’s observations show that the universe was less than 10% ionized at this time, meaning that although stars and galaxies were forming it would take another 300 million years for them to be plentiful enough for reionization to be well underway. NASA’s upcoming James Webb Space Telescope, set to launch in 2018, will be capable of observing this time period as well as going even further back in time to chart the epoch of reionization in full.
Previously housed in a small, cramped building (albeit with a swimming pool), the IIP moved into a shiny, new three-storey building in March this year. One striking architectural feature is the institute’s central atrium, which is fully open to the outside world. Natal has such a great climate – it’s 25–30 °C all year round and almost always sunny – that there’s no need for stuffy walls and doors. The design also lets the regular, strong breezes that blow into Natal from the Atlantic to add a delightful, cooling touch.