The International System of Units: constantly evolving, but forever quirky

Even though it is the bedrock of modern measurements, the International System of Units (SI) is not set in stone. As science advances, the SI’s stewards are committed to changing the system for the better, replacing definitions based on objects to ones reliant on unchanging universal constants of nature.

The most famous recent example came in 2019, when the kilogram was redefined in terms of the Planck constant, replacing the standard platinum-iridium mass stored for more than 100 years at the Bureau International des Poids et Mesures (BIPM) in France. The next base unit of measurement likely to be redefined is the second, with modern atomic (and potentially nuclear) clocks offering more precision than those based on the stalwart caesium atom, which has defined the unit of time since 1967.

But as the SI continues to evolve, it has also retained its share of quirks, some that arose from the practical limitations of technology and others due to our human biology.

Not just a gram

Today’s SI has seven fundamental base units of measurement (see box below), including metres for length, amperes for electric current and kelvins for thermodynamic temperature. So why is the base unit of mass not one gram (g) but a thousand grams (kg)?

The reason is quite simple: it was once hard to make objects that are exactly one gram. Kilograms – which are roughly two bags of flour – were much easier to make accurately and more useful in day-to-day trade.
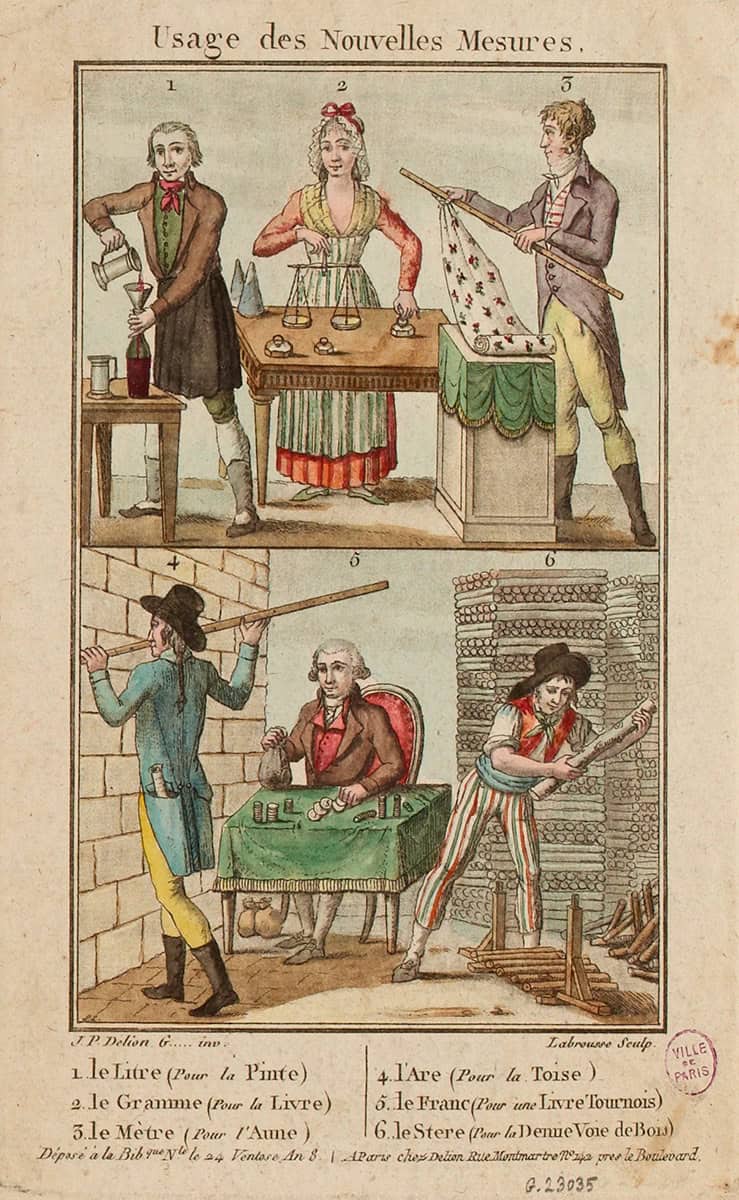
Old poster of French market traders with information about the new decimal measures introduced in France in 1795

In 1795 the French revolutionary government, working off the country’s Commission on Weights and Measures, formally defined the gram as the mass of a one centimetre cube of water at 4 °C. But that’s about the size of five green peas and the weight of five raisins – it doesn’t make for a very practical definition for commerce.

So they simultaneously commissioned the making of a standard that was 1000 times heavier. Following years of careful calculations by a scientific committee, a metallurgist named Étienne Lenoir crafted a solid platinum cylinder in 1799 that represented the original prototype kilogram. By 1875 the kilogram took hold internationally when 17 countries signed the Metre Convention – an international treaty establishing agreed-upon references for length and mass. The UK signed on in 1884, and nowadays there are 65 member states and 35 associate states and economies.

In 1889 “Le Grand K” – a new platinum and iridium prototype for the kilogram – was declared the official definition of the unit. Stored in an underground vault at BIPM, it served as the international standard of mass until as recently as 2019.

The new definition for the kilogram relies on a fixed Planck constant h. To measure this value as precisely as possible, metrologists used two techniques: X-ray crystal density (XRCD, also known as the Avogadro experiment), and the Kibble balance. The latter uses electromagnetic forces provided by a coil of wire immersed in a magnetic field to balance a mass. The equipment let metrologists obtain accurate values of current and voltage, from which the Planck constant could be derived. But as of 20 May 2019, when the constant was set in stone and the kilogram was redefined, the Kibble balance could be used to measure mass with high precision instead.
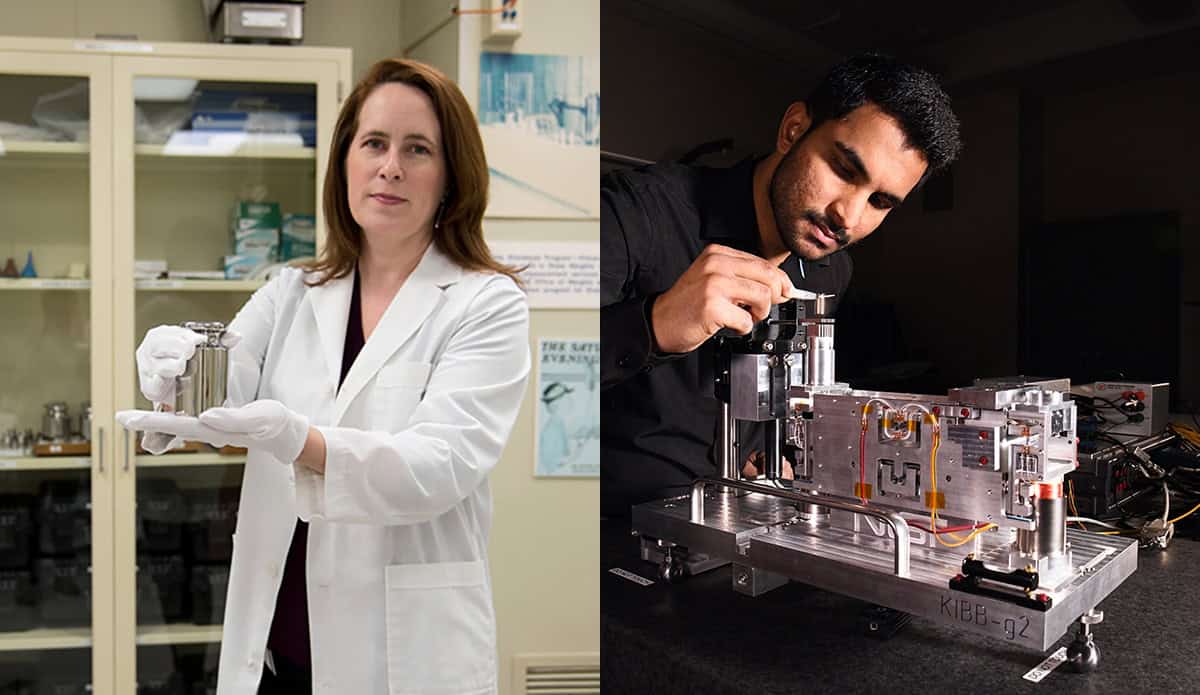
Two photos: a scientist in lab coat and white gloves holds a shiny metal cylinder on the palm of one hand; an engineer peers closely at a shiny metal instrument on a lab bench

While the kilogram is still the official international unit of mass, researchers are using tabletop Kibble balances and other instruments to directly measure the gram in terms of the Planck constant. Improving our ability to measure the gram is useful for pharmaceutical manufacturers, who want to dispense drug doses accurately, and for the military and companies that need to make precision parts for electronics, aerospace and other critical applications.

But there is one place where the gram has long been a shining star: the classroom. As my NIST colleague Elizabeth Benham points out, educational companies make one-gram cubes that are one centimetre on each side, and one millilitre in volume. These “centimetre cubes” excel at showing the relationships between mass, length and volume. Students can build 10 by 10 layers (1000 cubes) to create a “supercube” that is a kilogram in mass and a litre in volume. So if you’re sad about the gram not being a base unit, you can take solace in the fact that for school students, it is the mass measurement unit of choice.

The base seven: how we measure our world
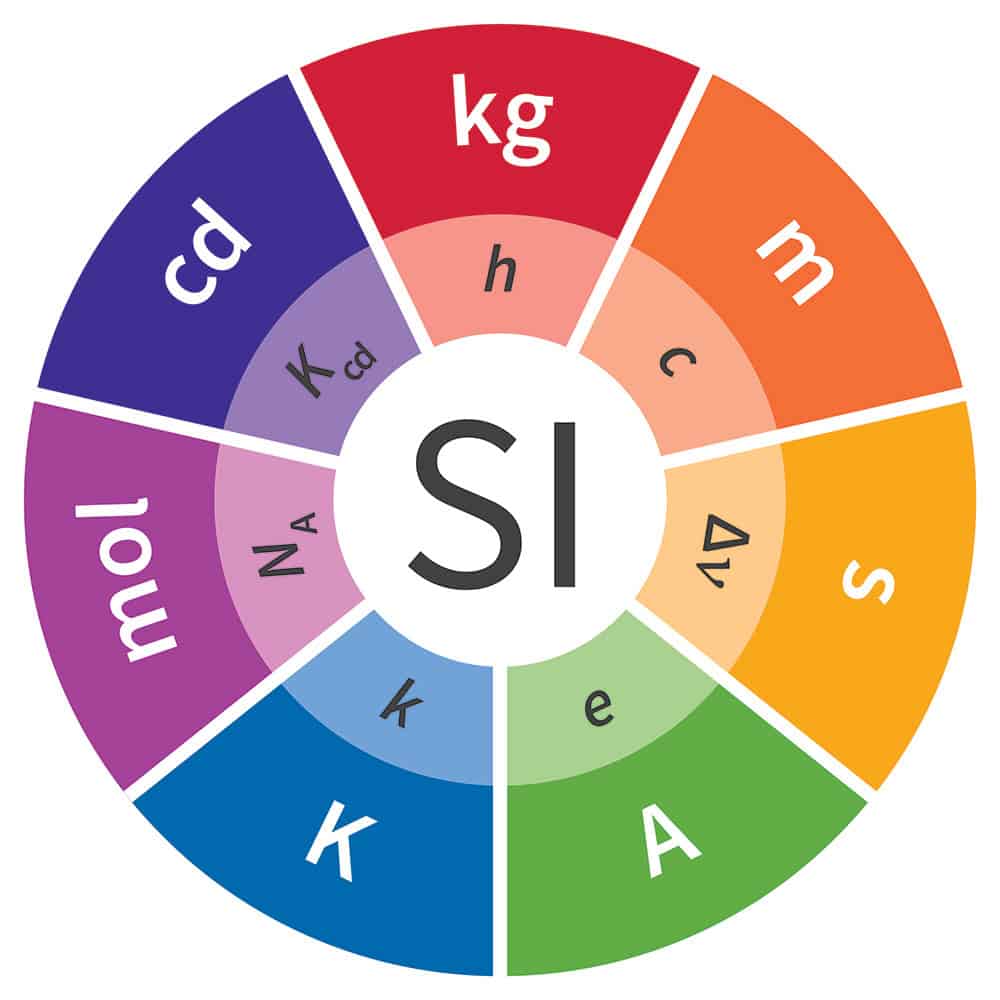
The official wheel of SI units

There are seven base units in the International System of Units (SI). Over the centuries since they were adopted globally, each has evolved from their original definition so they can be applied and measured more consistently and accurately. In 2019 the latest definitions of these units took effect. Not only are all seven base units defined by fundamental constants like the Planck constant, but the values of these constants are locked as exact numbers based on the best scientific measurements available at the time.

Unit for time: second

The second (s) was once simply reliant on the length of a day, but is currently defined by the unperturbed ground-state hyperfine transition frequency of the caesium-133 atom, ΔνCs. In 2019 the frequency was fixed as an exact unchanging value. It is likely that the definition will be refined further using atomic or nuclear clocks.

Unit for length: metre

Historically, the metre (m) was 1/10,000,000 of the distance from Earth’s equator to the North Pole. Today, it is the distance that light travels through a vacuum in 1/299,792,458 seconds, where the denominator is the exact value of the speed of light in vacuum, c.

Unit for mass: kilogram

The kilogram (kg) used to be defined by the mass of a platinum-iridium cylinder called the International Prototype Kilogram, or Le Grand K. It is now defined in terms of the Planck constant, h.

Unit for electric current: ampere

The ampere (A) was once defined by an imaginary and impossible experiment involving the force between two infinite parallel, current-carrying wires. It is now defined in terms of the elementary charge, e.

Unit for amount of substance: mole

The mole (mol) used to be defined by the number of atoms in 0.012 kg of carbon-12. To avoid it depending on the mass of a sample, it is now defined in terms of a specific number of atoms or molecules, the Avogadro constant, NA.

Unit for thermodynamic temperature: kelvin

Previously, the kelvin (K) was defined by the thermodynamic triple point of water, but it is now tied to an exact value of the Boltzmann constant, k, which relates thermodynamic temperature to energy.

Unit for luminous intensity: candela

The candela (cd) was simply based on the light emitted by a burning candle. The current definition is reliant on a fixed numerical value for the luminous efficacy of monochromatic radiation of frequency 540 × 1012 Hz, Kcd.

The most human unit

In today’s SI, the base units are defined by fundamental constants of nature, such as the Planck constant and the charge of the electron. As best as we can tell, these constants appear to be the same everywhere in the universe, so extraterrestrials would measure the same values for these constants as we do.

But there is one base unit that is very specific to humans: the candela, which means “candle” in Latin, Spanish and Italian. It stems from the UK parliament introducing a unit known as “candlepower” in 1860 so the country could achieve uniform street lighting. Initially, scientists defined the unit in terms of a single candle made from whale fat, with a bit of beeswax to improve the burn. Inevitably, this standard was abandoned because no two objects are exactly alike: one candle shines light at a slightly different rate than another.

By the middle of the 20th century, scientists tried to define the unit in terms of a more universal property – namely, blackbody radiation, the electromagnetic energy from an object that is a perfect absorber and emitter. In 1946 the International Committee for Weights and Measures in France proposed a “new candle” based on the intensity of radiation from platinum at its freezing point (2041.4 K). In 1948 the General Conference on Weights and Measures (CGPM) ratified this standard and named it the “candela”. The new definition also specified that the candela was a measure of intensity as perceived by the human visual system.

This is a very practical addition because researchers can actually quantify human visual perception. In the early 20th century, scientists carefully measured how sensitive the eye is to visible light and established a “photopic curve” – average levels of human sensitivity to different colours. To cite a contemporary example, green laser pointers appear brighter to us than red laser pointers with the same power as a result of our human biology.
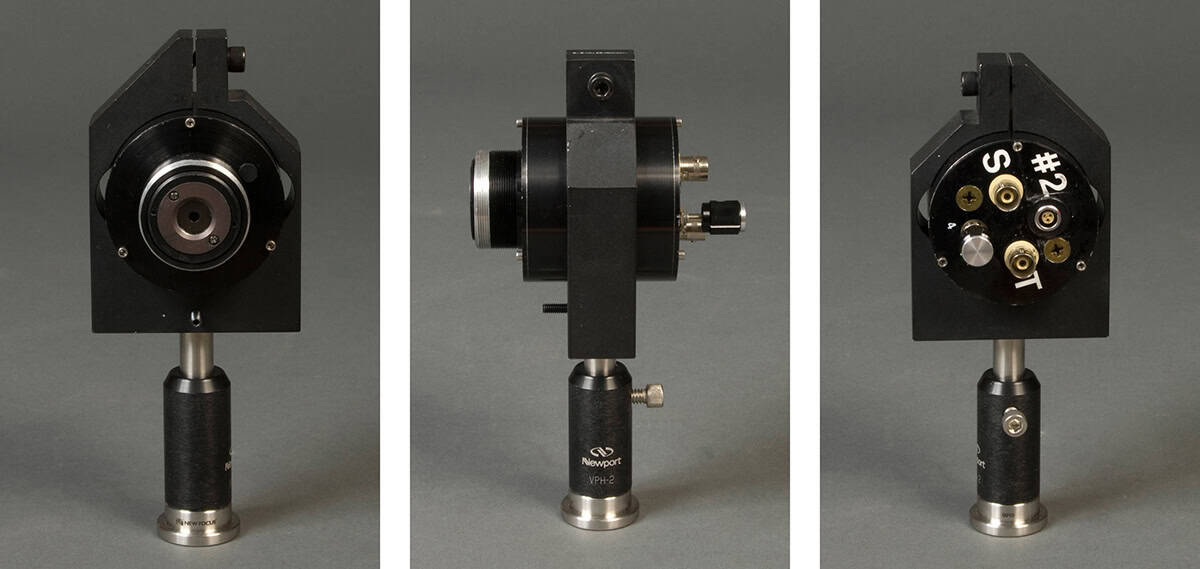
Three views of a silicon diode photodetector

In 1979 the CGPM eliminated blackbodies from the definition. Even this fundamental concept was problematic, since no object can be a perfect blackbody. Instead, the group defined the candela directly in terms of a single colour of visible light, with a frequency of 540 × 1012 Hz.

This reference colour is a shade of yellow-green to which the human eye is most sensitive in a well-lit room, and from it, scientists use the photopic curve to determine the luminous intensity of other colours. Scientists think our eyes adapted to this chartreuse hue because it lines up with the peak spectral irradiance of sunlight that strikes the Earth’s surface. Early humans’ sensitivity to this colour could have helped them spot different types of vegetation when foraging, with yellow-green leaves indicating younger, more calorie-dense food, while greener leaves signify that a plant’s nutrients have moved to other places such as the roots and stems.

In 2019 the candela was officially redefined yet again. It is now expressed by fixing the luminous efficacy of 540 × 1012 Hz light as a constant of 683 lumens per watt – a sort of conversion factor between the physical intensity of visible light and human perception of its intensity.

If extraterrestrials have plant-like food, they might be more sensitive to another colour in the spectrum based on the star (or stars) that shines over their home planets. For example, at least one scientist has speculated that plants in a red-dwarf star system might look black to us because they might need to absorb as much light as possible from this cooler star. But a native creature may have evolved to see lower-frequency light, which would make the plant appear intensely infrared to them. If we ever make contact, measurement scientists from our planet will likely be very interested in knowing how aliens might define their own candela.

Time’s unusual unit

As all physicists know, the SI centres on the number 10, whether measuring molecules at nanometre (nm or 10–9m) scales or a nuclear power plant with a gigawatt (GW or 1012 W) of power.

Whereas older measurement systems often had complicated conversions involving different units – such as 16 ounces in a pound and 14 pounds in a stone – the metric system sticks with the same unit and helpfully adds prefixes to indicate quantities on the mindbogglingly wide scale of 10–30 to 1030. In fact, the expansion of the prefixes from 48 to 60 orders of magnitude is another recent SI improvement (made in 2022) to accommodate the latest needs in computing and other scientific fields. We now have ronna (R) for 1027, quetta (Q) for 1030, ronto (r) for 10–27 and quecto (q) for 10–30.
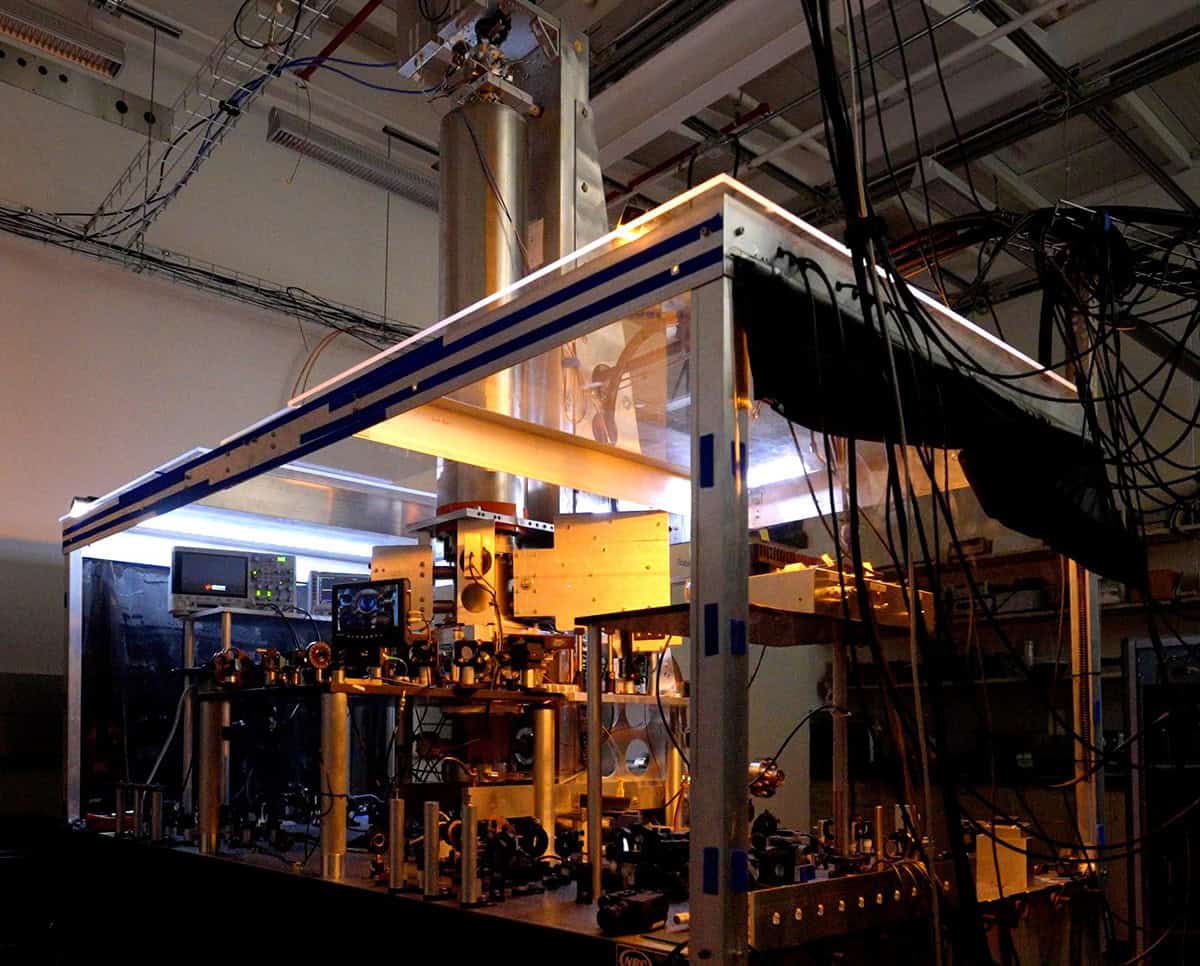
NIST caesium fountain clock

Despite all this, we count time a bit differently. We still express decimal fractions of a second the metric way – we call a thousandth of a second a millisecond, and a billionth of a second is a nanosecond – but on the scale of seconds and minutes, timekeeping becomes a base-60 system. When we reach 60 seconds, it becomes one minute, and then 60 minutes equal one hour, and we call 24 hours a day. Minutes, hours and days are not official SI units, but they are accepted for use within the metric system.

Humans have good reasons to use base-10 system – scientists believe that our affinity for base-10 has to do with the number of fingers we have for counting. However, the origin of our base-60 system is more complicated.

People living in one of the earliest civilizations, the Sumerians, first developed base-60 around 3000 BCE. While the reasons they chose 60 are unknown, scientists speculate that 60 is a convenient number for arithmetic – it is evenly divisible by many numbers, including 1 through 6, 10, 12, 15, 20 and 30. And going back to human fingers, we can count to 60 pretty easily by using our knuckles. Knuckles split each finger (excluding the thumb) into three parts, so four fingers add up to 12 parts. If you use the thumb and fingers of your other hand to count by 12s, the total is 60.

Starting around 2000 BCE, the Babylonians used base-60 for astronomical observations, splitting the sky into that many sectors. In medieval times, the Persian scholar Al-Bīrūnī used this system in his writings to split the hour into 60 minutes, and the minute into 60 seconds. By the time of the Renaissance, clocks and watches began to display this base-60 logic. To this day, even our smart watches continue to use the ancient Babylonian system.

But why didn’t minutes and hours get updated into a base-10 system like the other scales? It wasn’t for lack of trying. In 1793 the revolutionary French government passed a decimal time system. It split the day into 10 decimal hours, an hour into 100 decimal minutes, and a minute into 100 decimal seconds. The French public swiftly rejected this new system, so the idea was suspended just 17 months later. It was a hassle to use new decimal clocks, let alone try to sync their timekeeping devices to the rest of Europe.

No unit of rotation

The SI is very straight-edged, with the metre as our base unit for length. However, there is no base unit for geometrical angles. In our round world and curved universe, why isn’t there a base unit devoted to rotation?

It’s more than a philosophical question. An SI without a base unit for angles creates real-world issues. For example, measurements of an object’s torque (such as when you twist a screwdriver) have the same units as work (like when lifting a weight straight up from the ground). The units for both are “Newton metres”. So if you see a measurement in Newton metres, you may not know if it’s a measure of torque or work.

Go back to the French revolution and it turns out we were en route to a very metric definition of angle. The grade, later known as the gradian, was proposed as the angular unit of measurement. A circle would be divided into 400 grads, with 100 grads representing a right angle. On the Earth’s surface (very slightly curved from our ant-like vantage point) a hundredth of a grad would represent 1 km of arc length along the Earth’s surface.

But the grade eventually became overshadowed by the radian, a concept that was introduced by British mathematician Roger Cotes, a colleague of Isaac Newton. (A similar unit was proposed in the 1400s by Persian mathematician Al-Kashi.) Because its angular measurements were expressed in terms of π, proportional to the actual circumference of a circle, the radian was considered a more mathematically useful unit. Look no further than calculus: with sine and cosine as a function of x in radians (instead of degrees) it’s a piece of cake (or pie?) to take derivatives and integrals, without having to worry about ugly conversion factors such as π/180  when working with degrees. Similarly, approximating trigonometric functions by expanding them into Taylor series is easy when you work in radians.

While mathematically convenient, the radian can also be metrologically terrifying. The radian, as defined, is a dimensionless unit: the arc length (in metres) divided by the length of the radius (also in metres), cancels out the metres. So it’s “just a number” as some might say.

To remedy this, the National Institute of Standards and Technology (NIST)’s Peter Mohr and Bill Phillips (building upon suggestions from others) proposed in 2015 that the radian become a base unit of measurement.
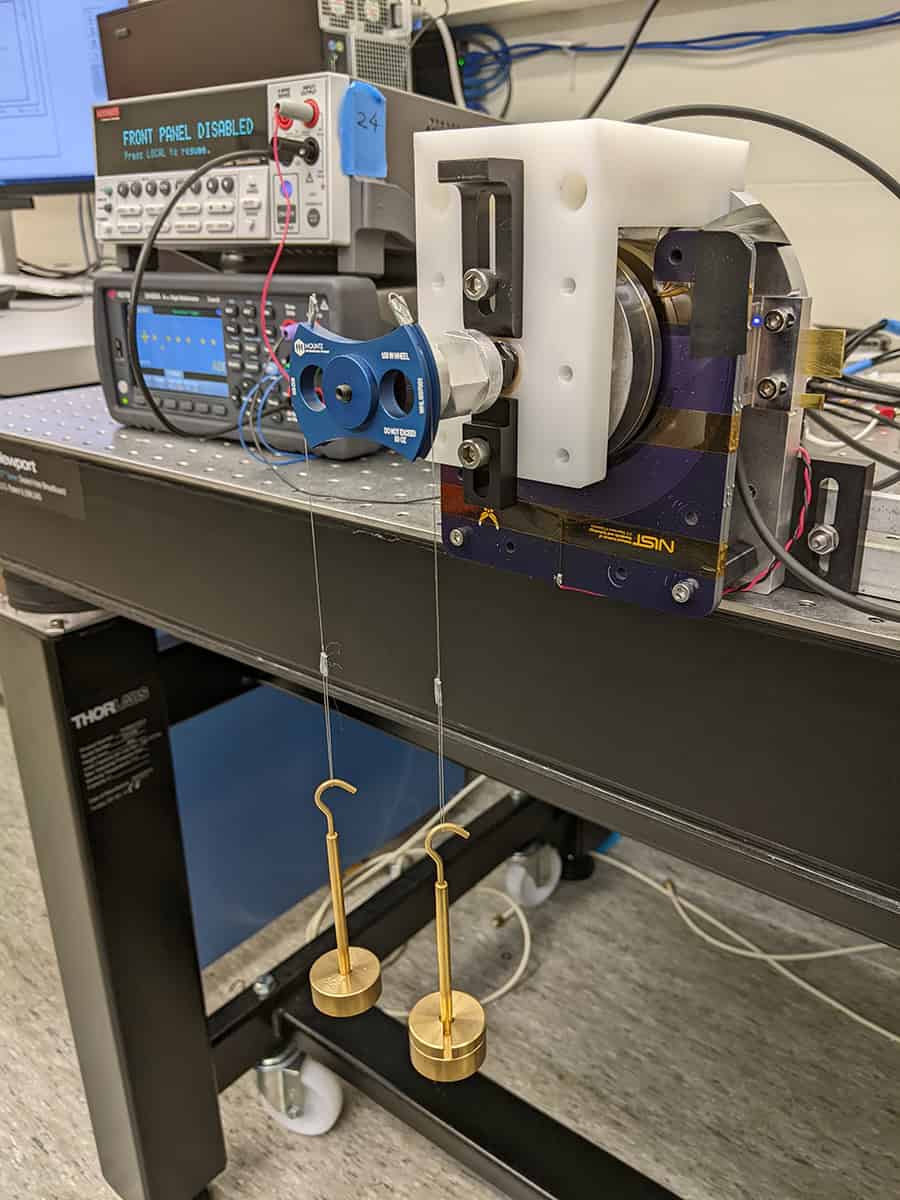
Lab bench with analogue and electronic devices for measuring torque

Elevating the radian to a base unit would bake in the idea of a dimension along the arc of a circle. By expressing an angle in terms of radians as a base unit, you’d be specifying not only the amount of the angle but also that the dimension is circular.

This would solve the real-world problem that we mentioned earlier. Torque could now be defined in terms of Newton metres per radian. With this new definition, you’d be able to show torque as the amount of energy per rotation of an object, perhaps a more physically accurate concept than what we had before. And more generally, making the radian a unit would allow the SI to more fundamentally communicate concepts such as rotation and the angle at which an object is oriented.

But a radian base unit also has major problems, creating dimensional headaches of its own. If you were measuring the power of a rotating system, you would need a new dimensional constant (1/radians) to convert “rotational power” into linear power. Another complication is that the widely used “h-bar” in quantum mechanics, h/2π, would become expressed in units of J·s/radians, which would require changes in quantum mechanics textbooks and software that performs quantum mechanics calculations.

For these and other reasons, an international metrology group exploring this issue decided in 2024 to keep the radian a dimensionless “quantity with the unit one” but also added special notes for the latest version of the official SI brochure. It now says that radians should be “written explicitly where appropriate” to clarify a measurement, an improvement that would finally help to distinguish torque from linear work.

The SI’s more “quirky” features remind us that it is not a perfectly logical or consistent system. If we someday communicate with intelligent extraterrestrials, and learn about their measurement systems, will their otherworldly metrology contain as many oddities? While this is an answer we are not likely to learn during our lifetimes, one thing is for sure: the SI reflects our history and identity as humans, down to our chartreuse-sensitive eyes and our base-60 hands.

Water use in green hydrogen production

Proton Exchange Membrane Water Electrolysis is a method to split water into its components, hydrogen (H₂) and oxygen (O₂), using electricity typically sourced from renewables. It is one method for producing so-called green hydrogen. Key benefits are that it can easily start and stop, fitting well with fluctuating renewable energy sources; it produces high purity hydrogen suitable for fuel cells and industrial use; and it has a smaller carbon footprint than some alternatives.

This work explores how much water is used in Proton Exchange Membrane Water Electrolysis, which is significant in regions with low water availability, where hydrogen plants could stress supplies. The researchers looked at all lifecycle stages: manufacturing (building the electrolyser and producing materials), operation (water splitting, cooling, and purification), and end-of-life (disposal or recycling).

Electric Hydrogen’s 100MW PEM electrolyser plant utilizing dry cooling at Infinium’s Project Roadrunner e-SAF facility in Pecos, Texas (USA).

Their main conclusion was that most water use occurs during the operational phase, where the greatest opportunity to save water lies. Dry cooling uses much less water than wet cooling, reducing consumption by about a factor of three. In a best-case scenario with dry cooling, about 13 litres of water per kg H₂ is used, of which around 3.5 litres is lost in water treatment. This loss can be reduced by about 50% using a brine recovery system, depending on location and infrastructure.

Proton Exchange Membrane Water Electrolysis has a similar lifecycle water use to fossil hydrogen production, therefore switching to green hydrogen does not significantly increase water demand. Although hydrogen plants use comparable water to agriculture (e.g. corn farming), they generate much higher economic value per unit of water (~700×), making them an efficient use of water.

This research is significant because it shows that while green hydrogen can reduce carbon emissions, its water use must be carefully managed to ensure it is sustainable at scale.

Read the full article

Addressing water usage challenges for electrolyzer operations in arid areas

Parikhit Sinha et al 2026 Prog. Energy 8 025005

Do you want to learn more about this topic?

Research and development of hydrogen carrier based solutions for hydrogen compression and storage Martin Dornheim et al. (2022)

Strain relaxation in van der Waals heterostructures

In 2‑dimensional physics, atomically thin materials (e.g. MoS₂, WS₂, WSe₂) are useful for next‑generation electronics such as flexible devices. Using these materials, scientists can create van der Waals heterostructures, where different 2D materials are stacked in layers and held together by weak intermolecular forces called van der Waals forces. Heterostructures combine different materials to optimise their properties. Unlike single crystals, van der Waals heterostructures are more flexible and less prone to defects. They can also tolerate lattice mismatch, where atoms between layers do not perfectly line up, although this must be controlled to avoid building up strain.

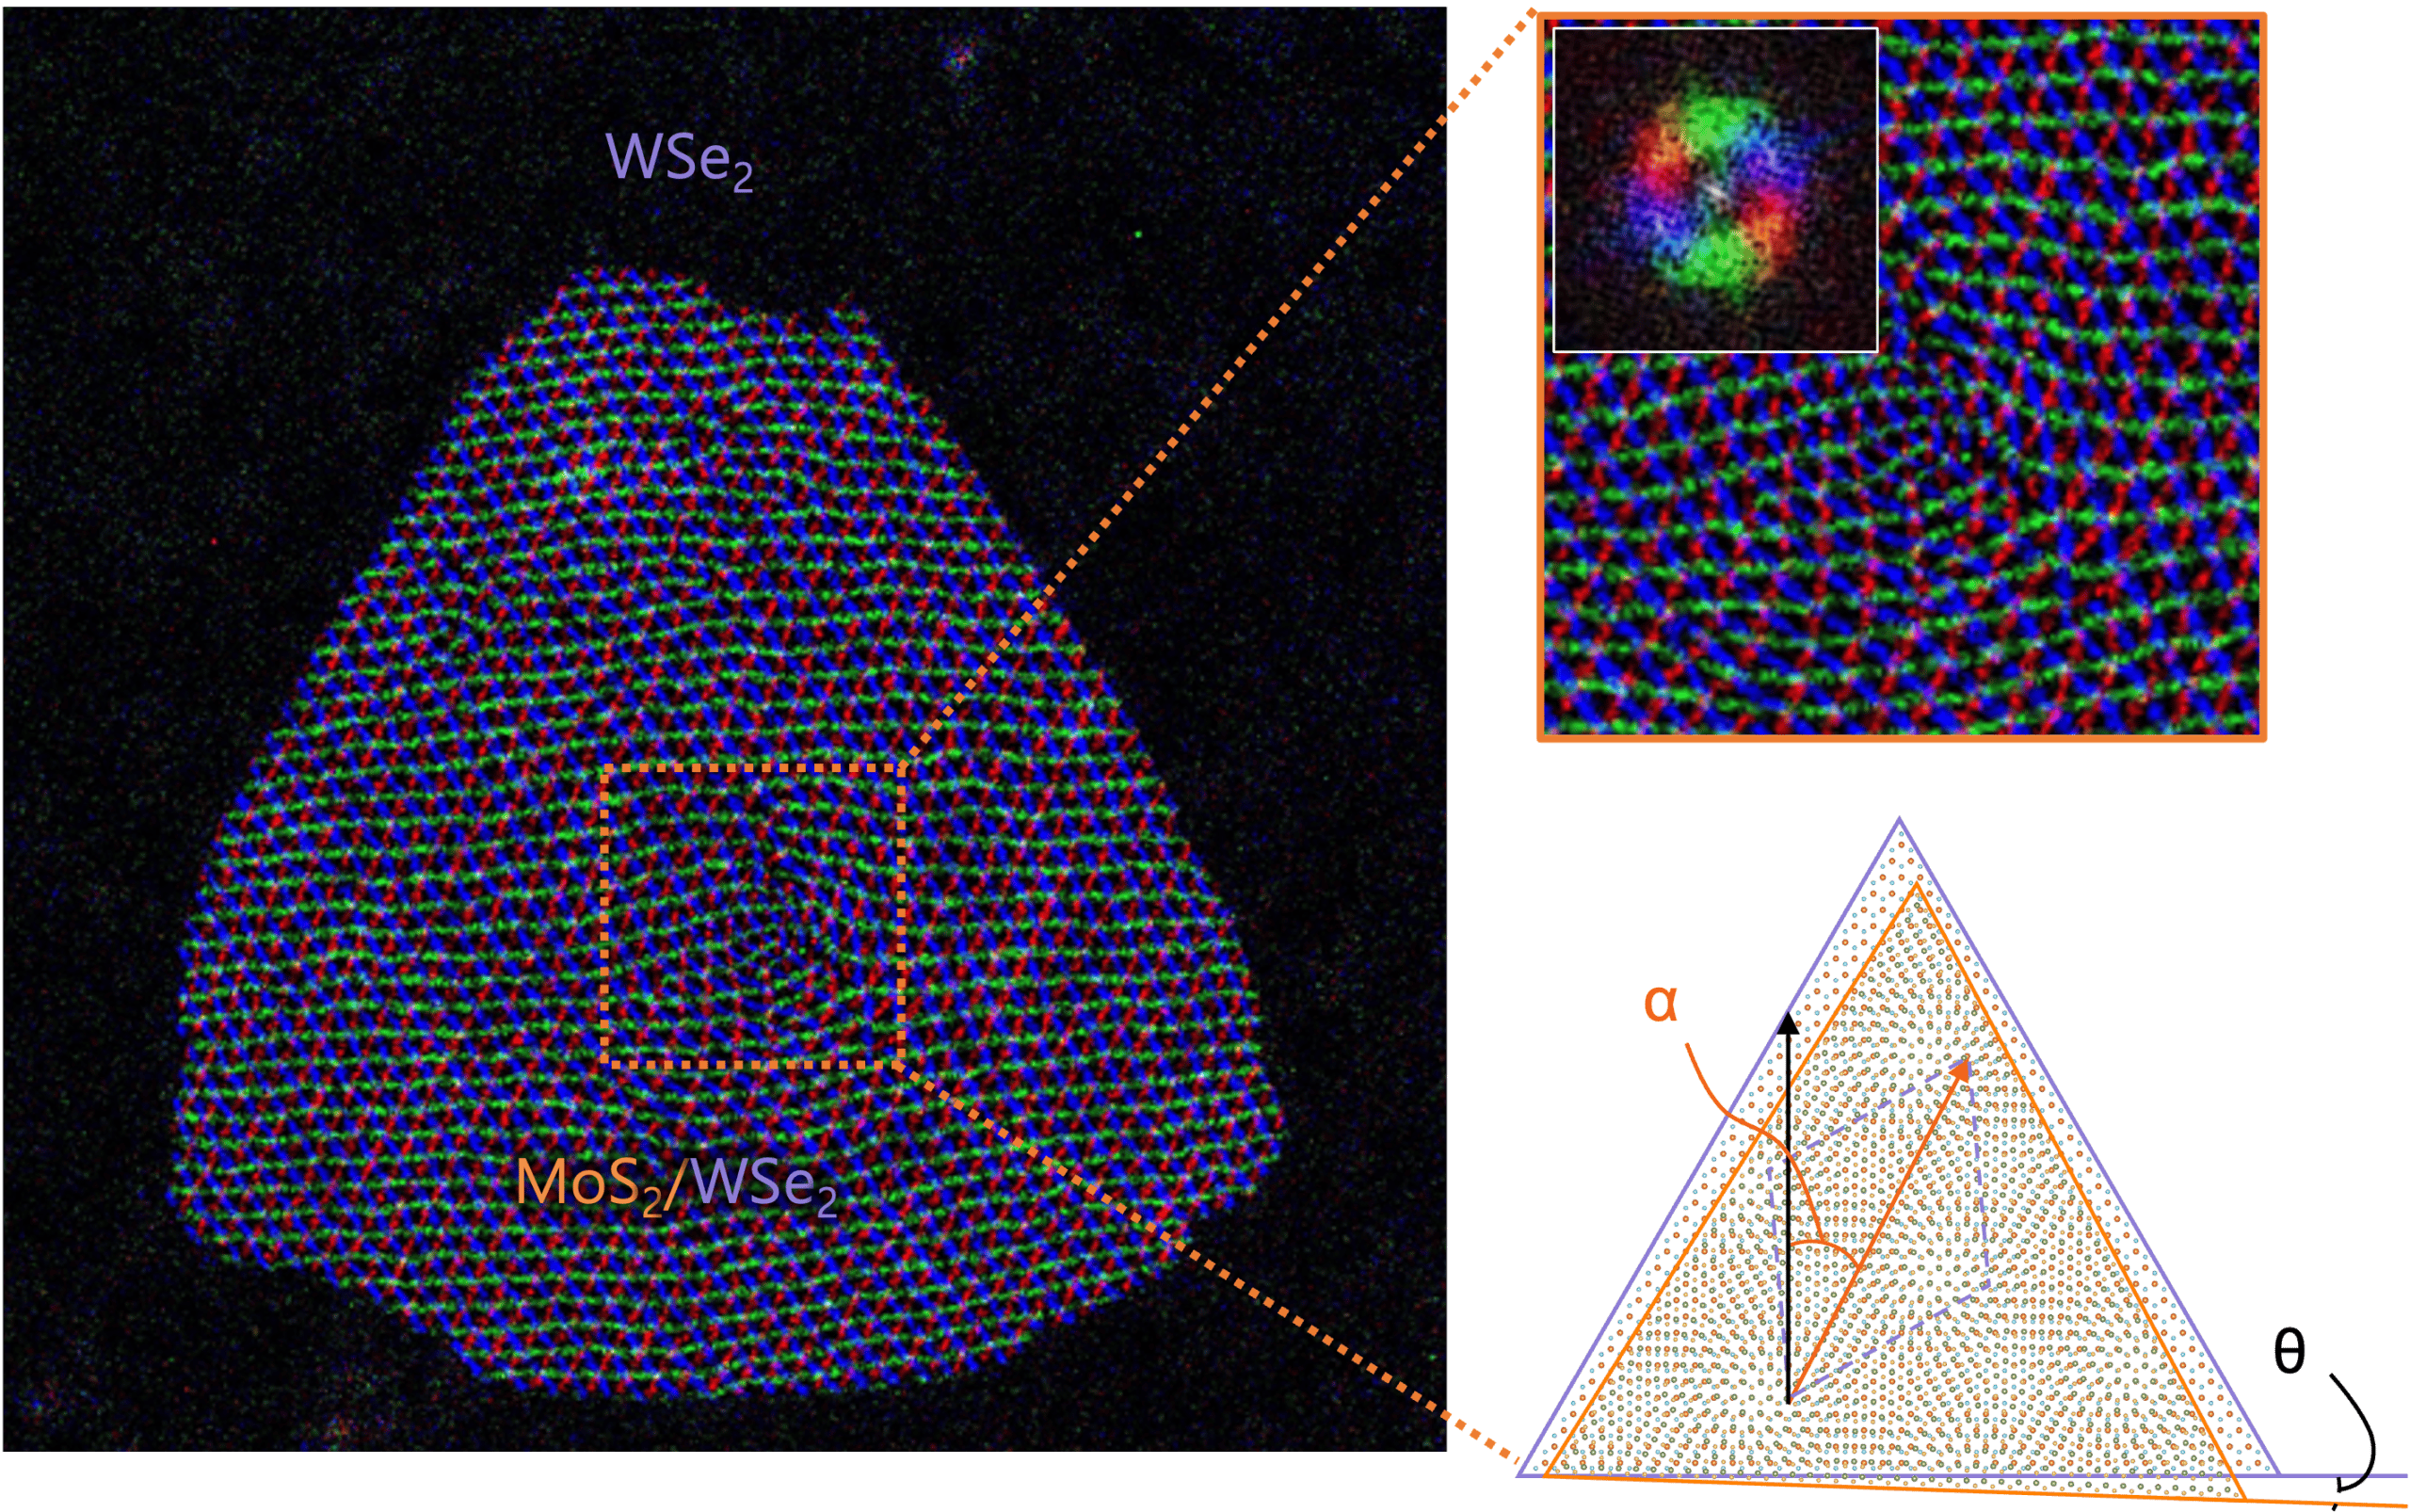
In this work, the researchers studied two systems: MoS₂ on WS₂, where the lattice spacing matches closely, and MoS₂ on WSe₂, where there is a larger mismatch. When the layers fit well together (MoS₂/WS₂), the top layer slightly compresses and the structure remains well aligned. However, when the layers do not fit well (MoS₂/WSe₂), moiré patterns appear, which are large-scale patterns caused by mismatched lattices, and these patterns become bent and irregular. The researchers found that instead of forming defects, the material relieves strain through local rotations and distortions of the lattice.

Image showing local rotations between atomically thin MoS₂ on WSe₂ layers

Previous studies had not clearly explained how strain is relieved at the atomic scale, whether it leads to defect formation or alternative mechanisms, or how these distortions vary across nanoscale regions. This research helps scientists better understand and control the behaviour of stacked 2D materials, which is important for designing future ultra-thin electronics, quantum devices, and optoelectronic technologies.

Do you want to learn more about this topic?

Tuning and exploiting interlayer coupling in two-dimensional van der Waals heterostructures by Chenyin Jiao et al. (2023)

Defects as topological sensors

Topological features are important because they give rise to states that cannot easily be destroyed. These robust states give materials special behaviours that enable new kinds of electronics and photonics. Some topological systems can even host exotic quasiparticles such as Majorana modes, which are their own antiparticles and are promising building blocks for quantum computing.

However, existing methods for detecting topological states in materials have significant limitations. They typically probe only the surface, even though topology is a bulk property. Topological transitions can be subtle and difficult to identify, and topological signatures can be obscured by impurities or disorder. In some cases, topological features have no easily measurable experimental signature at all.

In this work, the researchers made a striking discovery: ordinary crystal defects can be used to detect topological behaviour inside a material. When a defect is placed in a material with a topological electronic structure, it produces an additional energy state inside the band gap, known as a mid‑gap mode. This effect is universal and appears for the most common types of imperfections: vacancies, Schottky defects, substitutions, and interstitials.

The defect acts as a marker for topology because a mid‑gap mode forms only when the surrounding material is topological. In a trivial material, no such state appears. This happens because the wavefunctions in a topological material have a global structure that cannot be altered locally; introducing a defect forces the system to compensate by creating a mid‑gap state.

This topological probe is not symmetry‑dependent and works in any spatial dimension, making it relevant to 2D materials, 3D crystals, superconductors, photonic and acoustic lattices, and even non‑Hermitian systems. The researchers confirmed this experimentally by building acoustic Chern lattices, where sound waves behave mathematically like electrons. By introducing controlled defects, they observed mid‑gap states exactly where the theory predicted.

This work shows that ordinary crystal defects can serve as reliable, built‑in indicators of a material’s hidden topological character, offering a simple and universal way to detect topology directly within the bulk.

Read the full article

Ordinary lattice defects as probes of topology

Aiden J Mains et al 2026 Rep. Prog. Phys. 89 048002

Do you want to learn more about this topic?

Topological order, emergent gauge fields, and Fermi surface reconstruction by Subir Sachdev (2018)

Cosmic crisis averted as supernovae put dark energy back on track

Through fresh analysis of supernovae data, a team of astronomers has discredited a recent study that suggested that dark energy has weakened since the early universe.

Led by Phil Wiseman at the UK’s University of Southampton, the team showed that the apparent weakening almost disappears after accounting for a known correlation between supernova brightness and galaxy mass. This latest work confirms that the universe’s expansion is accelerating – a discovery that bagged three astronomers the 2011 Nobel Prize for Physics.

Type 1a supernovae occur when a white dwarf accretes mass from a binary companion star. Eventually, it reaches a critical mass where the crushing weight of its gravity can no longer be supported by electron degeneracy pressure, triggering an explosion that can briefly outshine entire galaxies.

These events are especially valuable to cosmologists because white dwarfs always explode at the same critical mass – meaning type 1a supernovae always reach around the same peak brightness. As a result they are “standard candles”, whereby their distances from Earth is inferred by their apparently brightness. The rate at which a type 1A is moving away from us is given by the redshift of its light. By measuring the distance and motion of these objects, the rate of the universe’s expansion can be determined as a function of time.

Driving acceleration

Since the 1990s, researchers have observed thousands of type 1a supernovae. Contrary to expectations for a matter-dominated universe, these measurements revealed that the universe’s expansion is speeding up. This lead to the concept of dark energy – a hypothetical entity that is driving this acceleration.

But in 2025, a team of astronomers in South Korea, led by Junhyuk Son at Yonsei University, Seoul, made an observation that appeared to turn this long-standing picture on its head. “They claimed that a subtle correlation between the brightness of the supernova and the age of the galaxy it exploded in could, if left uncorrected, means that the overall measurements actually now indicate that the expansion is now slowing,” Wiseman explains. “In other words, that dark energy was strong billions of years in the past, but has subsequently weakened.”

In their study, Wiseman and his colleagues revisited the data used by Son’s team – accounting for a correction that the previous astronomers hadn’t applied. Regardless of redshift, the peak brightness of type 1a supernovae in lower-mass galaxies is known to be slightly fainter than those in higher-mass galaxies. Although the reasons for this correlation remain unclear, astronomers have routinely been correcting for it over the past 15 years.

Wiseman’s team applied the same correction – ensuring their calculated distances were unaffected by differences in galaxy mass. “We also used simulations, where we traced how the age of the exploding stars and the galaxies they explode in evolve with cosmic time,” Wiseman says.

Similar ages

With this correction applied, the claimed correlation between supernova brightness and host galaxy age became almost undetectable. “Even if we account for the prediction that the relationship between the supernova and the galaxy should change as we look further back in time, we end up with almost identical measurements of dark energy,” Wiseman continues. Their simulations also showed that supernova progenitor stars have exploded at consistently similar ages throughout cosmic history.

The results will likely come as a relief to many cosmologists, averting the dark energy crisis some had feared. All the same, the team says Son’s study provides a valuable test of existing approaches to measuring the universe’s expansion rate, given the limitations of current observational capabilities.

“In an ideal world, we think a correction based on the age of the galaxy would be slightly more accurate than using the galaxy mass, but these measurements are currently not available for more than a handful of supernova host galaxies in the distant universe,” Wiseman says. “Until then, a mass correction is adequate and the implication is that the universe is still accelerating due to dark energy.”

The research is described in Monthly Notices of the Royal Astronomical Society.

Belgian Nobel-prize-winning theoretical physicist François Englert dies aged 93

The Nobel-prize-winning Belgian theoretical physicist François Englert, whose work led to the discovery of the Higgs boson, died on 18 June at the age of 93.

Englert’s studies, which he carried out in the early 1960s with his colleague Robert Brout, demonstrated that fundamental particles can acquire mass by interacting with a field that permeates the universe. The work set in motion a decades-long hunt for the Higgs boson, which was finally discovered at the CERN particle-physics lab near Geneva in 2012.

For the work, Englert shared half of the 2013 Nobel Prize for Physics together with the British theoretical physicist Peter Higgs, who died in 2024.

Born in Brussels, Belgium, on 6 November 1932, Englert studied electrical engineering at the Free University of Brussels (ULB) before switching to physics and completing a PhD at the university in 1959.

For two years he then worked at Cornell University before returning to ULB in 1961, where he remained for the rest of his career.

New particle

“Spontaneous symmetry breaking” is a well-known concept in condensed-matter physics where it had been used to explain how, for example, unordered regions of a magnetic material could suddenly align themselves in a specific direction.

In the early 1960s, the Japanese–American particle physicist Yoichiro Nambu adapted the phenomenon into quantum field theory.

Working at the ULB, Englert and Brout took inspiration from Nambu’s work and in 1964 the pair proposed that the weak and electromagnetic interactions could be united by spontaneous symmetry breaking.

Higgs, who independently came to the same conclusion as Brout and Englert, showed that the particles that carried the weak force acquired their mass through interactions with an all-pervasive field, now known as the Higgs field with the interactions occurring via the Higgs boson.

In 2012 at CERN’s Large Hadron Collider, physicists working on the LHC’s giant ATLAS and CMS detectors discovered the Higgs boson with a mass of about 125 GeV.

The following year, Englert shared half of the 2013 Nobel Prize in Physics with Higgs “for the theoretical discovery of a mechanism that contributes to our understanding of the origin of mass of subatomic particles, and which recently was confirmed through the discovery of the predicted fundamental particle, by the ATLAS and CMS experiments”.

Brout died in 2011 so was not given the Nobel prize as it is not awarded posthumously.

As well as the Nobel prize, Englert won many other awards including the Francqui Prize, awarded by the Francqui Foundation in 1982, the Wolf Prize in Physics (2004) and the American Physical Society J J Sakurai Prize (2010). In 2013, he was ennobled a baron by King Albert II of Belgium.

Particle physicist John Ellis from King’s College London, who has spent most of his career at CERN, told Physics World that he will remember Englert for his “his modest and polite demeanour, despite his evident and justified pride in his ground-breaking work”.

“His memory lives on as one of the founders of the Standard Model and an originator of one of its greatest puzzles, the Brout-Englert-Higgs mechanism for breaking symmetries and generating particle masses,” adds Ellis. “How long will it be before we understand this remarkable, yet crucial, aspect of Nature?”

An open access future is only possible by addressing its problems

At the turn of the 21st century the open access (OA) movement proposed an inspiring idea: to make scientific knowledge freely available to everyone, everywhere. In what became known as the Budapest Open Access Initiative, the movement aimed to challenge scientific publishers who continued to raise subscription prices, sometimes without justification. This, OA proponents suggested, was increasingly undermining poorer countries and institutions, who often could not afford the subscriptions.

A quarter of a century on, numerous institutions – both national and international – have strongly promoted the transition from the subscription-based model to OA. But to what extent has this transition actually taken place?

In a recent post on his Journalology blog, publishing consultant James Butcher showed that while open-access publishing increased rapidly from 2000 to 2023, by 2024 it had stagnated if not reversed, with papers in subscription-based journals increasing. Gold OA – where an article processing charge (APC) is paid by the author to make the paper immediately freely available to read – showed a decline compared to hybrid OA, in which a traditional, subscription-based journal makes individual articles freely available to the public.

Butcher offers China as a possible explanation for the trend. The country now has the fastest-growing scientific output, accounting for roughly 25% of all research articles published annually – up from about 13% a decade ago. This rapid expansion of Chinese research activity is influencing the pace of the global OA transition. Data indicate that Chinese researchers rarely publish OA in hybrid journals, tending instead to publish either in fully OA journals or, more commonly, in subscription-based journals.

The data clearly show that the global transition to OA is only feasible once Chinese researchers significantly change their publishing practices. However, this shift entails a major financial challenge for China.

Historically, China has paid considerably less in institutional subscription fees than Europe, Japan or the US. As China’s research output continues to grow, publishing a greater share of papers as OA would impose increasingly high costs, making traditional subscription journals a financially attractive alternative for many researchers.

The reassessment of the open-access model is not limited to China. In 2018 cOAlition S – a consortium of national research agencies and funders from 12 European countries – launched Plan S, which proposes that publicly funded research is made immediately available in full OA without embargo. The consortium has now released a new strategy for 2026–2030 that adopts a more flexible approach, supporting alternatives to paywalled journals without explicitly aiming to replace them.

If these trends consolidate, the OA model may face additional, often overlooked obstacles: coexistence of different publication traditions and the unequal distribution of publication costs across countries and institutions. Both factors hinder progress toward a fully OA system.

Access all areas

OA is a noble concept but, unfortunately, what works in theory does not always withstand the complexity of the real world. APCs today can exceed $10,000 and are paid by the authors’ own research funds. It is worth emphasizing that a good journal has far more readers than authors, so distributing costs among readers is much more equitable than placing them on authors.

We are also in a paradoxical situation where publishers could be collecting both APC revenues and subscription fees. Many publishers are now signing Transformative Agreements with institutions, designed to eliminate this “double dipping” by bundling reading fees and open-access publishing costs into a single contract.

In practice, we have moved from a system of “free to publish, pay to read” to one of “free to read, pay to publish” where the burden of cost has shifted from institutions to individuals. This radical transformation has not eliminated inequality. On the contrary, it paradoxically risks deepening it, producing effects that run counter to the original goals of the OA movement.

OA has also inadvertently promoted the rise of predatory journals, which continue to prosper, while, in the meantime, an entirely different major challenge has emerged: artificial intelligence (AI). Generative AI systems are trained on massive volumes of text, including OA scientific articles. In other words, the scientific community is providing free data to large tech companies, which use them to develop proprietary models that generate large profits.

OA articles are often published under Creative Commons licenses that allow reuse, even for commercial purposes. Yet AI models often do not cite their sources or attribute authorship. Thus, publicly funded knowledge is exploited for private profit, but academic institutions, researchers and publishers often do not receive any recognition in return, not even symbolic.

If AI tools can be properly regulated, however, they can help accelerate scientific progress by using open, high-quality data. Still, the question of whether the benefits of OA outweigh the drawbacks remains largely unanswered.

Taking responsibility

OA has not been a total failure, but neither has it lived up to the high hopes it once inspired. With OA we have gained broader access, but at the cost of new imbalances. We have often sacrificed quality for quantity. And above all, we have largely forgotten that science is not just about sharing, but also about recognition, responsibility and fairness.

OA remains an idea with remarkable potential but only if we resist its most rigid and dogmatic interpretations, which consider it as an unquestionable good. Initially, only the advantages were acknowledged but now, after a quarter of a century, we are beginning to recognize its downsides.

Identifying problems is the only way to develop solutions: without a proper diagnosis, there is no effective cure. Resolving the persistent and emerging challenges of OA is now urgent, especially as the expanding role of Chinese research introduces new and unexpected dynamics into global publishing given their fondness for the subscription model.

There is no magic solution. Improving OA in scientific publishing requires shared responsibility across the research community. Researchers should engage responsibly in publishing and peer review, develop a better understanding of the complexity of the editorial process, and reject unethical practices.

Universities must reform evaluation systems by prioritizing research quality over publication volume, remove perverse financial incentives, and strengthen training in publishing ethics at the earliest stages of scientific careers.

Publishers should ensure fair and institutionally supported publication costs, enhance editorial and peer review standards, and actively counter predatory publishing.

At the policy level, funding agencies and governing bodies can foster greater accountability by supporting ethics training, and develop traceability and compensation mechanisms for AI use of OA content. Agencies could also invest in sustainable community-led models such as diamond OA platforms, in which research articles are published free to read and free to publish, with publishing costs subsidized by universities or government grants.

No-one wants to go back. But if we truly aspire to a science that is open, fair and sustainable, scientists must acknowledge the problem and take responsibility for addressing it.

Quiz of the week: what’s the secret to the Venus flytrap’s swift closure?

Fancy some more? Check out our puzzles page.

New class of magnons live a hundred times longer

University of Vienna researchers

Bosonic quasiparticles such as magnons show much promise for enabling on-chip quantum information technologies that can be scaled down to the nanoscale, but their too-short lifetime has held back such applications until now. An international team of physicists says it has now increased this lifetime by a hundredfold, thanks to the discovery of a new class of magnons known as short-wavelength dipole-exchange magnons.

Magnons are the collective oscillations of coupled magnetic spins in a material. They are particularly promising for next-generation computing because they could allow for information processing based on the wave-like dynamics of these spins rather than the flow of electrons, thereby significantly reducing energy losses. They can also naturally couple to many other fundamental quasiparticles, such as phonons and photons, which makes them ideal as the building blocks for hybrid quantum systems.

The main drawback of magnons, however, is that they die too fast, explains Andrii Chumak of the University of Vienna, who led this latest study. “Indeed, their lifetimes are typically limited to a few hundred nanoseconds, something that puts a hard ceiling on what we can do with them in a quantum architecture.”

A lifetime of up to 18 µs

In this work, which is detailed in Science Advances, the researchers discovered short-wavelength dipole-exchange magnons in highly pure, single-crystal yttrium iron garnet (YIG) spheres held at millikelvin temperatures. These magnons last for up to 18 µs, which is nearly two orders of magnitude longer than that previously observed for these quasiparticles.

As often in science, the discovery was accidental, says Chumak. “We had prepared three YIG spheres with varying degrees of purity for planned quantum experiments with superconducting qubits, and we simply wanted to characterize these spheres and identify the one that hosted the longest magnon lifetime,” he recalls.

“An 18 microsecond lifetime places magnon coherence on a par with that of typical transmon superconducting qubits used in today’s quantum processors,” he tells Physics World. “This reshapes the role magnons can play in hybrid quantum architectures – from lossy intermediaries to robust quantum memories and low-loss links able to mediate interactions between distant qubits on a chip.”

A programmable on-chip “quantum bus”

And that’s not all: long-lived magnons coupled to superconducting circuits could act as a programmable on-chip “quantum bus”, entangling many distant quantum bits (qubits) made from these hybrid structures along a common waveguide, rather than only nearest neighbours, he adds. The results also point to a clear materials-science route to push magnon lifetimes even further, in particular by continuing to reduce rare-earth impurity concentrations in YIG.

There is a way to go before real-world applications see the light of day, however. For one, the researchers still have some physics to understand, but that is what makes the project so intriguing for them, they say.

Chumak says that the most immediate future step in his team’s work will be an echo-type experiment to measure the lifetime of these magnons directly, rather than inferring it from the so-called parametric instability threshold, as was done in this work. “In parallel, we will need to learn how to excite and detect these short-wavelength magnons efficiently using nanoscale transducers, which is essential before they can be integrated with superconducting qubits.”

“The field of quantum magnonics is still very young compared to other quantum platforms,” Chumak notes, “so it will take some time before we reach actual quantum computing applications – but the path is now much more concrete than it was a year ago.”

Ken’ichi Nomoto and Stanford Woosley share the 2026 Shaw Prize in Astronomy

The 2026 Shaw Prize in Astronomy has been awarded to Ken’ichi Nomoto and Stanford Woosley. They share the prize “for their studies of stellar explosions and the origin of the elements”.

In this episode of the Physics World Weekly podcast, Woosley and Nomoto talk about the astrophysics of supernovae – exploding stars – and what these spectacular events tell us about the elemental composition of the universe and how it has expanded since the Big Bang.

Nomoto is emeritus professor and visiting senior scientist at the Kavli Institute for the Physics and Mathematics of the Universe, at Japan’s University of Tokyo. Woosley is professor of astronomy and astrophysics at the University of California, Santa Cruz in the US.

This podcast is sponsored by the Shaw Prize Foundation.

  • The Shaw Prize is an international prize based in Hong Kong. Currently, it consists of three annual awards. The Shaw Prize in Astronomy; The Shaw Prize in Life Science & Medicine; and The Shaw Prize in Mathematical Sciences. In 2027 a fourth prize will be awarded for work in computer science. Each prize carries a monetary award of $1.2m. The prize was established by Runrun Shaw, a media mogul and philanthropist. It was first awarded in 2004 and since then 121 prizes have been given individuals from across the world.


Copyright © 2026 by IOP Publishing Ltd and individual contributors