“A surprising amount of stuff gets wasted every year because consumers can’t get it out of the packaging it came in,” writes Katie Palmer, who covers the science beat at Wired. In her article “The physics behind those no-stick ketchup and mayo bottles”, she explains how the company LiquiGlide has developed its slippery coating for the insides of bottles. The challenge was to create a permanently wet coating that would stick to the inside of the bottle but not mix with the liquid foodstuff – and it also has to be safe for human consumption.
LiquiGlide spun out of the lab of Kripa Varanasi at the Massachusetts Institute of Technology and has just announced that an international food-packaging supplier will be using the coating on its mayonnaise bottles. You can watch a demonstration of the coating in the video above.
The first-ever spectrometer made from quantum dots has been unveiled by Jie Bao of Tsinghua University in China and Moungi Bawendi of the Massachusetts Institute of Technology in the US. According to its inventors, the instrument could be produced commercially to be as small, inexpensive and simple as a mobile-phone camera. Such compact spectrometers could find a wide range of applications, from gathering scientific data on space missions to sensors integrated within household appliances.
Spectrometry measures the intensity of light as a function of wavelength and is used to study various properties of light-emitting and light-absorbing substances. This makes it an invaluable analytical technique that is used in a broad range of scientific and technological disciplines. Most spectroscopic techniques involve dispersing light in terms of its wavelength. A prism, for example, can be used to bend light into its constituent wavelengths (colours) and a spectrum can then be acquired using a position-sensitive light detector. Bao and Bawendi have taken a different approach, using quantum dots to create an array of band-pass filters for the light to pass through before it reaches a position-sensitive detector.
Tunable artificial atoms
Quantum dots are tiny pieces of semiconductor just a few nanometres across. They are sometimes described as artificial atoms because, like atoms, they absorb and emit light at specific wavelengths. Unlike atoms, however, the wavelengths can be tuned by simply adjusting the size of the quantum dot.
Bao hit upon the idea of using quantum-dot materials in spectrometers while investigating their use in solar cells and light detectors. “I realized this material has a very unique property that no other material can match,” he says, referring to the simple means of tuning the optical response. With this in mind, he began investigating using large numbers of quantum dots in a new type of spectrometer. By monitoring the light that the dots absorbed, it would be possible to determine relative intensities at various wavelengths in the spectrum of the incident light.
Bao and Bawendi’s device is an array of 195 different types of quantum dot with absorption spectral features that cover a wavelength range of 300 nm. The quantum dots were dispersed in solution as colloids. These mixtures were then used to coat individual pixels of the light-detecting array of a digital camera. Because it is compatible with existing camera technology, Bao says that the spectrometer could be mass-produced at a relatively low cost.
Wavelength multiplexing
The new spectrometer employs wavelength “multiplexing”, a technique that was first developed by the telecommunications industry to allow several different signals to be transmitted along the same optical fibre. Multiplexing has already been used for spectroscopy, but Bao says that previous designs were not appropriate for making small, low-cost and high-performance devices. “With these colloidal quantum-dot materials you can do that,” he says.
“This is the first time people have used quantum dots in a spectrometer,” adds Bao. “In fact, it’s the first time that more than a handful of different quantum-dot materials have been used in the same device.”
Beyond the daguerreotype
Bao believes that the device could be the start of a revolution in the practical application of spectroscopy. He likens this to the plethora of applications for photography that emerged as the technology evolved from the cumbersome daguerreotype process – with its huge cameras and long exposure times – to the tiny digital cameras of today.
“If you think of cameras in the old days, their use was very limited – but now cameras are not just used in mobile phones but also for endoscopes, or added to pills to image digestion,” says Bao. “When the process of taking photos was complicated, these applications were hard to imagine.”
The researchers are now investigating how the quantum-dot spectrometer could be used in sensors and are also looking at ways to optimize the device architecture.
Full details of the research are reported in Nature.
When you step out onto Racetrack Playa in California, the first thing you notice is the desert wind whistling through the craggy terrain around you. The next thing to catch your attention is the hard-packed surface of the playa itself, inconceivably flat and dotted with dark, angular rocks. Look a little bit closer, though, and you will see that in this vertiginous landscape, something very strange has happened: the rocks have been moving.
Racetrack’s “sailing stones” range from pebbles to boulders weighing hundreds of kilograms. They originate from the ancient dolomite cliffs at the playa’s southern end, where incessant winter freeze–thaw cycles cause pieces to splinter off and tumble down onto the flat expanse below. The stones’ dark colour and angularity contrast with the playa’s smooth, beige surface, giving the distinct impression of a man-made sculpture. And trailing behind many of the rocks are long, shallow furrows in the hard-packed clay: a telltale sign that, at some point, these stones must have been on the move.
The rock trails wind erratically, sometimes turning 90°, sometimes doubling back on themselves. They often terminate with a rock at one end that has mounded up clay in front of it, like the scrapings of a bulldozer. Some furrows run parallel to one another, wheeling like line-of-battle ships tacking into the wind. Apparently, the stones formed the furrows by ploughing through the clay when it was wet. But how?
This question has plagued generations of visitors to Racetrack Playa, and scientists have tried to answer it for decades. One of the first, John Shelton of Pomona College, landed a small aircraft on the playa back in 1953. He found that the airflow from the plane’s propeller (equivalent to a 70 km/h wind) was enough to flip over one of the rocks, suggesting that wind could play a role in their movement. These days, US federal law prohibits such adventurous experiments on the playa, which is now a protected wilderness area. However, later, less disruptive research by San José State University geologist Paula Messina also found support for the wind theory. During her graduate studies, Messina – known as the mother of modern Racetrack research – measured high and highly variable winds on the playa. In 2000 she and her longtime collaborator (and husband) Phil Stoffer demonstrated that the surrounding valley’s topography channels these winds onto the playa’s southern edge.
Even so, a simple calculation shows that to move a typical sailing stone with a diameter of about 10 cm and a mass of 3 kg, the wind speeds would need to exceed 50 m/s or 180 km/h – much higher than anyone has observed on Racetrack. To circumvent the need for high winds, several alternative theories have been proposed over the decades, from the growth of slippery algal or bacterial mats when the playa is wet to pranking rituals by university students and even the actions of passing aliens. But all these hypotheses, from the plausible to the absurd, remained uncorroborated, and exhaustive surveys of the sailing stones and their trails by Messina during the 1990s and early 2000s produced interesting but ambiguous results that didn’t point towards any one hypothesis.
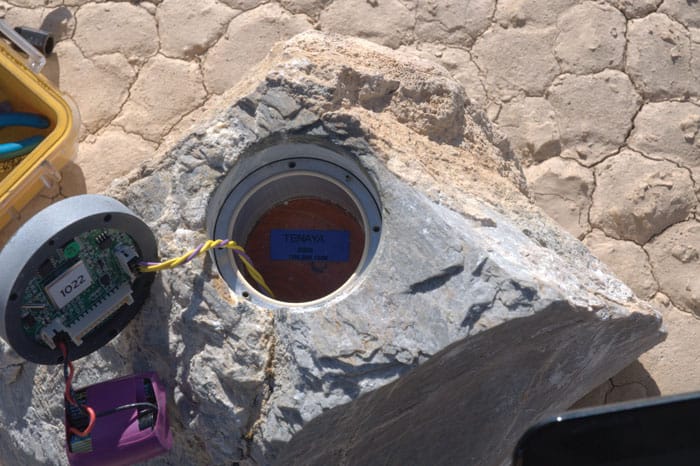
Tracking device Close-up of a GPS-equipped rock. The GPS unit begins logging the rock’s position when an initial movement triggers an internal switch. (Courtesy: Interwoof)
Solving the mystery of the sailing stones would take years’ more fieldwork, an array of hi-tech instruments, and more than a little luck. On a cold December morning in 2013, all these things came together. As members of our research group stood on the banks of Racetrack, we finally saw the sailing stones in motion – and the mechanism for their wanderings proved more complex and subtle than any of us had suspected.
Remote observations
Racetrack Playa is a closed basin nestled high in the Last Chance Range, more than two hours’ drive from the Death Valley National Park visitor centre. To get there, you head north-west from the centre on Highway 190, then turn off onto a rough gravel road that takes you past the Ubehebe volcanic craters, through a forest of Joshua trees, and down into the desolate Panamint Valley. After you pass the Teakettle Junction signpost (bestrewn with signed teakettles from generations of park visitors), Racetrack Playa appears as a flat, kidney-shaped landform in the hazy distance.
My first visit to Racetrack came during a class field trip when I was in graduate school at the University of Arizona’s Lunar and Planetary Laboratory. My friend and colleague Ralph Lorenz, a research scientist in the lab, came on the trip, too. Stepping onto the windswept playa, we were immediately struck by its austere beauty and gripped by the mystery of the sailing stones, squatting on the surface like desert sphinxes. Soon after the trip, Ralph and I began preparing to return.
The same technology revolution that brought us iPhones and military drones has also provided scientists a wealth of instrumentation for in situ observations of natural phenomena. Ralph had already collected a considerable arsenal of these tools through his other desert fieldwork, and deploying them on Racetrack over the winter to observe meteorological conditions seemed like an obvious thing to do. With luck, we thought, we might even catch the rocks in motion.
After obtaining a research permit from the National Park Service, we began deploying our time-lapse cameras, wind gauges and thermometers in the late autumn of 2007. Sometimes, we set up equipment on nearby playas (such as Little Bonnie Claire, located only an hour from Death Valley) where rock tracks have also been seen, although not as dramatically as on Racetrack. Each autumn, we cast our scientific net in order to observe the rainy season during winter, when the rocks probably moved, and each spring, we hauled in our catch of data. By spring 2012 we’d collected a wealth of data about winter weather on Racetrack. But somehow, in six winters, there had been no significant rock movements. Perhaps the rocks were camera-shy?
Still, we had made some progress. Our data showed that Death Valley and the surrounding region is a meteorologically dynamic place. At more than 1 km elevation, Racetrack’s winters are cold as well as wet, and snow storms are common, often covering the playa in centimetres of snow. In our time-lapse imagery, we watched the winter Sun creep out onto the playa and melt this snow to produce a shallow, crystal-clear pond. We knew beforehand that such ponds were responsible for the playa’s extreme flatness; by periodically wetting and smoothing the surface clay, they keep Racetrack nearly level, with only a few centimetres of relief across its entire 2 km by 4.5 km area. We saw that these ponds persisted for days or weeks at a time, and night-time lows would often re-freeze them, producing large ice floes many tens of metres across.
The data began to implicate ice as the key to solving the sailing-stone enigma, although this wasn’t an entirely original result. In 1955 George Stanley, a geologist at California State University, Fresno, had suggested the moving rocks might be frozen into large ice floes. By physically connecting the rocks to something with a bigger surface area, Stanley reasoned, these ice floes would increase the total wind drag on the rocks and, if they were big enough, act like sails to help them move. This explanation accounted for the geometrical congruence of many, but not all, rock trails: the rocks that formed congruent trails must have been carried together by the same ice floe.
However, a well-known experiment in the 1970s called the role of ice into question. As part of a long-term survey of Racetrack, two California geologists, Robert Sharp and Dwight Carey, drove steel rebar into the playa’s surface to form a corral around two rocks, with stakes spaced about half a metre apart around the corral’s circumference. (This was, again, before the area became a protected federal wilderness.) Sharp and Carey theorized that the stakes would prevent a large ice floe from carrying rocks out of the corral. Instead, one rock escaped the corral, while the other remained. How could large ice floes do that?
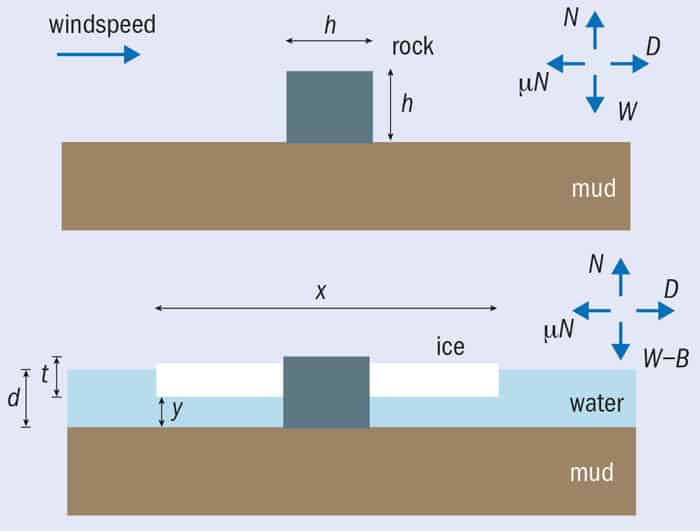
In 2011 we proposed an alternative “ice-pothesis”. An ice floe might buoy a rock frozen inside, and for sufficiently (and plausibly) thick ice floes, the buoyancy would reduce the friction and possibly bring the wind speed required for movement down to observed values (see figure 1, below). An ice raft could also circumvent the Sharp and Carey result since the floes could be small enough to squeeze out of the corral but still large enough to buoy the rocks slightly. Experimenting in his kitchen sink, Ralph froze a small rock in ice and showed that, in principle, ice-rafting could work.
1 Go with the floe Forces acting on a solitary rock (a) and a rock in an ice raft (b). In the former case, the normal force N on a cubic rock of dimensions h is the weight of the rock, Wr = gρrh3, where the density ρr is approximately 2700 kg/m3. The presence of water of depth d, along with a square ice raft of thickness t and horizontal dimensions x reduces this by introducing a buoyant force B. The magnitude of B depends on the submerged volume of the rock and ice, but for sufficiently large ice rafts, the frictional force μN is reduced enough for the force of the wind D to push the rock along the playa. (Courtesy: IOP Publishing)
Like so many ideas before it, our ice raft idea was plausible but unproven, and our time-lapse data were ambiguous. Two more years would pass before we would learn whether we were right.
Joining forces
During a visit to Racetrack in autumn 2012, Ralph and I found a brand-new weather station at one end of the playa. There was a phone number attached and, thanks to the vagaries of radio physics (which provided impressively clear mobile phone reception at that one spot in Death Valley and nowhere else), we were able to call it immediately.
A friendly voice greeted us on the other end. The weather station belonged to Jim Norris, an engineer in Santa Barbara, and his cousin Richard Norris, a palaeobiologist based at Scripps Institution of Oceanography in California. They were trying to unravel the mystery, too, and with permission from the national park, they had set up the station as part of their Slithering Stones Research Initiative. They agreed to talk more about their work, and we began an e-mail correspondence.
The Norrises’ approach was to drill holes in test rocks and insert specially engineered GPS receivers (see image above). These receivers would show when the rocks moved and how fast they went, while the weather station would keep tabs on the winds and rain. When Ralph met the Norris group in early November 2013, he teased them that putting GPS receivers in rocks was “probably going to be the most boring experiment in the history of science”. Even so, their approach complemented ours, and we agreed to keep each other informed about any interesting developments. By this time, though, Ralph and I were used to waiting.
But we didn’t have to wait much longer. Arriving at night for a routine visit on 18 December 2013, Jim and Dick found the playa glistening with an extensive layer of ice. When they returned the next morning, a pond covered the southern third of the playa, but below-freezing temperatures kept the rocks locked in place, stuck in ice sheets a few millimetres thick floating on a pond about 5–7 cm deep. At 10 a.m. on the following day, Jim and Dick were at the opposite end of the playa from the rocks, servicing some instruments, when a light breeze began blowing. When they returned to the playa’s southern end in the mid-afternoon, they saw that more than 70 rocks had ploughed fresh trails in the surface. They had just missed it!
Desperately hoping to see the rocks move in person, they camped another night near the playa and awoke on 21 December to watch the sunrise over Racetrack’s broad, icy pond. Melt pools formed and enlarged as the Sun rose, a mid-morning breeze rippled the pond, and abruptly, at 11.37 a.m. the ice broke up, popping and snapping across its whole extent. And then, finally, the rocks began to move.
The ice, although thin as window glass, formed massive floating sheets that shattered as they made contact with the rocks. Most of the rocks remained motionless, acting like miniature ice-breakers as the ice was pushed past them, leaving wakes of ice shards floating in channels of open water downstream of each rock. But other rocks moved, hesitatingly, under the force of the floating ice, ploughing the murky bottom and shoving the mud out of the way, against the underside of the ice. The splintering ice melted quickly, and in less than 15 minutes, the ice panels were too fragile to move the rocks any farther. Within an hour, the floating ice had melted completely.
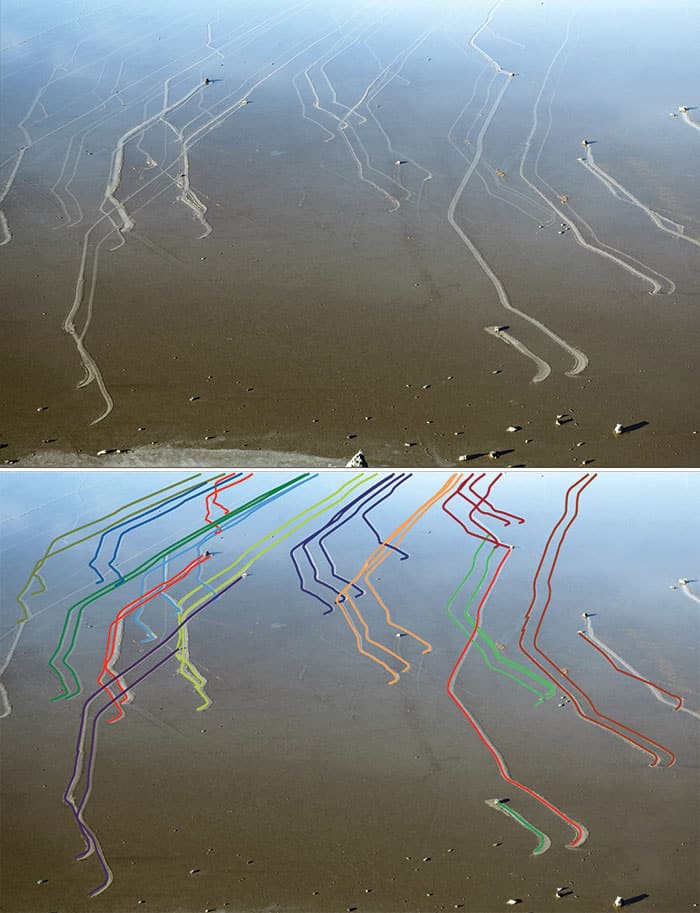
The subtle motion was hard to capture on film, but Jim and Dick’s GPS trackers showed the rocks had crept along at a few metres per minute, about the same rate as a crawling baby. GPS-tagged rocks separated by 153 m moved together, at exactly the same speeds and times, scribing identical trails (see figure 2, below).
2 Rocky roads A view from the dolomite cliff south of Racetrack reveals newly formed rock trails (top). Coloured lines (bottom) emphasize the congruence of adjacent rock trails. (CC BY PLOS One 10.1371/journal.pone.0105948)
Later that same winter, Ralph joined Jim Norris on a visit to the playa, and the rocks – recovered from their earlier stage fright – put on another show. This time, their movement was captured with Ralph’s kite-borne camera, and Jim filmed a cantaloupe-sized rock as it moved a few metres, at a distance of more than 30 m from shore. This meant that not only had several observers seen the rock movement first-hand, they had also obtained quantitative documentation of the circumstances. We knew how far the rocks moved, how fast and exactly when. We knew how thick the ice was and how strong the wind.
The answers emerge
It turns out that rock motion is rare because it seems to require a very precise set of conditions: a recent storm and a night-time freeze, followed by light breezes and sunshine to mobilize the ice. When these things combine, the vast momentum of a kilometre-wide floating ice panel can shove the rocks around like a bulldozer. These observations suggest that during Sharp and Carey’s rock corral experiment, a thin ice sheet may have shattered past the rebar stakes to push one rock (but not the other) out. Large, but increasingly fragmented, ice sheets could also account for some of the more puzzling results in Messina’s extensive GPS surveys, by producing trails that were often, but not always, parallel.
By mid-February of 2014 the pond had dried up completely and all the rocks went back to their slumber, baking in the Sun on a dry, cracked-mud playa. Rock trails that formed in a few minutes will probably remain for a decade, until a new pond appears. Always a place of wonder, Racetrack Playa is now a place with a bit of scientific understanding, too.
To learn more about the Slithering Stones Research Initiative, check out these videos from the Scripps Institution of Oceanography:
Sometimes, nature does something unexpected – something so rare, transient or remote that only a lucky few of us get to see it in our lifetimes. In the July issue of Physics World, we reveal the physics behind our pick of the weirdest natural phenomena on our planet, from dramatic rogue waves up to 30 m tall, to volcanic lightning that can be heard “whistling” from the other side of the world, and even giant stones that move while no-one is watching. We also tackle tidal bores on rivers and the odd “green flash” that is sometimes seen at sunset.
Plus, we’ve got six fabulous full-page images of a range of weird phenomena, including salt-flat mirrors, firenadoes, “ice towers”, beautifully coloured nacreous clouds, mysterious ice bubbles of gas trapped in columns, as well as my favourite – the delicately wonderful “frost flowers” seen very occasionally on plants.
Recently I blogged about quark novae, which are a passion of the University of Calgary astrophysicist Rachid Ouyed. I caught up with Ouyed at the Canadian Association of Physicists Congress in Edmonton last month, where between sessions he was busy writing a paper about quark novae.
I managed to coax him away from his calculations for long enough to record the above video, in which he talks about quark novae – huge explosions that some astrophysicists believe could occur shortly after some supernovae. Ouyed also talks about the quark stars that may be left behind and how quark novae could affect how astronomers measure cosmological distances.
The size of the UK’s astroparticle community – and the breadth of science receiving financial support – is “critically low”, according to a report by the UK Institute of Physics, which publishes Physics World. The report – A Review of UK Astroparticle Physics Research – says that limited funding is hampering the ability of the astroparticle physics community to train people and develop new applications.
The report was written by a five-member panel that was chaired by Alex Murphy, who is professor of nuclear and particle astrophysics at the University of Edinburgh. It says that the UK hosts a community of “world-class” astroparticle physicists that publishes high-quality papers and makes “major contributions” to several key international projects. The report also points out that the international standing of the community is “exceptional”, with many physicists in the UK holding senior positions in such projects.
Leadership roles
Recommendations to further improve astroparticle physics in the UK are also presented, including that the community should establish major leadership roles in one or more international projects “through numerically significant contributions in both personnel and capital”. The report also says the UK must continue its investment in projects such as the LUX-ZEPLIN dark-matter experiment at the Sanford Underground Research Facility in South Dakota, as well as the planned Cherenkov Telescope Array.
As for astrophysical neutrino physics, which is dubbed a “major pursuit” internationally, the report warns that the UK’s efforts are at a “low level” and calls for a more strategic approach to this area. The Science and Technology Facilities Council – the main funder of astroparticle research in the UK – must now examine the structure of its peer-review system to ensure that an interdisciplinary field such as astroparticle physics is properly represented in funding calls, the report says. However, it falls short of asking for a specific astroparticle physics “grants line”, due to the concern that this would result in a drop in funding for the subject.
“The main issue here is that projects have found it difficult to know exactly who their audience for review will be, as they tend to be treated as either particle physics or astronomy,” Murphy told Physics World. He adds that astroparticle physics is experiencing rapid growth internationally, offering “tremendous opportunities” for the UK community.
It is still not widely appreciated – even by many scientists and engineers – that the growth of single crystals is the foundation upon which most modern technology is built. Without the work of crystal growers, there would be no electronics industry or computers, very little optical industry and some important gaps in conventional production engineering. Many types of single crystal are, for example, required for lasers, while optical components for spectroscopy and detection, scintillators for nuclear physics, diode light-sources, bearings, gemstones and innumerable other applications also make use of these versatile objects. In A Jewel in the Crown, Donald T J Hurle and Keith G Barraclough describe the inner workings of what was, in its heyday, one of the most important crystal growth laboratories in the world: the Royal Radar Establishment (later the Royal Signals and Radar Establishment, RSRE) in Malvern, UK. The workers at this establishment were responsible for an astonishing list of important discoveries and inventions, but perhaps the most impressive was their successful growth of thin layers of cadmium mercury telluride – a component of far-infrared detectors that is arguably the most intractable crystalline material ever employed in device production. Hurle and Barraclough’s book is concentrated and full of details (both technical and historical), and readers who were involved in crystal growth work during what is often regarded as the “golden era” of 1970–1990 will find it a delight. But the book also has implications that stretch well beyond one field or institution. After a series of amalgamations in the 1990s, the remains of RSRE were eventually floated on the London Stock Exchange as part of a commercial company, QinetiQ. Yet during its years as a state-run organization, the RSRE was both monumentally successful and the driving force behind the creation of successful specialist companies. Politicians who believe they can organize scientific research should consider its history very seriously.
2014 Aspect Design £9.99pb 126pp
How science developed
“To interpret science, we have to know something about its past. We have to continually ask not just ‘What have we discovered?’ but also ‘Why did we look for it?’ ” In The Story of Science, Susan Wise Bauer sets out to answer these questions by analysing some three dozen notable science texts from history, beginning with the Aphorisms of Hippocrates (“the first surviving book of science”) through to James Gleick’s 1987 popular-science book Chaos. In the earliest texts, the science is generally wrong (and sometimes, to quote a New Yorker cartoon, “wrongedy-wrong-wrong”), but despite this, Wise Bauer argues convincingly that scientists as well as historians should be interested in what the authors had to say. Robert Boyle’s treatise The Sceptical Chymist, for example, advocates an erroneous 17th-century theory of matter, yet many of the methods Boyle describes are sound. As Wise Bauer puts it, “its place in history is assured not by its conclusions, but by its procedures; not by the truth it discovers at the end, but by the road it takes to get there”. Sometimes, Wise Bauer demonstrates the continued relevance of old texts by showing how old ways of thinking have endured. The medieval division of the world into animal, vegetable and mineral, for example, influenced the Linnaean system of taxonomy that biologists still use today, and as Wise Bauer points out, it also lives on in the parlour game “20 Questions”. The Story of Science can be read on its own, but for those who wish to use it as a companion book to the original historical texts, the author includes some helpful and practical advice about translations.
One of the great sights of the Bristol area in the UK is the tidal bore on the River Severn – a wave that steepens and grows as the tide advances inland towards the city of Gloucester. Marking the beginning of the incoming tide, this giant wave is pulled up-river by the Moon’s gravity. I like to see the bore at night. As it approaches, the effect of the distant but then growing roar is magical – and there is plenty of light from Gloucester (and from the Moon when it is visible) to watch the bore as it passes by.
We can enjoy the spectacle of the bore, but understanding it raises some questions. Why are there two tides each day – not just one, in the water on the side of the Earth that faces the Moon? Of the more than 700 tides each year, why does a bore on the Severn occur during at most 50 of them, rather than all? And why does the Moon play a role anyway, given that the Sun’s gravity is nearly 200 times stronger?
The fundamental fact is that the force that raises the tide is not simply the gravity from the Moon and the Sun. It would be, if the Earth were held fixed in space by an imaginary cosmic vice. But the solid Earth is not fixed; it moves in an orbit round the Sun, perturbed by a slight wobble caused by the Moon. The tide-raising force is the difference between the force on the water and the force on the solid Earth. And the force attracting the water on the side of the Earth facing the Moon is greater than that on the solid Earth, while the force on the water on the side of the Earth away from the Moon is less than that on the solid Earth (figure 1a).
The tide-raising force therefore points outwards, leading to two tidal bulges on opposite sides of the Earth (figure 1b). As the Earth turns, a given geographical location experiences a bulge twice each day, leading to the two tides. Quantitatively, the tide-raising force is the gradient of the forces from the Sun and Moon: it is therefore an inverse-cube force from each, rather than the familiar inverse-square. And this tide-raising force from the Moon is about twice that from the Sun.
The arrival times and heights of bores cannot be predicted precisely, as these are sensitive to the amount of water already flowing downriver
The half-strength tidal force from the Sun is far from negligible and makes the height of the tides sensitive to astronomical alignments. Tides are stronger when the Sun and Moon are almost in line: at full and new Moon, and when the inclined orbit of the Moon intersects that of the Earth along a line pointing to the Sun. The effect is enhanced when the Moon and Earth are closest to their parent bodies along their elliptical orbits. Unlike eclipses and other astronomical phenomena, the arrival times and heights of bores cannot be predicted precisely, because these are sensitive to the amount of water already flowing downriver. (Don’t therefore be fooled by seemingly precise arrival-time predictions you can find online.) The most impressive bores occur at particularly high tides after a period when there has been no rain for several days.
1 What makes a tidal bore? (a) Water on our planet is pulled more strongly towards the Moon on the side of the Earth facing the Moon than on the side facing away because the latter is further away (red arrows). The lunar pull on the solid Earth lies between these extremes (black arrow). (b) Subtracting the pull on the Earth from the pull on the water leads to net outward forces (purple), which cause twice-daily tidal bulges. As the Earth turns (black arrow), different places experience the tides at different times. (c) The profile of a typical bore flowing along a river at high tide (brown) shown not to scale. At the places where the arrows are, the tide is either rising (flowing in) or ebbing (flowing out). (Courtesy: IOP Publishing)
The familiar tides at the seashore rise and fall gradually, over several hours. (The waves we see breaking on the shore are caused by winds, not tides.) What is different about rivers that host tidal bores – making bores sensitive to geography as well as astronomy – is that they are open to a large ocean and get narrower and shallower over a long distance upstream. The speed of waves on water is limited by the depth: √(gh), where g is the acceleration due to gravity and h the depth. The crest of the tide as it travels upriver gets deeper than the trough, so it travels faster, generating a wave that gets steeper, eventually with a fairly sharp front (figure 1c).
This difference of speeds between the crest and trough is a simple example of nonlinearity – the mathematical phenomenon that underlies all fluid-mechanical analyses of the formation and shape of the bore. But no mathematical treatment has captured the variety of shapes of the bore at different places along the river. The wave can break, tumbling as it crashes against the banks. Elsewhere, the bore advances upstream in a stately procession of smooth waves behind the front; under moonlight, its mirror surface gleams like liquid mercury. Mathematical models emphasize different features, for example as a moving shock wave, smoothed with a few undulations behind.
One question people often ask is whether a bore is a soliton. The answer is no, because a soliton is a wave whose height is the same on both sides of its peak, whereas the arrival of a bore is the beginning of the tide: the water is deeper behind the bore than in front of it. A striking aspect of a bore is that after it passes, as the tide continues to rise for about an hour, the river flows backwards – upstream but downwards. The smooth downstream flow before the bore passes contrasts with the wildly turbulent tide rushing upstream afterwards.
Destination China
The tidal bore on the River Severn is caused by the extraordinary tidal range in the Bristol Channel into which it flows. It is the world’s second highest, and can be as much as 17 m. The associated bore starts about 20 km upstream from the road bridges linking England and Wales at the mouth of the Severn and continues for another 20 km, and its height rarely exceeds 1 m. In the UK there are several other bores – on the rivers Parrett near Bridgwater and Dee near Chester, for example. In France, there used to be a bore on the Seine near Caudebec-en-Caux, le mascaret, but this largely disappeared after extensive dredging in the 1960s. In Brazil, the pororoca is a dramatic bore on the Amazon and some of its tributaries, holding the world record for long-distance surfing: about 12 km.
In September 2014, however, I was privileged to see the world’s largest tidal bore: the “Silver Dragon” near Hangzhou in south-east China, on the Qiantang river, the mouth of which opens out towards Shanghai. My host was Huan-Qiang Zhou, a physicist from Chongqing, a thousand miles to the west, whom I knew through the Journal of Physics A, which is published by the Institute of Physics (along with Physics World). Hangzhou is his home city and Zhou’s generous arrangements involved finding a local “fixer” who booked our hotels and meals, selected prime locations to view the bore, and decided on the best times to do so.
Tidal bores occur roughly twice a day, separated by a gap of 12 hours and 25 minutes. We saw the Silver Dragon six times: by day and by night over three days. It is a major tourist attraction; local media estimated that on the day of the biggest bore, more than 100,000 people lined the banks to watch it, and at prime locations our host had to buy tickets to reach the river bank. I saw no non-Chinese people other than the Australian physicist who accompanied us.
Dramatic sight Huge crowds watch the Silver Dragon bore from the banks of the Qiantang. (Courtesy: Michael Berry)
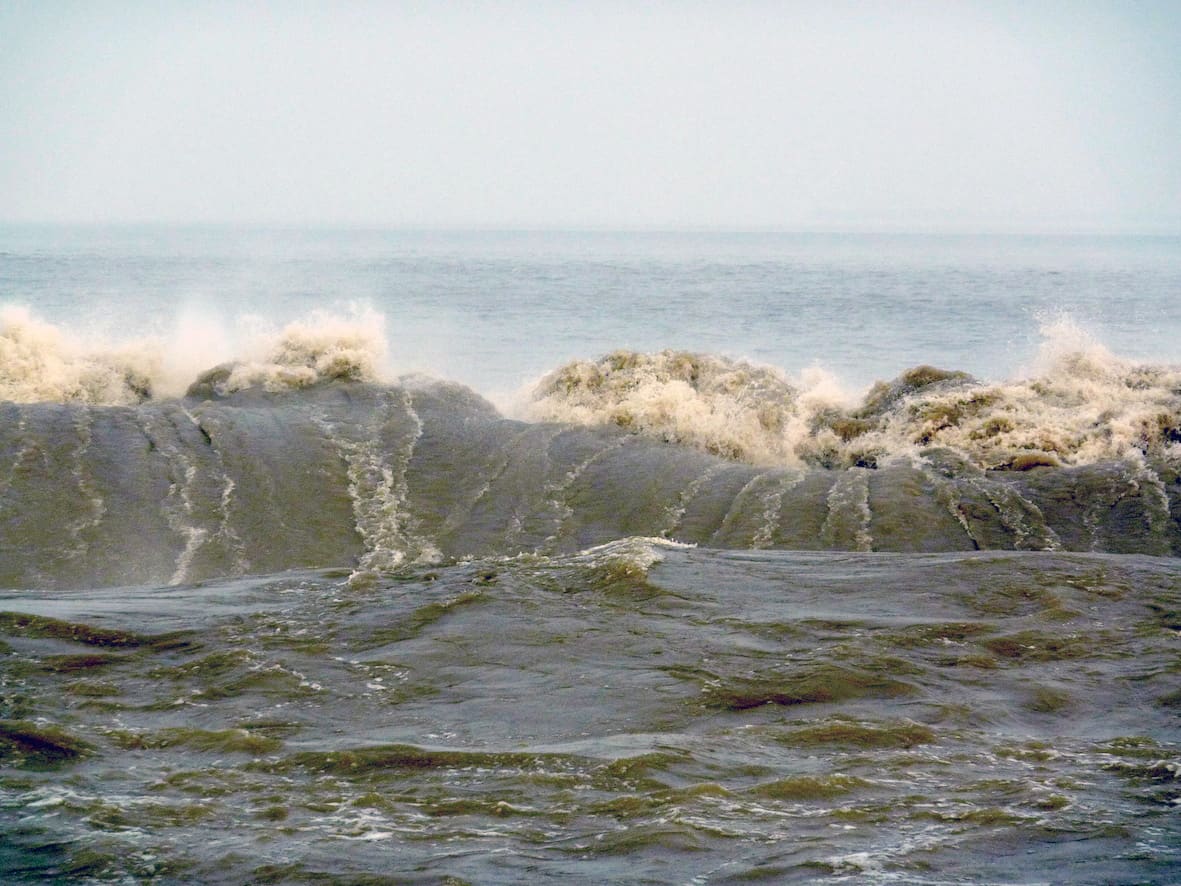
As with the Severn bore, you hear the low roar of the wave before you see it. The Qiantang river is almost 3 km wide, in contrast with the mere 50 m width of the Severn near Gloucester, so the wave is louder, and the roar is audible a full 20 minutes before the bore is glimpsed as a thin white line in the distance. There is great anticipation as the angry wave approaches, before a shout goes up as it rushes by. At night, there were fewer people watching the Qiantang bore and, because of the way sound refracts differently when the ground is colder, its roar could be heard even earlier.
Several long walls jut out perpendicular to the river bank. Standing on one of them, we saw the wave approach head-on, crash into the wall and then reflect. This reflected wave was an awesome sight, hugely amplified as it receded and interfered coherently with the still-advancing tide. The Severn bore can be reflected too, after it hits the weir upstream from Maisemore, which is usually the limit of its journey. Standing on Maisemore Bridge, I once saw a tiny reflection, a few centimetres high, several minutes after the bore had passed.
The bore moves up the Qiantang river at speeds varying between 10 km/h and 20 km/h. On the last night, we chased it for tens of kilometres, following it by car until 3 a.m. The fixer chose a final viewing location where the bore crashed against another wall. As we parked, seconds before the bore arrived, police rushed alongside on motorcycles, screaming at us to shift our car, and ourselves, several tens of metres away. With my mistrust of authority, I thought they were being unnecessarily officious. But they were right, because the reflected wave smashed through the protective chain-link fence, and would have drenched us and the car, probably knocking us over.
Rarer than rare You have to get up close to see details such as reflection. (Courtesy: Michael Berry)
With the interval of 12 hours and 25 minutes between bores, and long drives between viewings in several different places, our sleep patterns were disrupted, leaving us permanently exhausted. Our discomfort was somewhat alleviated by the luxurious hotels chosen by the fixer. One deserves mention as an attraction in itself: the Ningbo Hiatian Yizhou Hotel, which is spectacularly located on the Qiantang river as it opens out into its estuary. The building lies in the middle of a bridge spanning the river, claimed to be the world’s longest over clear water – nearly 40 km.
Experiencing unification
A primary aim of physics is to unify the different fundamental forces. A giant step in this direction was Maxwell’s unification of electricity, magnetism and light, in his electromagnetic theory that now underpins our communications technology. The effort continues, with attempts to unify gravity with the strong and electroweak interactions that act on microscopic scales. But we should not forget the first unification, which was Isaac Newton’s discovery that the force that holds us to the ground, the force that keeps the Moon in its orbit, and the force that drives the tides, is in fact one force: gravity.
Witnessing a tidal bore, we experience this unification directly.
Nobody doubts that optical fibres are an incredibly useful technology, particularly when it comes to transporting information over large distances with little attenuation. But in this 100 Second Science film, Jonathan Knight points out some of the limitations of the conventional optical fibres available on the market today.
An optics researcher at the University of Bath in the UK, Knight is developing new forms of optical fibre where the light is guided in air or vacuum, rather than being reflected off the walls of a glass tube within the inner part of the fibre. As he explains in the film, these fibres could be used in specific applications, such as medical surgery, that require light to be delivered at unusual wavelengths.
To find out more about the latest light-related research, take a look at the Physics World Focus on Optics & Photonics. This free-to-read issue includes a special feature about the vital role that optics and photonics play in the UK’s new £270m Quantum Technologies Programme.
With 2015 being the International Year of Light (IYL 2015) we have also produced a special edition of Physics World in March devoted to light and its varied applications in our lives. If you’re a member of the Institute of Physics (IOP), you can get immediate access to the special issue about “light in our lives” with the digital edition of the magazine on your desktop via MyIOP.org or on any iOS or Android smartphone or tablet via the Physics World app, available from the App Store and Google Play. If you’re not yet in the IOP, you can join as an IOPimember for just £15, €20 or $25 a year to get full digital access to Physics World
New technology uses computational techniques to more clearly see individual rods and cones, the cells that detect light in the back of the eye. (Courtesy: Alex Jerez Roman)
A new computer algorithm, to correct optical aberrations that appear while imaging the back of the eye, has been demonstrated by researchers in the US. The team’s method should allow the benefits of adaptive optics, more commonly used in astronomy, to be brought more readily into clinics. It does not need expensive optical hardware and, according to the researchers, could help diagnose degenerative eye and neurological diseases earlier, making their treatment more successful.
Optical coherence tomography is an interferometry-based medical imaging technique analogous to ultrasound imaging, but using light instead of sound. It is the standard of care for diagnosing and monitoring a number of medical conditions such as age-related macular degeneration, in which the tissue underneath the retina begins to thicken, leading to nutrient starvation and eventual death of photoreceptors.
Reduced resolution
However, light used to image the retina has to pass through a patient’s eye, and imperfections specific to each patient create aberrations in the image, thereby reducing the resolution until it is impossible to image individual receptors and researchers have to infer the microscopic progress of a disease from macroscopic details. In adaptive optics – first developed for removing the distortions introduced into astronomical images by the atmosphere – the distortion of the reflected wavefronts is measured by a wavefront sensor, and a mirror is constantly deformed to correct for these.
These corrections can improve the image resolution dramatically, but the sophisticated optical hardware required slows down the imaging speed and adds considerably to the cost, nearly doubling it. Also, tiny involuntary eye movements can alter the phase of the incoming waves and blur interferometric images, making it difficult to identify optical aberrations for correction.
Stephen Boppart and colleagues at the University of Illinois at Urbana-Champaign, as well as competing researchers, have in recent years produced several papers on so-called “computational adaptive optics”, in which these corrections are applied by image-processing software rather than optical hardware. In their new research, they unveil a multi-stage algorithm for enhancing retinal images that can be run on the graphics card of a high-end desktop computer, and use it to probe the retina with unprecedented detail for images made without adaptive optics.
Fixing imperfections
First, they correct the phase, allowing them to clearly identify the optical aberrations. Second, an electronic technique to identify and correct large bulk aberrations reveals a few obvious photoreceptors, which appear blurred. Finally, the algorithm calculates the detailed corrections needed to display these correctly and applies these to the image. In astronomical adaptive optics, stars are sometimes used to guide these corrections.
The researchers imaged the eye of a volunteer, looking at an area near the centre of the retina called the fovea. They produced extremely detailed images showing, for example, the decreasing density of photoreceptors as the distance from the fovea becomes greater. “We agree that, given the images we’ve seen from the hardware [adaptive optics] systems, our computational approaches are equivalent to those,” says Boppart, “In addition, we think we could do better by correcting the finer aberrations and by being able to manipulate the data post-acquisition, which gives us a lot more flexibility.”
Pablo Artal of the University of Madrid describes the research as “impressive” and the images obtained as “beautiful”. He remains sceptical, however, both about the researchers’ estimates of the cost of integrating adaptive optics into a properly developed commercial system and about the effectiveness of software to substitute them, especially in more complex cases in which noise presents more problems, although he agrees this warrants further study. In any case, he says, there may be many cases in which image processing is “good enough, and in that case this can have a lot of value”. A more interesting application, he says, may lie in combining the two methods to obtain even better image quality than either would achieve alone.
Boppart’s research is now focused in just this direction. “We’re going to integrate hardware adaptive optics with our computational system,” he says, “and really do that direct comparison to see if computation can completely replace hardware or if there’s some synergy in having both present.” The team also wants to use the system to obtain images of nerve fibres in the eye, as the collapse of the myelin sheath can be a key indicator of multiple sclerosis.