
Scientists reveal how a sea sponge gets its remarkable strength

The clever design underlying the remarkable strength of a sea sponge’s anchoring fibres has been unravelled by scientists in the US. The team found that the strength of a fibre comes from the particular way that it is made from about 25 concentric silica cylinders. The researchers believe that this natural design could be copied to make strong artificial materials for use in larger structures such as buildings and aeroplanes.

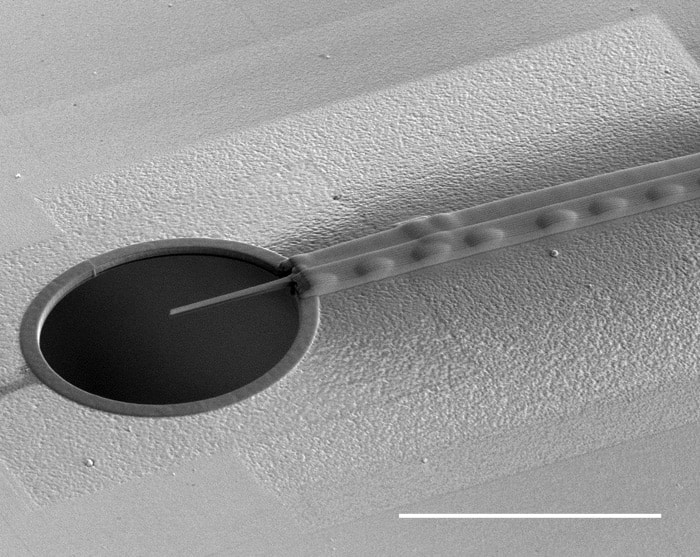
Found in deep waters in the western Pacific Ocean, the 20–35 cm-long sea sponge Euplectella aspergillum is commonly known as Venus’s flower basket. The skeleton of the sponge is attached firmly to the sea floor by thousands of glassy silica spicules. Each spicule is about 10 cm long and covered in backward-facing barbs. Despite being no thicker than a human hair, each spicule has a remarkable load capacity, and can transmit significant forces from the anchoring barbs to the rest of the sponge’s skeletal structure.

Optimized by nature

Each spicule comprises a silica core that is surrounded by 10–50 concentric silica cylinders, each separated by a thin layer of organic material. Mechanical engineer Haneesh Kesari and colleagues at Brown University and Harvard University were keen to discover whether a spicule’s great strength is related to the specific arrangement of the cylinders and core – in other words, had nature optimized the structure to make it very strong?

To answer this question, the researchers developed a mathematical model of the internal structure of a spicule. They assumed that the organic layers are there to allow the individual cylinders to slide past each other, and that each cylinder’s strength was the same. From their model, they explored various configurations of layer thicknesses, to find the structure that would result in the maximum load capacity.

Scanning electron micrograph of a spicule showing concentric rings of silica that become thinner towards the outside of the structure

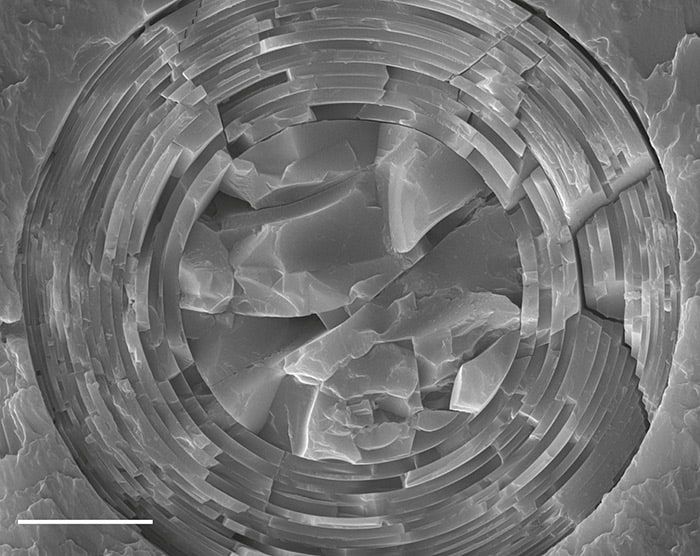
The model suggests that the optimal structure comprises cylinders with thicknesses that decrease towards the outside of the spicule, which is exactly what is seen in real-life sponges. Furthermore, a comparison between the thicknesses of the layers in the model’s optimal design and more than a hundred real spicules reveal a close similarity.

Stress redistribution

The researchers believe that this arrangement of layers redistributes internal stresses across the spicule’s cross-section – rather than concentrating stresses around the outer regions, as would occur in a simple solid fibre. As a result, a layered fibre can transmit a larger load before it fails. According to the researchers’ model, a spicule with around 25 concentric layers gains a 23% increase in load capacity over a similarly sized solid spicule.

Desislava Bacheva – an aerospace engineer at the University Bristol – calls the model “well developed” and commends the researchers for their contribution to understanding the strength-enhancing role of the spicules’ internal architecture. The problem of understanding the spicules’ design is very complex, Bacheva notes, adding that she would like to see further investigation of the material’s actual behaviour, as well as the merger of material and structure at several length scales.

“The results of the researchers’ model correlated remarkably well,” says Hermann Ehrlich, a biomineralogy expert at the Technische Universität Bergakademie Freiberg, Germany. “This work highlights the beneficial nature of the elastically heterogeneous lamellar design strategy, developed over more than 600 million years of glass-sponge evolution,” he adds.

Precise mechanical testing

With their initial study complete, Kesari and colleagues are continuing their investigation of the interior design of spicules. They are currently using custom-built devices to undertake precise mechanical tests on individual spicules at the micron scale. They are also doing additional modelling using large-scale computer simulations, with the aim of better understanding how layered architecture can add to material stiffness and toughness.

Kesari believes that it could be possible to create larger, artificial materials with similarly robust properties. “The impact and applications of scaled-up structures that are based on the principles that we learned from these spicules could be huge, affecting civil infrastructure, aviation and a number of other industries,” he says.

“In the engineered world, you see all kinds of instances where the external geometry of a structure is modified to enhance its specific strength,” adds team member Michael Monn, “but you don’t see a huge effort focused on the internal mechanical design of the structures.”

The research is described in the Proceedings of the National Academy of Sciences.

Night visions, the sky 10 billion years ago and unexplained sounds from around the world

View from an Earth-like planet 10 million years ago

This week’s Red Folder is inspired by a vision I had last night while I was putting out the garbage bins. I happened to look up at the sky just as the International Space Station (ISS) was travelling over Bristol. It was a very bright and impressive sight as it zipped overhead before disappearing at the eastern horizon. If you happen to be on an arc through northern Europe between Penzance and Poznań, you should also have a great view of the ISS this evening; you can find out when and where to look at the ISS Astroviewer website.

The ISS is one thing that you would definitely not see if you could look at the sky as it was 10 billion years ago – but have you ever wondered what that view would be? Zolt Levay at the Hubble Heritage Information Center has, and the above image is his vision of what the sky would look like from a hypothetical planet within a Milky Way-like galaxy 10 billion years ago. The work was inspired by a new collection of nearly 2000 images of galaxies as they appeared at that time in the history of the universe. Taken by a number of different telescopes including Hubble, “the new census provides the most complete picture yet of how galaxies like the Milky Way grew over the past 10 billion years into today’s majestic spiral galaxies”, according to NASA.

(more…)

Dark matter and muons are ruled out as DAMA signal source

A controversial and unconfirmed observation of dark matter made by the DAMA group in Italy may have an even stranger source than previously thought, according to physicists in the UK. Their research suggests that the signal seen by DAMA is neither from dark matter nor from background radiation. Instead, they say that the signal could be the result of a fault in the DAMA detector’s data-collecting apparatus.

Starting in 1998, the DAMA-LIBRA experiment – nestled deep underground at the Gran Sasso National Laboratory in Italy – has reported an annual oscillation in the signal from its dark-matter detector. Some physicists believe that this variation is the first direct detection of dark matter and is a result of the Earth moving throughout the galaxy’s halo of dark matter. Further data collected by the collaboration over the past 17 years has given the measurement a statistical significance at 9.3σ – well beyond the 5σ that usually signifies a discovery in particle physics. But apart from the CoGENT dark-matter experiment in the US, no other dark-matter searches across the globe have detected a similar effect, calling the claim of the first direct detection of dark matter into question.

Mimicking muons?

Last year, physicist Jonathan Davis, who was then at Durham University in the UK and is now at the Institut d’Astrophysique de Paris in France, developed a new model to explain the signal, suggesting that neutrons scattering in the detector could easily mimic the annual signal. According to Davis, these neutrons would be released when solar neutrinos and atmospheric muons scatter in the shielding material or the rock that envelops the experimental set-up. He pointed out that the rate of muons from cosmic rays decaying in the atmosphere varies across the year, peaking around 21 June; while the rate of solar neutrinos, which also varies annually, peaks around 4 January. Taken in conjunction, neutrons from both of these sources also have a rate that varies annually but peaks somewhere in between the two and can match the DAMA peak, which occurs in late May. While the idea of muons mimicking the DAMA signal is not new, the timing of muons in isolation does not match the DAMA data, and so the idea was previously dismissed. Davis’s model solved this problem by adding the effect of solar neutrinos.

Now, Vitaly Kudryavtsev and Joel Klinger from the University of Sheffield in the UK have, for the first time, carried out the complete 3D modelling of muons and muon-induced neutrons at DAMA, taking into consideration the Gran Sasso mountain profile and the detector configuration, including all of the layers of its shielding. Kudryavtsev, who has been working in dark-matter searches for many years and has been involved in designing upcoming projects such as the LUX-ZEPLIN, told physicsworld.com that he and Klinger are well placed to carry out a full assessment of the background radiation in the NaI detectors used by DAMA. This has allowed them to establish unambiguously whether the modulated rate of events observed could arise out of any kind of background radiation. The researchers say that their results show conclusively that such a neutron flux induced by muons at Gran Sasso is too low by several orders of magnitude to mimic the DAMA modulation.

Minimal effect

Kudryavtsev says that while the DAMA collaboration itself has provided estimates of various backgrounds in their papers, no full modelling of the muon-induced background has been done so far. Davis’s paper from last year also only provides a rough model, which was already refuted by another team of researchers last November, who said that the real effect of muon-induced neutrons and neutrino-induced neutrons is well below Davis’s estimates and the DAMA signal.

Kudryavtsev and Klinger’s results also agree, and indeed the two results taken together “indicate that it is very difficult to build any model to explain the DAMA signal. This conclusion is based on the analysis of the energy spectrum of events as measured by DAMA and calculated from [background] radioactivity”, says Kudryavtsev. “The measured spectrum can be fitted reasonably well with the [background] radioactivity model leaving very little room to any additional signal, whether from dark matter, background or any instrumental effect,” he adds.

Notoriously complicated

Davis has responded to the claims, saying that while the software package – which the duo has used to simulate how the neutrons get from where they are first produced, in the rock or shielding around the detector, to the detector itself – is commonly used in the community, such simulations are “notoriously complicated”. Davis says that the current dark-matter models, which explain DAMA, are quite complicated and unnatural, so it is getting to the point where mundane models are the only option. “My opinion is that people are not currently creative enough with these models. The way these neutrons actually interact in the DAMA detector is not well understood, although this itself is a contentious issue, which some will disagree with. In these simulations the neutrons will just scatter in the DAMA detector, but it’s possible that there are further interactions such as neutron capture (followed by the emission of a photon), which some have suggested in the past can enhance the rate of neutron events by a large factor. Essentially, things are not as well-understood as they appear,” says Davis.

Davis also says that a key point in his paper is that “since the DAMA detector can’t distinguish what is causing its scattering events, one doesn’t really know what the events are. I suggested neutrons as a simple plausible model and somewhere to start off, but there are lots of alternatives”. He says that the neutrons could be captured rather than scattered in the DAMA detector, or there could be another temperature-related source for the signal or it could even be something scattering with the electrons in DAMA instead of nuclei.

Basic requirements

“We do not think it is fruitful to discuss the period or phase of modulation of a background source without also discussing the amplitude of this source. There may be several potential sources of modulated signals and this is, of course, a disadvantage of the technique used by DAMA,” says Kudryavtsev. He explains that all of the experiments currently at the forefront of dark-matter research “rely on a powerful discrimination between potential signal and backgrounds. DAMA does not have this option, and measures the total event rate and its time variations. However, any model that claims to explain the DAMA signal should be consistent with the measured amplitude of the signal”. In addition, the duo says that such a model should satisfy some other requirements – that the amplitude of the effect must be very small compared with the DAMA event rate, that the modulation amplitude of the effect must not be much smaller than the average amplitude of the effect, and that the phase and period of the modulation must be predicted simultaneously.

“In particular, any signal summed with the predicted radioactive background should give the measured rate for all energies of interest. At the moment we are not aware of any model for an observed modulated signal that would satisfy these requirements,” says Kudryavtsev. “Bear in mind that we know quite a lot about radioactivity and muons…certainly much more than we know about dark matter…and so any explanation of the DAMA signal will be very difficult, if we fully trust the statements made by DAMA about full control of temperature variations etc.”

While Kudryavtsev and Klinger’s model does not provide a plausible explanation of the DAMA signal, the pair are clear on the fact that they do not think it arises from dark matter either, because other experiments have already excluded this possibility and in any case the dark-matter signal is difficult to fit into the measured rate. “We believe that it is very difficult to explain the DAMA signal by any model, whether this is dark matter or a background. There is simply not much room in the measured event rate to accommodate the reasonably well-known radioactive background and the signal,” says Kudryavtsev, adding that it may be “an artificial effect caused by the rejection of photomultiplier tube noise as implemented in the data analysis by DAMA. If the cut used to separate noise from real events somehow varies with time, then more events may be accepted as real events during certain periods, causing modulation in the event rate. This is, of course, just another speculation, and there is no proof of this being happening in the data analysis.”

Davis himself believes that our best hope of understanding the DAMA modulation is other experiments, like the upcoming DM-Ice, which are looking to replicate DAMA. “Fundamentally, we can simulate all we like, but what we really need is more data,” he says.

A preprint of the work is available on the arXiv server.

Where is the coldest experiment on Earth?

California might be suffering a punishing drought, but a tiny corner of the Golden State is now the coldest place on Earth. This tiny super-cold patch was created at Stanford University by Mark Kasevich and colleagues, who have used “matter-wave lensing” to cool a cloud of about 100,000 rubidium atoms to less than 50 pK. That is just 50 × 10–12 degrees kelvin above absolute zero.

The temperature of a cloud of atoms is defined by the average velocity of the atoms as they drift about. Kasevich’s team used a series of lenses to reduce this average motion to less than 70 µm/s, which corresponds to 50 pK. This shatters the previous record of 1 nK for matter-wave lensing and represents “record-low kinetic temperatures” according to Physical Review Letters, where the research is described.

(more…)

Fostering talent

How do we select a cohort of promising scientists before they have made their discoveries? This is a fundamental challenge for academic planning, where even prestigious universities are plagued by “duds” or poor faculty hirings – those researchers who were labelled as geniuses with great promise when first employed but who, in retrospect, decades later, had little impact on science. Meanwhile, their contemporaries, who were not endorsed by prominent scientists and so moved to faculty positions at lesser schools, carried the day. Without mentioning names, this is a familiar occurrence, but why is it so prevalent?

Senior scientists who serve on promotion, prize or search committees are often asked to evaluate the promise of their younger colleagues. One would naively expect them to approach this challenge in the same way that they would address a scientific problem, namely by studying all the available data and constructing a model that extrapolates into the future. In order to avoid biases, it would appear natural to adopt a “dynamical” model that considers the special initial conditions of an individual and allows for growth in forecasting that person’s future. For example, a young researcher who did not benefit from being nurtured by top-quality mentors, or who came from a different culture or poorer background, should be given more slack. This is common sense, but is it common practice?

My experience over the past three decades suggests otherwise. Young scientists are commonly assigned “static” labels without proper attention being given to their starting point or the growth of their career trajectory. Early-career evaluations reflect a frozen snapshot of achievements: for example, due to a frozen image of their qualifications when they graduated, it is common for science departments to underappreciate a faculty position applicant who graduated many years ago from the same department. These mistakes have serious consequences, as poor recruitments lead to drifts in the prestige of academic institutions. To make things worse, evaluators who picked a poor candidate often resist adjusting the opinion of the individual later on out of fear that admitting the need to do so would reflect an initial lack of foresight. Insisting on a static image that is out of sync with the growth of a successful researcher often leads to persistent attempts to shape reality to justify the preconception.

The inconvenient truth is that evaluators with preconceptions have the power to allocate resources to justify their original static images. When serving on prize committees, for example, they can reward those whom they originally supported. But when serving on grant allocation committees, they can block support for others, even in the face of evidence that contradicts their early impressions. Such action leads to self-fulfilling prophecies and can occasionally crash the rising career of brilliant individuals who were not recognized as such earlier on in their career.

Aiming for diversity

The above faults are sometimes driven by the misconception that scientific success is largely down to raw talent, which would be evident in any early snapshot of an individual. After all, Albert Einstein showed brilliance at a very young age. But this presumes a static view of science itself, while in reality the landscape of science has evolved dramatically over the century since Einstein’s day. Today, scientific information changes constantly and there are many more scientists around. In this climate, success is often linked to acquired skills, such as being able to adjust to rapidly changing intellectual landscapes – for example, big data – and to identify the right problem to work on while others are still searching in the dark. Today’s science also requires good “soft” skills, such as the ability to lead other scientists and to communicate results so that they promote progress. These skills take time to develop, so any model that attempts to forecast success reliably needs to include evolution and refrain from static images.

Yet it sometimes seems that the guiding principles are completely off target. One obstacle to an honest evaluation process is that prominent scientists often seek to promote their own research programme in an effort to link it permanently to the mainstream. This tendency takes the form of senior scientists promoting their own students or group members well beyond what may count as fair play, which in the process suppresses independent thinking. Put simply, senior scientists too often measure success by how much a younger colleague replicates their own research agenda or set of skills. For example, if they are fluent with mathematical subtleties, they will identify success with mathematical skills. In faculty recruitment, this tendency for self-replication is dangerous because it might not stop at academic qualifications, but could easily spill over to an unconscious bias based on the replication of one’s own gender, race or ethnicity.

There are multiple paths to success in science. Some paths are mathematical and quantitative while others are qualitative and require conceptual vision. Rather than replicating ourselves and preserving a static past, to secure a vibrant future we should aim for diversity and promote scientists of all varieties. Anyone serving on committees should resist static images of our younger colleagues and replace them with dynamical models by paying special attention to initial conditions and embracing evolution in our assessments. To cultivate innovation, we should always encourage creativity beyond the comfort limits that we establish for ourselves. To give an analogy, keeping a wide variety of matches in our matchbox will guarantee that not all of them will be duds. Hopefully, a few will light up in the dark to guide us how to move forward.

Diamond cavity boosts magnetic-field detection

A new type of magnetometer based on diamond impurities has been unveiled by physicists in the US. The device is about 1000 times more sensitive than previous diamond-based sensors because it uses an optical cavity to concentrate laser light in the vicinity of the impurities. Although the new device cannot yet reach the sensitivity of some other types of magnetometers, the physicists believe that it offers significant practical advantages that will be useful to researchers in many fields, including those studying magnetic signals from the heart and brain.

The most precise magnetometers available today are superconducting quantum interference devices (SQUIDs) and atomic magnetometers, both of which can measure magnetic fields in the femtotesla range. However, the most sensitive SQUIDs must be operated at temperatures near absolute zero and atomic magnetometers need expensive and unwieldy vacuum and field-nulling systems. Sensors based on diamond impurities have the potential to be much more user-friendly because they use robust pieces of diamond and work at ambient pressures and temperatures. The devices make use of nitrogen vacancy (NV) centres, which occur when two adjacent carbon atoms in a diamond lattice are replaced by a nitrogen atom and a lattice vacancy. NV centres emit red light when excited by green light and the wavelength of this emitted light is shifted by the presence of an external magnetic field. Magnetic-field strength can be determined by measuring this shift and NV centres offer the added bonus of also being sensitive to small variations in relatively high fields.

Huge diamonds needed

Making a practical sensor remains a challenge, however, because NV centres are very weak absorbers of light. This means that the green light would need to travel about 1 m through a diamond to create enough red light to make a meaningful measurement. This distance could be decreased by using a diamond with a very high density of NV centres, but this would result in lower precision because the NV centres would interfere with each other.

Producing a 1 m-long diamond would be both difficult and expensive, so Dirk Englund and colleagues at the Massachusetts Institute of Technology took a different approach by having the green light bounce back and forth many times through a much smaller diamond. Their first attempt involved attaching special mirrors to the sides of a diamond to create an optical cavity. “We tried for close to a year and a half unsuccessfully,” says Englund. “We also realized that, even if we did make such a cavity, it’s relatively difficult to lock a laser to it – you’d have to have a specialized laser stabilized on a very narrow frequency.”

Sparkling reflections

After this setback, the team realized that the diamond itself could act as the cavity. Diamonds are prized by jewellers precisely because they have a high refractive index, which causes light to bounce around inside them by total internal reflection and makes them sparkle. By injecting green light into a faceted edge of the diamond at a well-chosen angle, the researchers could make the light travel up to 1 m inside a diamond just 3 mm in length – with almost all the green light being absorbed along the way. As a result, a simple diode laser the size of a fingernail can be used to supply the green light. “It’s quite possible we should have thought of it first,” jokes Englund.

The researchers used their device to measure magnetic fields that varied at a frequency of 1 Hz and achieved a sensitivity of a few picotesla – about three orders of magnitude less sensitive than the best SQUIDs. The team is now looking at how to improve the sensitivity further by collecting the emitted light more efficiently. “There are definitely a few orders of magnitude to go,” says Englund. At current or slightly improved sensitivity, the device could be useful for investigating the electrical activity of the heart or brain.

“The NV centre is a relatively new area that’s only been around for five or 10 years,” says Mike Romalis of Princeton University in New Jersey. He adds that Englund’s sensor is interesting because it is somewhat more practical than other NV devices and also because it works with low-frequency magnetic signals where a lot of practical magnetic fields exist. The absolute accuracy of the sensors is currently below that of atomic magnetometers of similar size, he says, but their ability to operate at ambient conditions is a big advantage for investigating living tissues.

The research is published in Nature Physics.

Amazing science demo two: Newton’s Three Laws Cannon

This is the second in a series of “five amazing physics demonstrations” presented by science-demo guru Neil Downie. In addition to his day job in industrial science, Downie has run Saturday science clubs for children for more than two decades, during which he creates fun and innovative science demonstrations that are all simple and quick to carry out.

In a special feature in the April issue of Physics World, Downie describes his five best demos of all time, all of which use everyday equipment to illustrate fundamental physics concepts. In the article, Downie describes how his fondness for the five experiments comes from the fact that, with a bit of creativity, each one can be easily adapted to explore physical concepts further. In the digital edition of the April issue, each demonstration is accompanied by a video in which Downie walks you through how you would present each demonstration to an audience. Full details of how to access the digital edition are available at the bottom of this article.

This second demo from the series is “Newton’s Three Laws Cannon”, in which Downie manages to show all three of Newton’s laws in action. Students of all ages are bound to love this one, as you’re creating a projectile launcher that creates a satisfying “Pop”. In addition to illustrating Newton’s laws in dramatic fashion, the demo can also be developed to discuss other physics concepts such as momentum conservation, air pressure and energy in compressed gas.

Newton’s three laws cannon

So what’s this all about? This project involves using compressed gas, stored in a plastic soda bottle, as the power source to accelerate two projectiles in opposite directions along a pipe and out through the two ends. The projectiles can be lumps of carrot or champagne corks weighted with a little modelling clay on their noses. This project is a beautiful way of illustrating all three of Newton’s laws of motion in one go.

What bits and pieces do I need? You need two lengths of 34 mm-diameter plastic plumbing tubes joined end-to-end with a T-piece in the middle. The soda bottle has to be adapted by fitting a one-way car-tyre valve into its base. The valve lets you pump air into the bottle without it coming out. You’ll then need to make a large hole in the bottle’s screw cap and stick a piece of tape over the top of the open bottle, before screwing the cap back on. You’ll also have to drill a small hole in the T-piece so that after you’ve fitted the bottle to it, you can get to the tape in order to pierce it with a pin, releasing the compressed air from the bottle into the pipe. Now arrange two large cardboard boxes – stuffed with screwed-up paper or packing material – facing the two free ends of the pipes. When the projectiles fire out of the cannon, they’ll therefore end up somewhere safe.

How do I get going? Using a bike- or car-pump, start pumping air into the soda bottle until it reaches a pressure of 4–5 bar. Then plug the bottle into the T-piece, fixing it into position with tape. Next, use a retort stand and clamp to hold the two pipes, T-piece and bottle in place. Finally, place your two projectiles in the opposite ends of the pipe before pushing each of them right down to the T-piece with a stick. Now don your safety goggles, pierce the tape with, say, a pin – and boom! With luck, the two projectiles will simultaneously whizz out and blast into the stuffed cardboard boxes, but the cannon itself will not move much. If you repeat the experiment with only a single projectile and the other end of the pipe blocked, the cannon and stand will recoil backwards.

And what physics will I learn? The fact that the cannon does not recoil when you fire two equal-mass projectiles shows that for every action there is an equal and opposite reaction, which is Newton’s third law. The projectiles get accelerated thanks to a force derived from gas pressure – Newton’s second law. Once they leave the muzzle, the projectiles both fly out at pretty much a constant speed, which is Newton’s first law.

  • If you’re a member of the Institute of Physics (IOP), you can now enjoy immediate access to the April issue of Physics World with the digital edition of the magazine

Mysterious baryon resonance is a subatomic molecule, say physicists

Physicists in Australia have produced further evidence that an excited state of the lambda baryon is a “subatomic molecule” – a meson and a nucleon that are bound together. While the physicists are not the first to suggest this exotic structure, they have done new computer simulations and calculations that they say “strongly suggest” that the lambda baryon can exist in this exotic configuration.

The lambda baryon (Λ) has no electrical charge and comprises three quarks (up, down and strange). Its discovery in 1950 by physicists at the University of Melbourne played an important role in the development of the quark model of matter and ultimately quantum chromodynamics (QCD), which is the theory of the strong interaction that binds quarks together in baryons and mesons.

Λ is a composite particle, and therefore it exists in a number of different energy states, much like an atom. Λ is the lowest-energy state and Λ(1405), which was discovered in 1961, is the lowest-lying excited state or resonance. As physicists developed the quark model in the 1960s, it became apparent that there was something not quite right about Λ(1405). In particular, the energy difference between Λ and Λ(1405) is much lower than expected, if Λ(1405) is assumed to be a “single particle” containing just three quarks.

Growing evidence

In the 1960s the Australian physicist Richard Dalitz and colleagues suggested that that Λ(1405) could comprise an anti-kaon meson bound to a nucleon (proton or neutron). This can occur in two ways: a negatively charged anti-kaon bound to a proton, or a neutral anti-kaon bound to a neutron. Working out the structure of Λ(1405) – or any baryon resonance for that matter – is extremely difficult because of the nonlinear nature of the strong interaction. However, over the past two decades theoretical support for molecular Λ(1405) has grown, with calculations done by several groups of physicists backing up the idea.

Now, Ross Young and colleagues at the University of Adelaide and the Australian National University have used lattice QCD to gain further insights into the nature of Λ(1405). The team used a lattice QCD simulation that was first developed by the Japan-based PACS-CS collaboration. The most important result of the team’s calculation is that the strange quark appears to make no contribution to the magnetic moment of Λ(1405). This is expected if the strange quark is confined within an anti-kaon with zero spin and is consistent with a molecular model of Λ(1405).

Energy levels

The team also analysed the energy levels calculated by lattice QCD and concluded that the Λ(1405) resonance is dominated by the anti-kaon nucleon molecule with a much smaller contribution from the single-particle three-quark state (up, down, strange).

José Antonio Oller of the University of Murcia in Spain calls the calculation of the strange quark’s magnetic contribution a “remarkable result”. However, he points out that while this zero magnetic contribution is a necessary condition for molecular Λ(1405), it is not sufficient to confirm the molecular nature of the resonance. He added that further calculations of the properties of Λ(1405) using other techniques are needed before the issue can be settled.

The calculations are described in Physical Review Letters.

Crystal-handedness revealed by twisted electron beams

Twisted beams of electrons have been used for the first time to determine the handedness, or “chirality”, of an ultrathin crystal. The new technique, which uses a transmission electron microscope (TEM), has been developed by physicists at the University of Antwerp in Belgium. Their method has been shown to work on samples just 20 nm thick, and the researchers believe that it could be adapted to reveal the chirality of nanoparticles or even single molecules.

Chiral molecules come in two versions called enantiomers, which are mirror images of each other. They have identical atomic compositions but cannot be rotated or otherwise manipulated to have exactly the same structures – in the same way that a person’s right hand can never be the same as their left. Chirality can have a significant effect on the chemical and biological properties of some molecules, making it a measurement of particular interest to those developing new pharmaceutical compounds.

The chirality of molecules in a relatively large sample can be measured by passing polarized light through it. If the sample contains equal numbers of right- and left-handed molecules, the polarization will not change. However, if there is more of one enantiomer than the other, the polarization will be rotated. The problem is that the interaction is inherently weak, and so does not work with very small samples – particularly nanoparticles and single molecules that are much smaller than the wavelength of the light used.

Twisting wavefronts

A beam of electrons, on the other hand, interacts very strongly with tiny samples, and could offer a way forward. In the new work, Jo Verbeeck performed extensive calculations that showed that, in principle, twisted or “vortex” electron beams can be used to measure chirality. Unlike the beam from a conventional TEM, which can be thought of as a simple plane wave, the wavefront of a vortex beam rotates about its axis of propagation and traces out a spiral. A vortex beam can, therefore, twist in a clockwise (left-handed) or anticlockwise direction, and it is this handedness that makes it particularly sensitive to chirality.

Electron micrograph showing the magnetized needle mounted on an aperture

To test their predictions, Verbeeck and colleagues modified their TEM by adding a tiny aperture containing the tip of a long and extremely thin magnetized needle. As the electrons interact only with one pole of the magnet, they behave as if they were interacting with a magnetic monopole, which puts the 300 keV electron beam into a vortex state.

The team used its vortex beams to obtain a series of diffraction patterns from a 20 nm-thick sample of manganous antimonate (Mn2Sb2O7), which is a chiral crystal. Five patterns were recorded with a vortex beam rotating in one direction, followed by five patterns using a beam rotating in the opposite sense. Each diffraction pattern was seen to depend on the vorticity of the beam, which allowed the chirality of the sample to be determined by simply comparing the diffraction patterns.

Symmetry breaking

Verbeeck points out that the chirality of a crystal cannot be determined using a conventional beam of electrons because of Friedel’s law, which imposes inversion symmetry on the diffraction pattern. Although chirality does show up in diffraction patterns that are formed when the electrons scatter lots of times in the sample, Verbeeck points out that this kind of multiple scattering rarely occurs in very thin samples, making the vortex-beam method more practical.

However, Verbeeck does admit that several challenges must be overcome before the technique can be used to study single molecules. One is that – unlike the Mn2Sb2O7 crystal – many single molecules would be blown to pieces by the electron beam before the diffraction patterns can be obtained. One way round this, according to Verbeeck, is to make the measurements very quickly.

Another challenge is related to the fact that the technique involves orienting the crystal structure of the sample in a very precise direction with respect to the electron beam. While this is relatively easy to do with a large crystal, it is much harder for nanoparticles and single molecules. To address this issue, Verbeeck and colleagues are now doing calculations and experiments to see if the technique can be used to determine the chirality of randomly oriented crystals.

The technique is described in Physical Review B.

Protons return to the Large Hadron Collider

The first proton beams of the second run of the Large Hadron Collider (LHC) were circulated earlier today. Travelling in opposite directions around the collider at CERN in Geneva, each beam was injected at 450 GeV. If all goes well over the next few days, the energy of each beam will be increased to the operating energy of 6.5 TeV.

(more…)

Copyright © 2026 by IOP Publishing Ltd and individual contributors