A quantum analogue of the popular “Newton’s cradle” toy has been proposed by a duo of physicists in Italy. Like momentum transferred in the toy, the team argues that it should be possible to achieve the nearly perfect transmission of a quantum wavefunction along a line of ultracold atoms in a 1D Bose–Einstein condensate. According to the pair, the work could help develop quantum-information systems that achieve high-quality wave transmission.
Best described as an “executive desk toy”, a Newton’s cradle is a device that demonstrates the conservation of energy and momentum. It consists of small, identically sized metal balls suspended from two horizontal bars. When a ball is lifted and allowed to fall, it strikes its immediate neighbour and comes to a stop. But its momentum is transferred across the rest of the spheres and propels only the sphere at the opposite end of the line into the air.
Ultracold cradling
Roberto Franzosi of the Quantum Science and Technology Institute in Arcetri and the National Institute of Optics, National Research Council, along with colleague Ruggero Vaia from the National Institute for Complex Systems, National Research Council in Florence, became interested in the quantum Newton’s cradle as part of their work on the unusual dynamics of locally perturbed quantum states. Franzosi points out that they based their design on ultracold atoms because it is one of the most versatile quantum systems from an experimental point of view. “Cold atoms are considered an excellent test bench for a huge variety of quantum phenomena,” says Franzosi, explaining that “with a suitable set-up, it is possible to realize a [quasi]-perfect transmission of the quantum wavefunction.”
Franzosi’s proposal is not the first though – a similar experiment was done in 2006 by a separate group of researchers that also attempted to create a quantum Newton’s cradle. Franzosi says that although that experiment was “a fascinating demonstration of how coherent states are the quantum analogue of classical particles”, it still did not represent a perfect analogue. That is because it was not a 1D system made up of individual quantum systems (an analogue of the rigid spheres) with nearest-neighbour interaction between them (the analogue of collisions between the spheres).
To create a perfect analogue, Franzosi and Vaia propose beginning with a Bose–Einstein condensate of two atomic species – that is, atoms in two excited states. The atoms are trapped in a 1D tube that has a longitudinal optical lattice running through it. Franzosi says that such a confinement can be created using counter-propagating laser beams that form standing waves to trap the atoms, thus developing two macroscopically populated coherent states.
“Fermionized” bosons?
The system would then be kept in a strong “Tonks–Girardeau regime” – a special type of strongly correlated quantum system that was proposed nearly 50 years ago but only experimentally realized in 2004. In such a gas, normally strongly interacting bosons, which have repulsive interactions, are confined in a 1D ensemble. Thanks to the strong repulsion, the bosons do not occupy the same position in space, effectively mimicking the Pauli exclusion principle for fermions to the point where a “fermionized” Bose gas is formed. Such a gas then exhibits many fermionic properties – such as a fermionic density distribution – with the exception of momentum distribution, which does not show ideal fermionic quantum behaviour.
In the Tonks–Girardeau regime, the strong repulsive interactions prevent double occupancy at any lattice site. This ensures that each site contains one atom and that the wavefunction is a superposition of the two hyperfine atomic states. Furthermore, the ensemble retains its characteristic momentum distribution. Once the atoms are arranged in this way, a disturbance of the wavefunction is triggered using a laser pulse coupled with the hyperfine atomic states at a given site.
This figure illustrates the result of a simulation wave with an optical lattice of 100 sites. The disturbance of the wavefunction travels forward and backward in the uniform chain. (Courtesy: Roberto Franzosi and Ruggero Vaia)
“We have shown that the tunnelling between sites makes the system equivalent to a free-fermion gas on a finite lattice,” says Franzosi. So, a disturbance of the wavefunction begins bouncing back and forth from the ends, just like the outermost two spheres in a Newton’s cradle. The researchers say that the experiment associates the propagation of a wavefunction disturbance with the transmission of mechanical momentum.
While Franzosi believes that the experiment proposed is feasible, “nevertheless, I’m a theoretician and I don’t have the opportunity to carrying it out”, he says. Although both he and Vaia feel that experimentally realizing their quantum cradle would be worthwhile for the “insight it would give into the entangled beauty of quantum mechanics”, they point out that such systems could have future applications in everything from atomic interferometers to quantum memories and even a quantum communications channel. The researchers are now working on an analogue of the Mach–Zehnder interferometer – a device that is used to determine relative variations in the phase shift between two collimated beams that are obtained from a single source – using cold atoms in a similar set-up.
It’s always surprising to see the kinds of things that go viral – who’d have thought that a blog with amusing animal pictures would prove such a hit or that a chubby Korean pop singer would clock up nearly two billion views on YouTube?
But I doubt anyone could have predicted that a video of a drop falling from an antique funnel of pitch at a lab at Trinity College Dublin would become one of the science stories of 2013. In fact, here at Physics World we didn’t even write about it at the time.
Partly to make amends, the May issue of Physics World magazine, which is now out, includes a fabulous article by Shane D Bergin, Stefan Hutzler and Denis Weaire from the lab in Dublin where the experiment is based. In the article, they explain the science behind the pitch drop, discuss the history of the experiment and reflect on the value of “slow science” to a hyper-connected, social-media world.
Arrays of optical traps that can hold tiny objects with nanometre precision have been created by researchers in the US. Based on a silicon chip, the traps are powered by a single laser and are much smaller, more stable and more energy-efficient than conventional optical traps. The traps can also be set up in less time and do not require a high level of expertise from the operator. As a result, their inventors believe that they could become a useful tool for high-throughput studies of large biological molecules such as DNA.
Optical traps – or optical tweezers – use laser light to manipulate objects that are as tiny and delicate as a single strand of DNA. While these experiments can deliver valuable information about the mechanical properties of large molecules – such as how proteins fold – they can take years to set up and are time consuming and difficult to run.
But now a team led by Michelle Wang, and Michal Lipson at Cornell University has created a tiny chip-based device that allows several trapping experiments to run in parallel. Dubbed the nanophotonic standing-wave array trap (nSWAT), the device offers high degrees of stability and control and requires less laser light than conventional schemes.
Plug-in-and-play traps
“Our optical trapping innovation reduces bench-top optics to a small device on a chip,” says Wang, who is a molecular biophysicist. “This is more like plug-in-and-play,” she adds. “For an experiment that typically takes a year to do, we hope to reduce that time to a month.”
Wang and Lipson developed the device along with researchers at Cornell’s physics department and the Howard Hughes Medical Institute. An on-chip interferometer is used to split and recombine an evanescent light wave into two counter-propagating waves that form a standing wave within a waveguide. Evanescent waves occur near the interface of two optical materials and decay rapidly over distances much smaller than the wavelength of the light. This rapid change in intensity is ideal for trapping objects and the antinodes of the standing wave provide an array of traps for tens to hundreds of particles.
The nSWAT uses much less laser power when many traps are run in parallel. “Usually if you want 100 traps you need 100 beams,” explains Wang. “Here the laser beam is recycled – to have more traps you just lengthen the waveguide without needing more laser power.”
Nanometre control
The technique also allows the position of the particles to be controlled with nanometre precision. This is done using a tiny on-chip heater that can change the refractive index of the waveguide. This affects the phase of the evanescent wave, which shifts the position of the antinode traps.
According to Wang, this is unlike previous nanophotonic waveguides in which the trapped particles are continuously propelled along the waveguide with no way of precisely controlling their position. But she adds, “These previous designs served as inspirations for our current work.”
The new approach to trapping is also inherently stable, and video tracking revealed no drift in the position of the trapped particle after more than 10 minutes. Previous attempts to set up multiple optical traps based on time-shared lasers have suffered from poor stability because the laser beam was not steady.
Applications in cell biology
Wang believes that the technique offers a promising approach for single-molecule studies relating to DNA and DNA-based processes, RNA and RNA-based processes, and protein folding and unfolding. She also says there could be applications in cell biology.
“Our challenges now are to optimize every aspect of the devices to make single-molecule measurements routine and streamlined,” says Wang. “This requires substantial work to improve measurement and manipulation capabilities, dovetail the device to commercial microscopes and develop software to fully automate the data acquisition and control.”
It has been described as an experiment, but it lacks most of the essentials needed to qualify as such. The material is not well characterized, its environment is poorly controlled and, until recently, it was not even regularly monitored. Nevertheless, in 2013 our observation of a falling drop of pitch attracted more than two million hits on YouTube, was listed in Discover magazine as one of the year’s top 100 science stories and even formed part of an Australian cricket commentator’s Test Match report for The Times.
This apparently mundane event captured the public imagination to an extent that none of us anticipated. It seems that even in the modern world of research, the meek shall sometimes inherit the Earth. But how, exactly, did a funnel full of pitch at Trinity College Dublin become “the drop heard round the world”?
The modern chapter of this story began in the 1980s, when dusty cupboards were emptied of their antique contents in the School of Physics at Trinity. During this clear-out, many strange objects came to light, including a funnel filled with pitch and dated October 1944. Pitch is a black polymeric material. If you hold it in your hand, it feels solid. If you were to hit it with a hammer, it would shatter. However, if left for long (really long) periods of time under the pull of gravity, pitch will flow, like a liquid. And since October 1944 that’s what our experiment had been doing. Indeed, we could see a drop slowly forming at the bottom of the funnel, preparing to join older ones that had evidently detached in earlier times, at a rate of about once per decade (see photo below).
Unfortunately, there was no clue to the identity of the experiment’s creator. In October 1944 Trinity was home to the future physics Nobel laureate Ernest Walton, who loved simple demonstrations, but nobody could remember him talking about this one. But even without a confirmed distinguished progenitor, the funnel still seemed worthy of display, so it survived the cull and was returned to a shelf where it could be observed. Year after year, undergraduate students idled past it, paying no heed to the “slow science” of the pitch drop.
Watching pitch flow
Slow science The Trinity College Dublin pitch-drop experiment as it appeared in May 2013, two months before the most recent drop finally dripped. The glass funnel is marked 1944 – the year the demonstration was begun – and the bottom of the cylinder contains an accumulation of pitch from previous drops. (Courtesy: Trinity College Dublin)
After decades of this benign neglect, our attention was once more drawn to the pitch experiment in November 2000, when news stories emerged that a similar funnel at the University of Queensland, Australia, had just produced a drop (details of the Australian set-up can be found in R Edgeworth et al. 1984 Eur. J. Phys.5 198). When you consider the time it takes for a drop of pitch to form, the chances of being there to see the drop drip are exceedingly small; despite the age of these experiments, it seemed that nobody had ever witnessed or recorded this momentous event. The Australian drop’s curator, John Mainstone, had intended to remedy this by videoing the drop. Sadly, the camera was not switched on at the crucial moment. Sadder still, Mainstone died in 2013 before he could record the sequel – which, with incredible timing, finally fell as this article was going to press.
Noting the attention that the Australian drop had attracted (which included an Ig Nobel Prize in 2005 “for patiently conducting an experiment that began in the year 1927”), we resolved to set up a camera to monitor the one at Trinity. By the time we did so, our funnel appeared heavily pregnant. Then, in the early hours of 11 July 2013 – perhaps assisted by some exceptionally warm weather – a heavy tear-drop blob of pitch fell to the base of the beaker below, with a thin thread connecting it to the stem of the funnel. The drop had dripped.
A complex drop
Before we discuss the media storm that followed our drop’s fall, let us concentrate for a moment on the physics. In the years before the Second World War, the “pendant drop” was a set-piece of the elementary physics curriculum. Through it, students learned about surface tension, which they measured by finding the critical mass of a drop of water, at which gravity wins out and causes it to fall from a nozzle. The Plateau–Rayleigh instability of a thin column of fluid is implicated in the final breakaway; hence, only in the drop’s ultimate demise does viscosity play much of a role.
When, instead of water, one considers a liquid that is highly viscous (and perhaps viscoelastic), the situation changes. Three forces are now involved at every stage, including viscosity. Compare a dripping tap with honey pouring from a spoon. Not only is the stream of dripping honey much slower to develop, but it eventually forms a long, thin filament, or neck, with the drop acting as a fixed weight, stretching it out. At this stage inertia begins to play a role, with the drop entering a regime of nearly free-fall while still remaining attached to an ever-longer and thinner thread.
However, the ultimate process of detachment for such a drop remains mysterious. It may feature the generation of a cascade of a series of necks of ever-decreasing diameters, with surface tension again playing an important role (as suggested by X D Shi et al. 1994 Science265 219). As is so often the case in physics, an apparently simple and mundane problem becomes more complex and intriguing the closer you look.
In our pitch drop, the endgame was not visible, as the drop did not entirely detach, being still linked to the stem of the funnel by a thin thread. Given the small size of the apparatus, this was not surprising. Even before the drop dripped, we could see that it was going to touch the pool of pitch below before detaching, and while we had managed to raise the funnel somewhat by carefully loosening rusty screws that were last tightened in October 1944, we were only able to put 5 cm of clearance between the drop and the pool. This proved insufficient. Indeed, in a series of complementary experiments using honey, we found thread-lengths of up to about 12 cm before break-off, and the break-off length is known to increase with viscosity (A Rothert et al. 2005 New J. Phys.5 59.1).
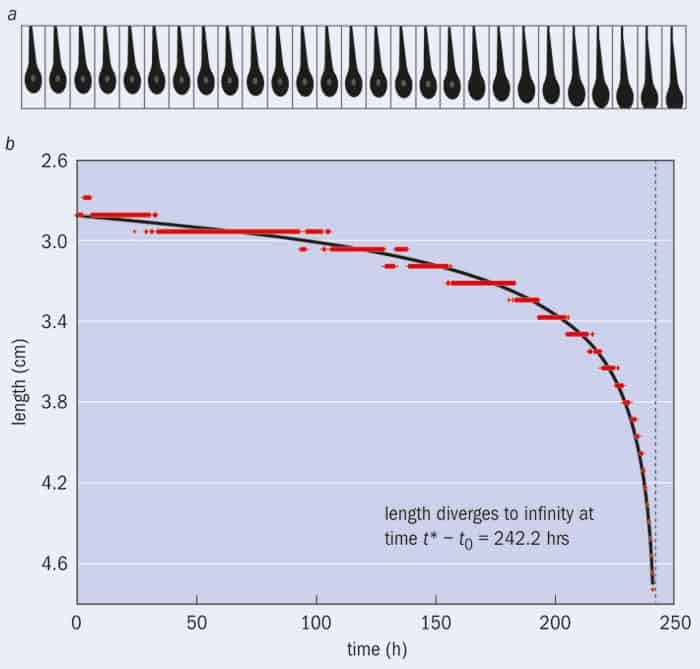
1 Going, going, gone! (a) Sequence of the pitch’s final drop (taken from the pitch-drop video). (b) Measured variation of drop length with time. (Courtesy: the authors/IOP Publishing)
Nevertheless, we were able to extract useful information by analysing video footage of the final 250 hours of the pendant drop. Data taken from the video images show that the drop’s fall accelerated towards the end, in accord with a formula from Y M Stokes et al. (Quarterly Journal of Mechanics and Applied Mechanics53 565) that was derived for flow opposed only by viscosity.
Under these circumstances, the length of the drop, L, diverges to infinity at a finite time, t* – t0, according to
where L0 is some effective initial length of the drop at t = –t0, and L1 is an off-set fitting parameter. The crisis time t* (244.5 hours for our pitch drop) is related to the viscosity, µ, density, ρ, and the gravitational constant, g, by t* = 3µ/(ρgL0). The fit shown in figure 1b is consistent with a viscosity of ~2 x 10⁷ Pa·s – not far from that found for our drop’s Australian cousin.
A drop of media gold
Unlike previous Australian drops, the final moments of ours had been caught on camera (see below). Once made available on the World Wide Web, a time-lapse video of the drop’s final days induced the kind of viral explosion of interest that characterizes our age. Perhaps primed by the coverage given to the rival Australian drop in 2000, the world’s media were energized by the uniqueness of this event and keen to report on a short, quirky world-first that resonated with the social-media generation.
Remarkably, within two weeks our video had been viewed more than two million times by people in almost every country in the world. Calls were coming in thick and fast to Trinity from various media giants, including the German publications Die Zeit and Der Spiegel, the Huffington Post, National Geographic and even the Wall Street Journal. Being asked hard questions by the world’s press compelled us to take the thing a little more seriously. So why the worldwide interest?
In January the New Yorker published an article asking why certain online content “goes viral”. What pushes someone to not only read a story but to pass it on? According to the article, a positive outcome, strong narrative and bizarreness are all key ingredients, as is a story’s ability to arouse curiosity. Furthermore, the article argued that readers are drawn to material that creates “social currency” – information that, when we pass it on, allows us to feel smart and be perceived as smart by others. This is a phenomenon that physicists would enjoy analysing (and they probably do), since it is akin to the cascade of photons in lasers or the chain reaction in a nuclear pile.
The Trinity pitch drop seems to tick all of these boxes. It was not a Eureka! moment. We learned nothing we did not know before. However, our Australian colleagues had built up a remarkable tension when extraordinary bad luck saw them miss previous drops falling. (The 2014 Australian drop was caught on camera and a video is available at http://ow.ly/w1k1M.) The human aspect of the story resonated with the public, as evidenced by the extensive media coverage given to Mainstone’s death. It seems that our video brought finality to this scientific saga.
What more can we say of the global interest in our drip? Are there lessons to be learned for science outreach? Perhaps. With astute insight, the New Yorker article warns that the more we mine data on viral content in order to define a “precise calculus” of why people share some things and not others, “the less likely it will be for what we know [about why things ‘go viral’] to remain true. If emotion and arousal are key, then, in a social application of the observer effect, we may be changing what will become popular even as we’re studying it.” It’s almost quantum mechanical!
A legacy of slow science
Poorly defined A recent photograph of the Aberystwyth University pitch-drop demonstration, begun in 1914. Despite its age, the pitch has barely entered the stem of the funnel, let alone formed a drop. (Courtesy: Aberystwyth University)
Our burst of fame was bright, but short-lived: the initial ~105 daily views of the pitch-drop video fell exponentially, with a half-life of 2.5 days. Sic transit gloria mundi. However, our own interest continues. Not long after the flurry of activity generated by the momentous drop, one of us happened to be inspecting old instruments at Aberystwyth University. Hidden among them was yet another pitch-drop experiment, this one begun in 1914 by G T R “Taffy” Evans, who subsequently emigrated to South Africa. But even if he had stayed he would not have seen much happen: current estimates suggest that it will take at least 1000 years for the pitch to emerge from the funnel, let alone form a drop. This confirms that pitch is a poorly defined substance, of variable properties (see photograph left).
Back in Dublin, we now intend to set up a larger version of the funnel apparatus, one that may enable us to see the stretching of a viscous filament to a much greater length, and perhaps its eventual dénouement. If pitch is used, the experiment will require great patience, but perhaps, as Milton put it, “they also serve who only stand and wait”. Indeed, we have an excellent example of this in Lord Kelvin, whose experiments in “slow science” are still cherished today, a century after his death. Among them was a ramp down which pitch flowed, rather in the manner of a glacier. His interest in pitch was part of a wider search for a substance that might mimic the properties of the aether of space, which he considered (at various times) to be analogous to a jelly, a foam or a network of fluid vortices. During Kelvin’s fruitless search for a better aether model, he placed some of the first footprints in modern materials science.
The pace of data-gathering and publication is not hectic, but slow science provides good food for thought in tranquilitude.
Scientists and laypeople the world over were intrigued by the announcement made by the BICEP2 collaboration earlier last month, when it claimed to have detected the primordial “B-mode polarization” of the cosmic microwave signal (CMB). Many researchers have hailed it as the first evidence for cosmic inflation – the extremely rapid expansion that cosmologists believe our universe underwent a mere 10–35 s after the Big Bang.
Today, we came across the first two papers published in Physical Review Letters that are based on BICEP2’s data. Their publication is surprising, as the original BICEP2 paper, containing the data, has not yet been published in a peer-reviewed journal. Both papers look at the implications of BICEP2’s claims about string theory or vice versa. In one of the papers, Adam Moss from the University of Nottingham in the UK, along with Levon Pogosian from Simon Fraser University in Canada, asks whether BICEP2 has seen “vector modes” and looks at the constrains that could be placed on “properties of a wide range of different types of cosmic strings networks”.
In the other paper, Andrew Liddle from the UK’s University of Edinburgh, along with an international group of colleagues, claims that the “B-mode polarization signal detected at low multipoles by BICEP2 cannot be entirely due to topological defects” and also says that adding in some topological effects may help the BICEP2 data better fit the other CMB data and so bring the tensor to scalar ratio “r” down from 0.2 to 0.15.
Undoubtedly, these will be the first of many papers based on BICEP2’s results, whether or not the experiments claims are confirmed.
Researchers in Australia have invented a new kind of optical lens that could be combined with a smartphone camera to create a microscope for diagnosing skin cancer or identifying agricultural pests. The lens, which is simple to make and costs almost nothing to produce, consists of droplets of polydimethylsiloxane (PDMS) gel that have been hardened in an oven. The lens can be made without anyone having to grind or mould it, which normally requires specialized equipment and skills.
The lens has been developed by Steve Lee and colleagues at the Australian National University, who came up with the idea by accident. While making PDMS using conventional moulds, Lee noticed that droplets of spilled gel that had hardened overnight in the oven were lens-shaped. He showed them to a friend who is a medical doctor, who pointed out that there is a demand for medical-imaging lenses that are simple and cheap to make.
Inspired by the discovery and its potential applications, Lee and colleagues devised a fabrication process that begins with a small droplet of the gel being placed onto a flat substrate, where it spreads out to create a flat base. After baking this base in an oven at 70 °C, a second droplet is then placed on top, and the substrate is flipped over so that the new droplet is clinging onto the underside of the base. The force of gravity on the drop ensures that it forms a perfect parabolic shape and the sample is then baked again to harden the lens. “It’s very easy to do,” says Lee. “I think anyone could do it at home.”
DIY lens
The team has used its technique to make lenses that are a few millimetres thick and have magnifications of up to ×160. The lenses can resolve structures as small as 4 μm and, according to Lee, they can therefore be used to image individual biological cells. While this magnification is not as high as commercial microscopes, Lee points out that it can be achieved at a fraction of the cost. “We’re quite surprised at the magnification enhancement using such a simple process,” he says.
Images of human tissue taken using a PDMS lens (left) and an Olympus BX 51 microscope. The field of view is about 750 μm wide. (Courtesy: Biomedical Optics Express)
To show that the lenses can be used for practical medical applications, the team has created a simple “clip-on” device that converts a smartphone into a “dermascope”: a medical device that is used to diagnose skin cancers and that can cost $500 or more. Built for about $2 using a 3D printer, the device integrates a lens, battery and a light-emitting diode (LED) into an imaging module that can be attached to a smartphone. The device can then be pointed at a patient’s skin to take images of, say, a skin lesion.
Access to expert analysis
Once the image of a lesion has been acquired, it can then be transmitted across a mobile-phone network to an expert for analysis, which would be particularly useful for health workers in remote areas. A similar approach could also be used by farmers to take images of microscopic pests on crops before sending them to an agricultural scientist for identification. Other applications include implanting such lenses into live animals to observe the development of living cells, which could give us a better understanding of how diseases progress. Such experiments would be much cheaper to carry out if low-cost disposable lenses were available.
Beyond science and commerce, Lee believes that the microscope could also be used in schools and even by hobbyists. “The smartphone creates a perfect platform,” he says. “By 2018 or so there will be about 1.7 billion smartphones worldwide, so what we are doing is distributing microscopy to the masses.” However, not all optical-imaging researchers are as enthusiastic as Lee, with one expert telling physicsworld.com that the technique does not offer a way of controlling the curvature of the lens – something that is important for making useful lenses.
The team is also limited to making lenses with diameters less than about 1.3 cm, but is now trying to make lenses as large as 5 cm. The team is also seeking to improve the lenses’ optical properties.
Quantum mechanics, rather than a huge telescope, could be the best route to high-resolution space images, according to new research carried out in the UK. If confirmed, a telescope of any size could resolve ever-smaller features of the night sky, allowing astronomers to discover exoplanets and other distant objects much more easily than is currently possible.
The Gran Telescopio Canarias (GTC) telescope on the volcanic island of La Palma in the Canary Islands is a prime example of a massive telescope. With a mirror spanning more than 10 metres, it is the biggest single-aperture optical telescope in the world, and has delivered some of the clearest images ever recorded of distant galaxies, globular clusters and nebulae. But the GTC was not cheap to build: it cost €130 million and took seven years.
Uncertain times
The reason the GTC and other telescopes need to be so big is to push the maximum resolution. When a photon enters an aperture of a telescope, the uncertainty in its position is reduced to the radius of that aperture. Moreover, according to Heisenberg’s uncertainty principle, there is a corresponding uncertainty in its momentum, which defines the photon’s initial direction. As the uncertainty in position rises with the widening of the aperture, the uncertainty in its momentum falls – allowing its direction to be determined with greater precision. In other words, telescopes with larger apertures have a smaller “diffraction limit”.
Aglaé Kellerer at Durham University began thinking about how quantum mechanics could provide an alternative to overcome the diffraction limit when she came across similar methods used in microscopy and lithography. “The one horizon for the astronomer today is to build larger telescopes. Somehow, at some point, we need to come up with a different approach,” she says.
Cloning techniques
The diffraction limit for a telescope aperture is set per photon – but if there were many identical, cloned photons arriving at the same time, the diffraction limit would be reduced by a factor equal to the square root of their number. To achieve this, Kellerer proposes that a quantum “non-demolition” measurement is performed upon each photon passing through the pupil of the telescope. Such a measurement does not reveal specific information about the photon, but only records its passing. After the measurement, the photon is cloned by letting it “de-excite” atoms, which spontaneously emit several identical photons that are then recorded by a detector, which calculates their average signal.
Unfortunately, the technology required to build a telescope using quantum cloning is very far off since, lacking efficiency, current quantum non-demolition measurements are performed on laser photons. A much closer goal, says Kellerer, is a proof-of-principle experiment in which a quantum telescope would be directed at a very bright light source with a narrow spectral range. This might be done at a laboratory specializing in quantum optics, such as the Max Planck Institute for Quantum Optics in Garching, Germany, or the Institute for Quantum Optics and Quantum Information in Innsbruck, Austria. “That’s the first step to do now,” she says.
Physicist Shigeki Takeuchi at Osaka University in Japan, who recently experimentally demonstrated a microscope that benefits from quantum entanglement, calls it a “very interesting” idea. “I have a feeling that a more detailed theoretical analysis based on quantum physics may be important as the next step,” he says.
Even if the principle of the quantum telescope proves to be valid, a question remains whether it would be any easier to exploit quantum mechanics than build a bigger mirror. For her part, Kellerer is confident that the time for a quantum telescope will come, saying “We are getting better and better at exploiting quantum effects…at some point it will become easier to use the quantum optical technology.”
The research is due to be published in June in Astronomy & Geophysics, a preprint is available on arXiv.
A surprising similarity between ultracold gases of “Rydberg atoms” and wireless telecommunications networks has been spotted by mathematicians and physicists at the Eindhoven University of Technology in the Netherlands. Using algorithms designed to boost the performance of certain wireless networks, Jaron Sanders and colleagues have gained insights into why these atoms sometimes form crystalline structures. As the algorithms can also be used to control such structures, ensembles of Rydberg atoms could therefore be created in specific quantum states and used in quantum-information applications. The technique could even one day be used to create quantum-logic gates using Rydberg atoms.
At the centre of the new work is a protocol called “carrier sense multiple access” (CSMA), which involves a collection of nodes – say Wi-Fi base stations – each of which can receive and transmit wireless data. Before a node sends a signal, it uses its receiver to sense whether nearby nodes are also transmitting. If another signal is sensed, the node holds off transmitting until the airwaves are clear – the goal being for the network of nodes to maximize its use of available bandwidth by minimizing interference between nodes.
Blocking the neighbours
Sanders, who is a mathematician, realized that this tendency for a wireless node to switch off when its neighbours are switched on is shared by Rydberg atoms in an ultracold gas. Such atoms are unusual in that they have an electron that has been promoted to a very high-energy state – usually by firing laser light at the gas. This means that the atom can be very easily polarized because its electron is so far from the nucleus. This property changes the energy levels of neighbouring atoms, preventing them from absorbing light and becoming Rydberg atoms themselves. In fact, this “dipole blockade” effect has already been used to create “slow light”, while the dipole interactions between Rydberg atoms have been used to create quantum logic gates.
Sanders and colleagues modelled their Rydberg gas as a collection of atoms that are located at fixed positions, which is a reasonable assumption for a gas at microkelvin temperatures. An atom is then placed in a Rydberg state by being made to absorb laser light at two frequencies. The rate at which atoms make the transition is analogous to the rate at which a wireless node turns on. The rate at which Rydberg atoms decay, meanwhile, is analogous to the rate at which a wireless node turns off.
The dipole blockade can be modelled by assuming that all atoms within a certain radius of a Rydberg atom cannot be excited until that Rydberg atom decays. Meanwhile, to simulate the fact that each node in a real wireless network switches on and off at a rate that depends on the precise traffic in that part of the network, the team’s model allows the laser intensities to vary within the gas, which affects both the excitation and decay rates.
Crystalline lattices emerge
In their work, the researchers were then able to investigate the behaviour of the Rydberg gas based on their understanding of CSMA networks. They could then calculate the probabilities that specific configurations of Rydberg and non-Rydberg atoms would occur. These calculations revealed that the most probable configurations resemble regular crystalline lattices of Rydberg atoms. Given that experiments have shown that some Rydberg gases do form crystalline structures, the team says that its analysis provides a model for understanding why this occurs in analogy to wireless networks.
Using an algorithm originally designed for maximizing the throughput of a wireless network, Sanders and colleagues also examined how the laser intensities for individual atoms should be configured for a desired structure to emerge. This work is important because it could therefore be used for creating specific structures of Rydberg atoms that could be used as specially prepared quantum states or as quantum logic gates.
Better wireless neworks
Sanders told physicsworld.com that the team is now thinking about how its control algorithm could be implemented in the lab. As well as opening the door to quantum logic gates made from ultracold Rydberg gases, creating these systems in the lab could actually lead to better wireless networks. The reason is that maximizing the performance of CSMA networks is a mathematically difficult problem and Rydberg gases could provide a way of simulating network performance.
This podcast was recorded at the National Physical Laboratory (NPL), where the world’s first practical atomic clock was built in 1955 and where today physicists including Patrick Gill and Helen Margolis are building the timepieces of tomorrow.
While it is clear that physicists need to develop a new primary time standard, they have yet to agree on exactly which type of clock to choose, as Gill and Margolis explain to Physics World‘s Hamish Johnston. As well as having practical applications ranging from time-stamping financial transactions to satellite navigation, the NPL researchers explain that the new clocks will be used to do basic science such as testing whether the fundamental constants of physics are actually changing and measuring the Earth’s gravitational field.
If you enjoyed this podcast, then there is much more about the next-generation of atomic clocks in the feature article “Optical clocks” by Gill and Margolis
Black, heavy and calm, outer space seems motionless. Faraway stars flicker from time to time, as if lazily transmitting some cosmic Morse code. And on a clear night, the Milky Way looks as if it is painted on a huge, glossy black dome; the stars seem motionless, pinned into place.
Of course, we know that our home galaxy is not as still as it appears – its entire disc rotates horizontally about its centre. But in a surprising twist, recent observations by three independent teams of astronomers suggest that the Milky Way also undulates up and down. Thousands of stars in it constantly wobble vertically at speeds of about 20–30 km/s, stirring the galactic milkshake of stars and gas.
Just like any other spiral galaxy, the Milky Way looks like a pinwheel – a flat disc with spiral “arms” full of some 200–400 billion stars and a supermassive black hole at its centre. The motion of the Sun with respect to other nearby stars has been known for centuries, but it was in 1927 that Bertil Lindblad and Jan Oort came up with the first detailed model of our galaxy’s motion, including its rotation.
We now know that individual stars orbit around the centre, making the whole disc rotate at about 220 km/s at the Sun’s distance from the galactic centre. Also known is the random vertical motion of stars, much like a gas. But the bulk vertical up-and-down motion came as a surprise that no-one can yet explain. Perhaps the Milky Way is bumping into chunks of dark matter, or maybe some past collisions with other galaxies set it off ringing like a bell, suggests Mary Williams from the Leibniz Institute for Astrophysics Potsdam in Germany.
Williams leads one of the three groups to have suggested the Milky Way’s peculiar vertical motion. Together with colleagues, she examined the movement of nearly half a million stars in a 3D volume around the Sun, using data gathered by the Radial Velocity Experiment (RAVE). A collaboration of researchers from more than 20 institutes around the world, RAVE ran for 10 years until April 2013 using data from the UK Schmidt Telescope of the Australian Astronomical Observatory.
The telescope measured starlight at infrared wavelengths between 840 and 880 nm. Using the resulting spectra, the researchers derived the stars’ radial velocities, temperatures, elemental compositions and surface gravities (the latter being inversely proportional to the square of a star’s radius). Based on the temperatures and surface gravities, the team isolated a group of about 70,000 stars with roughly the same intrinsic brightness, dubbed “the red clump”.
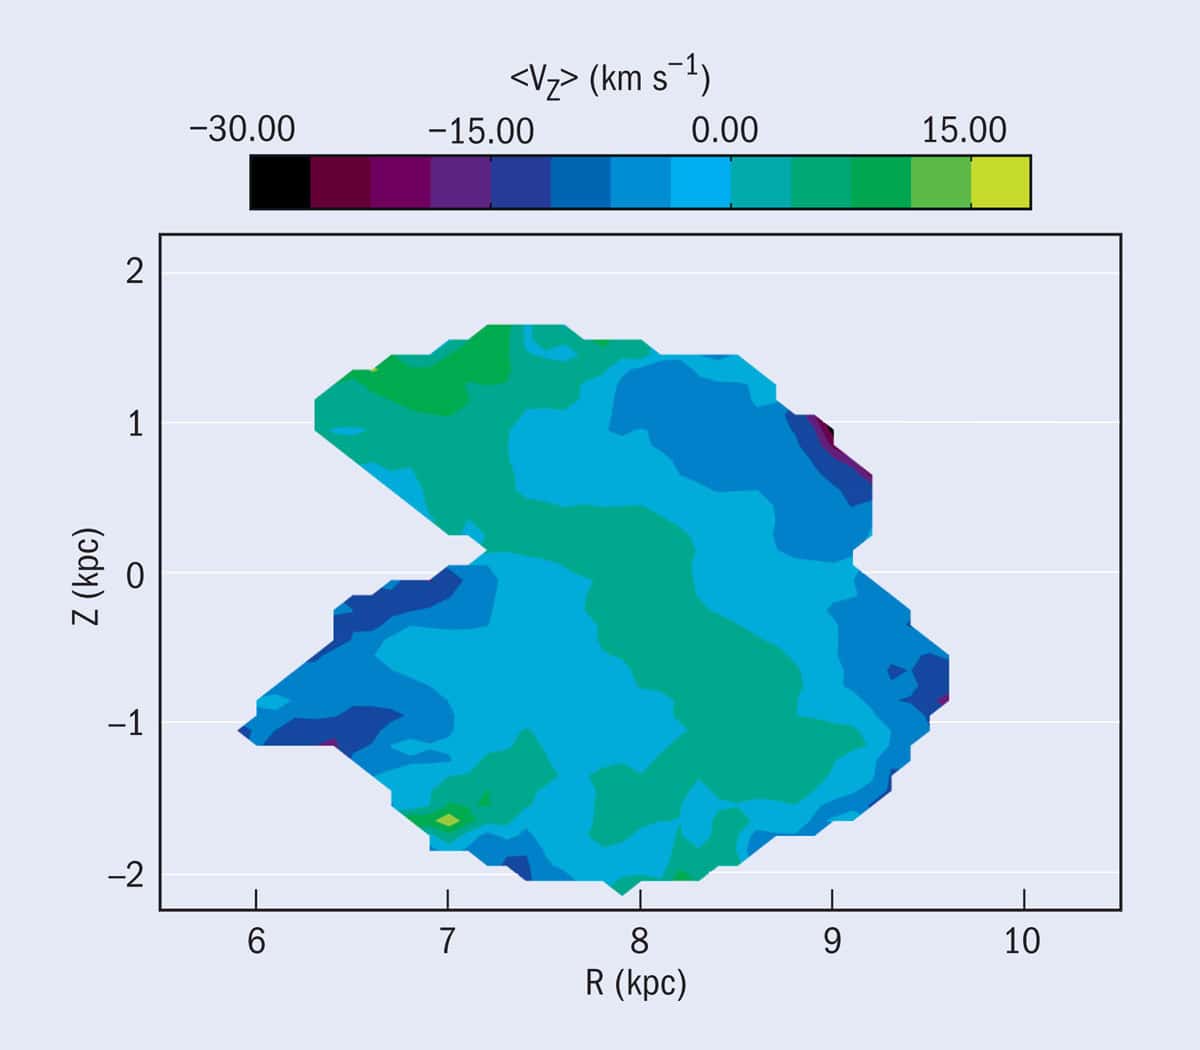
As the stars in the red clump have the same brightness, the team estimated their distances from Earth by measuring how dim they are, much as a 60 W light bulb looks fainter when far away than close up. With this information, combined with the stars’ radial velocities and extra information from other stellar surveys giving the transverse movement of the stars across the sky, the researchers put together a map showing the full 3D motion of the stars in space. (Figure 1 shows the vertical component.)
The result was unexpected. Not only do the stars rotate, they also move in-and-out and up-and-down in the galaxy. “These motions are suggestive of a wave, much like a sound wave,” says Williams, whose work was published in October last year (Mon. Not. R. Astron. Soc.436 101).
Moreover, the stars do not all appear to be moving in the same fashion, either. Stars that are closer to the centre of the galaxy than the Sun tend to drift away from the galactic plane, which goes through the middle of the galaxy’s disc. However, stars that lie further out than the Sun move in towards the plane. The overall result is that stars move up and down depending on their distance.
“Our result has shown that the galaxy is all squishy and wobbly – it’s not just spinning,” says Williams, who also likens the stars’ motion to dancers jumping up and down in the rotating “mosh pit” that sometimes forms in front of a stage at a rock concert. Reaching a definite conclusion was not easy, though, she adds. The results are incredibly complex, and you can only really see the vertical waves clearly on a 3D map.
1 Throwing a wobbly
(Courtesy: Leibniz Institute for Astrophysics Potsdam)
Based on data from the Radial Velocity Experiment (RAVE) – a survey of almost half a million stars around the Sun – astronomers have found that the Milky Way not only rotates horizontally but also that individual stars move vertically up and down perpendicular to the plane of our galaxy. Shown here is a slice of the Milky Way cut along a radial line of the galactic disc, showing stars in the region near our Sun. Axes are coordinates, where R is the radial distance from the centre of the galaxy and Z is the distance above (Z > 0) or below (Z < 0) the plane. The Sun is located at (8.33,0.03). All distances are measured in kiloparsecs (kpc, where 1 kpc is roughly 3300 light-years). Colour indicates the stars’ average velocity in the Z direction, <vZ>, and reveals a ridge inclined at 40° to the R axis where stars move upwards (green), whereas either side they move downwards (blue). The differences in stellar speeds resemble velocity maps for sound waves, supporting the theory that vertical waves exist in the galaxy.
Ripples of excitement
Just months before Williams and colleagues published their work, another team announced similar results. Led by astrophysicist Larry Widrow of Queen’s University in Kingston, Canada, the team analysed data taken by the Sloan Digital Sky Survey (SDSS) of about 300,000 stars in the Milky Way. Widrow’s team found a small but statistically important difference in the distribution of the number of stars – as well as their motions – above and below the galactic plane. It was, Widrow says, as if there were “localized ripples going through the disc”.
One possible explanation for the ripples, according to Widrow, is based on there literally being more to the Milky Way than meets the eye. We know that it has a bright central bulge packed with stars, a flat rotating disc of stars, and a spherical halo of sparsely distributed stars that extends far beyond the galactic disc and contains more than 20 small satellite galaxies gobbled up by our own. But astronomers also believe that the Milky Way is surrounded by a halo of dark matter – an invisible substance of as-yet-unexplained composition that is thought to make up about 85% of all matter in our universe. According to computer simulations, dark matter can form massive lumps, which could have passed through our home galaxy’s disc, churning things up and generating vertical waves in the motion of stars, says Widrow.
Dark matter can form massive lumps, which could have passed through our home galaxy’s disc, churning things up
Williams’ research confirmed Widrow’s initial results with a larger data set, covering a larger region of the solar neighbourhood, extending roughly a quarter of the way to the centre of the Milky Way and about the same distance outward. The vertical flutter has also been confirmed by a third survey carried out by astrophysicists from the Rensselaer Polytechnic Institute in Troy, New York.
Published shortly after that of Williams, this third survey was based on observations made by the Chinese Large Sky Area Multi-Object Fiber Spectroscopic Telescope (LAMOST), located north-east of Beijing. “Although we were looking at a different part of the galaxy, we saw similar ‘wobbly’ patterns,” says Heidi Newberg, who took part in the research. Given that three different surveys are all showing the same thing, Williams feels the results are incredibly exciting, giving her “a lot of confidence that what we are seeing is real”.
A new wave of data
The next step is to use calculations and computer simulations to test different ideas about what makes the Milky Way flutter. Indeed, a new space craft will soon start bringing in a lot more observational results. The European Space Agency’s Gaia satellite, which took off successfully late last year, is expected to produce a wealth of data on the structure of the Milky Way. It will measure accurate distances to about a billion stars, and give their proper motions and radial velocities.
This information will help scientists to carefully map out the bulk motions seen in the SDSS, RAVE and LAMOST surveys in far greater detail and over a larger region of our galaxy, providing in turn a much better idea about the structure of the Milky Way’s galactic disc and the system of satellite galaxies and dark matter around it. “The final word will come with Gaia’s [measurements] for a staggering amount of stars,” says Williams. “With these we’ll be able to accurately trace the motions of stars in this region and way beyond, and the vertical waves we’re seeing [will be] starkly defined.”
The results could give us a better understanding of how galaxies form, and help refine existing models of the Milky Way, which assume that our galaxy is in equilibrium. And if it turns out that dark matter is stirring things up, the wobbles could help determine whether unseen “dark” dwarf galaxies are orbiting the Milky Way, says Newberg.
All things considered, our galaxy seems to be much more than a plain old rotating spiral.