The UK government has “widely accepted” the recommendations of a major report into open-access publishing that was released in June by a 15-strong working group led by the British sociologist Janet Finch. The Finch report concluded that the UK should lead the way in transforming scientific publishing from a “reader pays” to an “author pays” model, supporting the need for a fee – known as an “article processing charge” – to fund open-access journals. The report has also called for the UK research councils to “establish more effective and flexible arrangements to meet the cost of publishing in open access and hybrid journals”.
In a letter to Finch outlining the government’s support for the report, UK science minister David Willetts says that the UK government recognizes “that while open access means free access to the user and full right of search, it does not follow that open access has no cost”. He adds that publicly funded research institutions will need help in paying for article processing charges with this funding set to come out of “existing research funds”. The only proposal by Finch that will not be implemented is a recommended reduction in value added tax for e-journals, which Willetts says would contravene EU rules.
Willetts states in the letter that the government favours the use of “gold” open-access publishing, whereby authors pay a fee to publish in an open-access journal and the paper is then immediately made available for anyone to read for free. It prefers this to “green” open-access publishing, where the published paper is placed behind a publisher’s paywall but then deposited into a centralized free-to-access repository after a certain embargo period. If a particular journal does not support gold publication, however, researchers will be required to place their papers in a repository within six months of publication. If funding is not provided for gold publication, publishers may extend the embargo period before papers can be made freely available from six months to 12.
Peter Knight, president of the Institute of Physics, which publishes physicsworld.com, welcomes the government’s commitment to support almost all of the recommendations of the Finch report. “The response recognises the importance of the academic publishing sector that delivers jobs and exports for the UK, and of learned societies such as the Institute of Physics, whose educational and outreach activities depend on gift aid from our publishing company,” he says.
Yet Knight says that there will be “complex challenges” that could carry additional costs in the transition to open access. “We are concerned that these transitional costs appear set to fall on the science budget, reducing the funding available for UK researchers to carry on the work that has put this country at the forefront of many fields, including physics,” he warns. One issue in particular is that other countries will get free access to UK-based research while the UK has to still pay for journal subscriptions to access work done at foreign institutions.
Towards 2014
Research Councils UK (RCUK) – an umbrella organization for seven UK research councils – has also announced that, from April 2013, any scientific paper that results from research wholly or partially funded by RCUK must either be put into an open-access journal or in a journal that allows papers to be deposited in a repository. In the latter case, the paper must be put in a repository within six months and must include all changes resulting from peer review. However, RCUK has also announced that any article-processing charges will not be covered in research grant applications, but rather through “block grants” awarded to universities, although how this will work in practice is not yet clear.
In a statement from Nature Publishing Group (NPG), which publishes the Nature suite of journals, they welcome RCUK’s announcement to make centralized funding available to institutions to pay open-access publication charges. NPG also says that its existing self-archiving policy is already fully compliant with RCUK’s new policy of encouraging self-archiving for public access six months after publication. However, the firm is urging RCUK and its funding bodies to “quickly clarify the process for allocating funds to UK institutions, so that they can establish procedures and make the transition towards gold open access as smooth as possible for funded researchers”.
Open access on the horizon
Meanwhile, the European Commission (EC) announced today that it will make open access “a general principle” of its next funding programme, called Horizon 2020, which runs from 2014 to 2020. In a statement it says that from 2014 all articles produced with funding from Horizon 2020 will have to be either accessible immediately via gold open access (with up-front publication costs eligible for reimbursement by the EC) or available in an open-access repository no later than six months after publication.
The EC also recommends that its members take a similar approach to open-access publishing and sets a goal of 60% of European publicly funded research is available under open access by 2016.
Physicists in Germany have developed a trap for micron-sized particles that relies on both laser light and heat. The “optothermal” trap, which is built around a photonic crystal fibre, puts a new twist on microparticle trapping. The technique could offer a way to make precise measurements of the thermal forces acting on tiny particles and could even be used to sort and concentrate microparticles.
For more than 20 years it has been possible to trap microscopically small objects using light. The key development came in 1986 when Arthur Ashkin, Steven Chu and others at Bell Labs in the US invented what became known as optical tweezers: focused laser light that can hold microparticles in mid-space. The phenomenon works because dielectric particles are attracted to the region of strongest electric field, which is where the laser beam is focused.
Light traps and transports
Optical tweezers are now regularly used to trap and manipulate microparticles – particularly biological microparticles, such as cells and viruses. But light isn’t the only way to trap microparticles – thermal forces, generated by light absorption, can also play a role. For instance, a laser can heat just one side of a particle so that molecules bouncing off it receive different amounts of momentum depending on the side that they strike. The effect can be used to trap or transport particles over centimetre distances in air.
Now, Oliver Schmidt, Tijmen Euser and colleagues of the Max Planck Institute for the Science of Light in Erlangen, Germany, have taken a new approach to trapping. In their device, a microparticle with diameter of about 6 μm is contained within a hollow-core, photonic-crystal fibre. This is a transparent fibre with a 100 μm outer diameter, 12 μm inner diameter and a 2D array of holes in the cladding. Laser light drives the microparticle along the fibre’s air-filled core but, when it approaches a black band drawn around the fibre, it comes to a halt of its own accord.
Thermal creep flow
The trick works because of a phenomenon known as “thermal creep flow”, which exists only very close to a surface that has a temperature gradient – that is, a hot side and a cold side. Hot molecules in the air will impart the surface with more momentum than the cold molecules, which means that the surface receives an overall force in the cold direction. In reaction, the air at the centre of the cores flows in the opposite direction – from cold to hot.
In the Max Plank group’s device, the thermal gradient is created by the microparticle’s scattering of light, which is absorbed by the black band. The resulting thermal creep drives a flow of air along the core’s surface towards the hot spot, which is balanced by a flow of air along the middle of the core in the opposite direction – away from the hot spot – creating a structure resembling a convection current. This complex series of actions effectively produces a viscous drag force that counteracts the laser’s pushing and traps the microparticle at the band.
Sorting microparticles
Schmidt and Euser point out that, unlike the previous optothermal traps, their device doesn’t require the microparticles themselves to be light-absorbing. Moreover, the radiation and viscous forces scale linearly with the laser’s power, which means that the trapping is independent of laser power. The researchers say that the trap could have applications in so-called “lab on a chip” systems in which microparticles could be moved round a tiny chip while various analyses are performed. Or, if the drawn-on bands are replaced with actual heating elements, the trap could be used to sort microparticles according to their physical properties, or to measure the thermal forces acting on them.
“Small, electrically controlled heating elements could be placed at specific locations along microfluidic channels,” the researchers say. “When switched on, the induced thermal creep flow can be used to either trap particles or to sort them. Such localized heating elements would be extremely easy to implement, not requiring any optical connections.”
Biophysicist Dieter Braun at the Ludwig Maximilians University Munich in Germany believes that for the trapping and detection of biomolecules, the fibre would need to be tuned for fluorescence imaging. But he adds that the use of hollow fibres is “very original”. Its application potential “is encouraging and should be pursued,” he says.
An international team of astronomers and physicists has, for the first time, detected the large-scale motion of galaxy clusters, using an effect that was proposed almost 40 years ago. This is the first direct measurement of the motion of objects at cosmological distances and such observations could lead to a better understanding of how the universe formed and evolved and also help astronomers study dark matter and dark energy.
In 1972 Russian physicists Rashid Sunyaev and Yakov Zel’dovich argued that a moving cluster of galaxies should, in theory, cause a slight temperature shift in the cosmic-microwave-background (CMB) radiation – the leftover thermal radiation from the Big Bang – as it passes through it. This Sunyaev–Zel’dovich (SZ) effect is caused by high-energy electrons distorting the CMB through inverse Compton scattering and can be divided into three categories, or “effects” – thermal, kinematic and polarized. It is the second variety – the kinematic Sunyaev–Zel’dovich (kSZ) – that was used in the new work to detect the cosmic-scale motion. The kSZ is a second-order effect where the CMB photons interact with high-energy electrons in the galaxy clusters, as a result of the electron’s bulk motion. Radiation passing through a galaxy cluster moving toward Earth appears hotter by a few millionths of a degree, while radiation passing through a cluster moving away appears slightly cooler. Although proposed 40 years ago, this is the first time the kSZ effect has been observed.
Come together
To get around the difficulties of detecting such a small temperature change, lead author Nick Hand from University of California, Berkeley in the US, along with 58 collaborators from the Atacama Cosmology Telescope (ACT) in Chile and the Baryon Oscillation Spectroscopic Survey (BOSS) project in New Mexico, compiled signals from several clusters to detect the temperature shift. Data from a catalogue of 27,291 luminous galaxies from BOSS were laid over maps of the same region of sky observed by the ACT between 2008 and 2010. As each galaxy likely resides in a galaxy cluster, their positions were used to determine the locations of clusters that would distort the CMB radiation.
In a galaxy far far away
The teams detected the motion of galaxy clusters that are several billion light-years away and moving at velocities of up to 600 km/s. The velocities of these distant objects are extremely difficult to detect as they require very precise distance measurements.
“One of the main advantages of the kSZ effect is that its magnitude is independent of a galaxy cluster’s distance from us, so we can measure the velocity of an object’s motion toward or away from Earth at much larger distances than was possible,” explains Hand. He also says that the method could serve as an additional statistical check, independent of currently used measuring methods, for future large-scale measurements.
Of the 27,291 galaxies in the BOSS data, the team used 7500 of the brightest galaxies to uncover the kSZ signal. As two galaxy clusters move toward each other as a result of their mutual gravitational attraction, the team found that the kSZ effect becomes more pronounced – a slight cold spot in the CMB data would suggest that a cluster was moving away from us, whereas a slight hot spot would mean the cluster was moving towards us, similar to the Doppler effect. As the temperature shift data is averaged over thousands of the BOSS objects, a clear kSZ signal was seen.
“The kSZ signal is small because the odds of a microwave hitting an electron while passing through a galaxy cluster are low, and the change in the microwave’s energy from this collision is slight,” says ACT collaborator and physicist David Spergel of Princeton University, US. “Including several thousand galaxies in the dataset reduced distortion and we were left with a strong signal.”
Two collaborations are better than one
The researchers point out that if the data from just the ACT or the BOSS project was analysed by itself, the signal would not have been apparent, as neither was originally built to look for it specifically. Both the ACT and the BOSS projects differ in the objects they study, their method of data collection and even the wavelengths in which they operate – microwaves for the ACT, visible-light waves for BOSS. This work highlights the importance of large collaborations, which might even be fundamentally different in their missions, sharing and combining their data to study subtle physical effects that no single survey could detect – says the team.
According to Hand “The [kSZ] signal agrees remarkably well with the typical CMB cosmology that we have developed over the past decade…so well, in fact, that it was not expected! So it was quite exciting to confirm something predicted 40 years ago, when neither the ACT or BOSS teams were planning on it.”
The strength of the kSZ effect’s signal depends on the distribution of electrons in and around galaxies. So the signal could be used to trace the location of atoms in the nearby universe, revealing how galaxies form. In the near future, Hand hopes that increased sensitivity for the ACT, which is due an upgrade, and larger data sets will mean even further improvements of the kSZ signal, which in turn will mean better velocity measurements.
The research is to be published in Physical Review Letters. A preprint of the work is available on arXiv.
A Hubble Space Telescope image showing the five moons that orbit Pluto.
(Courtesy: NASA, ESA and M Showalter at the SETI Institute)
By Tushna Commissariat
The dwarf-planet Pluto is back in the news this week, as astronomers have discovered that it has a fifth icy moon orbiting it. The newly discovered moon, which was seen as a speck of light in nine separate sets of images taken by the NASA/ESA Hubble Space Telescope, apparently has a rather irregular shape, and is about 10–25 km across. With its 95,000 km diameter circular orbit around Pluto, the moon should lie within the same plane as Pluto’s other four moons.
“The moons form a series of neatly nested orbits, a bit like Russian dolls,” says Mark Showalter of the SETI Institute in the US, who was also the leader of the scientific team that discovered the new moon. The team was intrigued that a dwarf planet such as Pluto can have such a complex collection of satellites and says that the new moon could provide further clues towards understanding how Pluto’s system has formed and evolved.
Pluto’s largest moon, Charon, was discovered in 1978. Further observations in 2006, again made by Hubble, uncovered two additional small moons, Nix and Hydra, and the fourth moon, known only as P4, was found last year. The new moon has provisionally been called P5.
NASA’s New Horizons space probe, which is currently en route to Pluto, has a high-speed fly-by scheduled for 2015. It will return the first ever detailed images of the Pluto system, which is so small and distant that even Hubble can barely see the largest features on its surface.
In the July issue of Physics World there is a thought-provoking article by the philosopher Robert P Crease in which he argues that athletes know the laws of “physics”, rather than “know” the laws of physics.
The distinction may sound a bit pedantic, but the point Crease is making is that professional athletes do possess physical knowledge of their sporting activities, deep within their flesh and bones. But this, Crease argues, is distinctly different from understanding sport on a theoretical level – understanding the laws of levers and vectors does not necessarily make you a successful gymnast, for example.
Please let us know what you think about this by answering this week’s poll question:
Could athletes benefit from an understanding of the physics of their sports?
Yes, it could help them to perfect their techniques No, any knowledge would be purely theoretical
Have your say by visiting our Facebook page, and please feel free to explain your response by posting a comment below the poll. And you can read Crease’s article in the July issue of Physics World, which is available for a limited time as a free PDF download. This special issue of the magazine looks at physics and sport, including features on the physical principles underpinning sport, and the roles technology plays in enabling and enhancing sporting performance.
So what happened in last week’s poll? Well, last Thursday we were still caught up in the frenzy that surrounded the big announcement from CERN that its scientists had discovered a new particle, which is almost certainly the Higgs boson. We asked you to try to step out of the excitement momentarily to consider the question: What is the most significant experimental discovery in particle physics?
Faced with a choice of seven responses, it turns out that our Facebook followers rank the Higgs boson discovery as the second most significant discovery, as it picked up 26% of the vote. In first place was Rutherford’s discovery of the atomic nucleus with 36% of the vote, and in third place was the electron with 17% of votes.
Thank you for all your responses and we look forward to hearing from you in this week’s poll.
Physicists in the US and UK have created a new metamaterial with a handendness, or “chirality”, that can be switched on demand. Operating in the terahertz region of the electromagnetic spectrum, the material can be used to manipulate the polarization of terahertz waves. It could therefore lead to new types of terahertz technologies for scanning and telecommunications.
The left – or right-handedness of an object plays an important role in defining how it interacts with the outside world. Many processes in biology, for example, are governed by the chirality of the molecules involved. Moreover, the chirality of a molecule or material affects how it interacts with electromagnetic radiation, which means that chirality can play an important role in the design of telecommunications and scanning technologies.
Terahertz electromagnetic radiation shows great promise for these applications because it passes easily through materials such as paper or clothes. It occurs at wavelengths of about 100 μm, which means that it can be manipulated by “metamaterials” – artificial structures of repeating elements each of which interacts in a specific way with electromagnetic radiation – that have a periodicity of roughly this length.
V-shaped resonators
In this latest work, Xiang Zhang of the Lawrence Berkeley National Laboratory and colleagues made a metamaterial that comprises “V”-shaped gold elements in a 2D array. A unit cell of the array is a square containing fours Vs, the vertices of which are arranged to point in an anticlockwise direction (see figure). The vertex and ends of each V are held up by gold pillars 4 μm tall, each of which is connected to a separate gold electrode. The unit cell itself is 50 μm on side and the entire structure rests on an aluminium oxide substrate.
Each of these 3D V-structures can be thought of as a pair of coupled split-ring resonators – structures that form the basis of many electromagnetic metamaterials. The important thing about the pair is that the resonators have opposite chirality, which means that each will absorb terahertz radiation of the opposite circular polarization. This ability to absorb radiation according to its polarization is known as circular dichroism.
Normally, the two resonators cancel each other out and the V-structure has no overall circular dichroism. But if an electrical connection is made between one resonator’s electrodes, then that resonator no longer functions and the V-structure acquires the chirality of the other working resonator. Zhang and colleagues make this connection from silicon, which – when exposed to infrared light – becomes a conductor.
The team also used a strip of silicon to extend the length of one of the electrodes. When light strikes this electrode, the capacitance of one of the resonators is changed. As a result the V-structure can be switched from a state in which both resonators exhibit circular dichroism at the same terahertz frequency, to a state where circular dichroism occurs at two different frequencies.
Switching chiralities
By putting four V-structures into each repeating unit cell, the team is able to create a metamaterial with circular dichroism that can be switched in direction when exposed to infrared light. “In contrast to previous demonstrations, where chirality was merely switched on or off in metamaterials using photoelectric stimulation, we used an optical switch to actually reverse the chirality of our terahertz [resonators],” explains Zhang.
The team says that the ability to control the chirality of the metamaterial could be used to create detection systems that are sensitive to the polarization of terahertz radiation. This could prove useful in terahertz scanning systems, which could detect the presence of certain molecules by how they interact with circularly polarized light. It could also be used to boost the transmission capacity of terahertz communications systems by allowing data to be encoded using circular polarization.
“This frequency range is particularly interesting because it uniquely reveals information about physical phenomena, such as the interactions between or within biologically relevant molecules, and may enable control of electronic states in novel material systems, such as cyclotron resonances in graphene and topological insulators,” says Antoinette Taylor of the Los Alamos National Laboratory, who was also involved in the research.
We can be seduced into thinking that the only requirements for a good sporting performance are sleek bikes, golden running shoes and hydrophobic swimsuits. I have often heard people say “It’s all about the equipment these days.” But how much does technology actually affect sport? We can test the latest equipment in the lab, on a running track or in a wind tunnel to prove that one design is better than another. But to understand its effect on real performances, the proof is in the outcome – the results we see at tournaments throughout the years. If a sporting technology really does make a difference, then surely it will be visible in the results.
One way of finding out how exactly technology affects sporting performance is to examine the physics involved. We can then try to quantify the effect of technology on sporting events – and find out whether it really is all about the equipment.
Results matter
Many researchers – including me – start investigating sporting performance by looking at world records or Olympic results. The problem with world records, though, is that there can be decades between results and they only ever improve, so you cannot tell if some technology or intervention has made things worse in the gaps. Olympic results are marginally better data because they occur (mostly) every four years. Olympic data, however, are very tournament specific; a windy or rainy day (very possible this year in London), or false-start disqualifications can mean that the results do not faithfully represent performance during that four-year period.
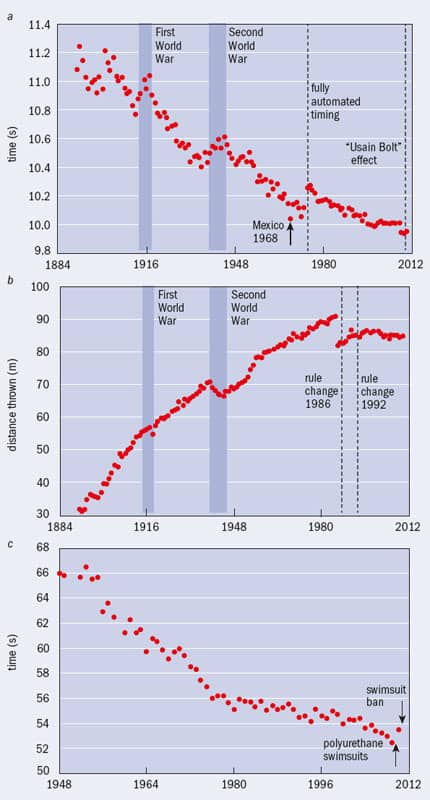
1 Essential evidence The average of the top 25 performances since 1891 in (a) the men’s 100 m sprint; (b) the javelin; and (c) the average of the top three performances in the women’s 100 m freestyle swimming since 1948 (fewer data are available for this event). Features common to all of the sports are improved performance with time, with significant decreases in performance during the two world wars. Within each sport, changes in altitude, mind set, equipment and rules have led to significant step-changes in performance.
In 2010 Leon Foster, then a sports-engineering PhD student at Sheffield Hallam University in the UK, used the mean of the top 25 performances in each year going back to 1891 to look at the effects of technology on various sports. Foster used the top performance of 25 different athletes so that each athlete was used only once. There are three advantages of these data: they minimize the chance of outliers, which could appear if only the best individual is studied; there are 120 or so consecutive years of data; and they can reveal the deterioration as well as improvement in performance. What Foster found was that from 1891 to 2010 the men’s 100 m sprint times have got faster by about 1 s (figure 1a), while the men’s javelin has improved by 60 m (figure 1b). Figure 1c shows the best available data for swimming – the average of the top three times in the women’s 100 m freestyle from 1948 to 2010, which has decreased by around 13 s over that period. Common to all three sports are that performance tends to get better over time but also appears to be levelling off; and that the First and Second World Wars reduced performance dramatically.
A significant step forward in understanding the general underlying improvement in these three sports (ignoring for now the blips and step-changes) came in 2008 when Mark Denny, a professor of biomechanics at Stanford University in the US, examined the effects of population increase on running speeds in greyhounds, racehorses and humans. He started with the principle that the larger a population, the likelier it is that exceptional performances will be found by chance alone. He showed that although running performance increased as global population increased, the performance of greyhounds and racehorses has reached a plateau, which Denny put down to intensive selective breeding having already produced the optimum performance qualities in these species. But the performance of humans has not yet levelled off, indicating that there is further improvement yet to be seen. The effect of the First and Second World Wars seen in figure 1, then, was to decrease the population available to compete (as well as the number of competitions), so that performance declined. The general improvements in nutrition, coaching, access to facilities as well as population increase produce an underlying improvement that exists in all sports.
100 m sprint
So, what of technological improvements specific to running? There is an obvious step-change in the statistics for the men’s 100 m in the mid-1970s. It is caused by technology, but perhaps not the one you might have expected: it is down to the introduction of fully automated timing – and it lengthened recorded running times by about 0.2 s.
In previous years sprint times had been measured by judges, who started their stopwatch when the pistol fired and stopped it when the athlete crossed the finish line. However, the natural reaction time of the human body meant that there was a delay between the gun going off and the judge starting their stopwatch, while at the end of the race the judges could be more accurate as they could anticipate when an athlete would cross the finish line. Overall, this caused recorded times to be shorter than the sprinters’ actual times.
Fully automated timing does away with judge error as it records the time between the bang of the starter pistol and the finish, using a light beam across the finish line, to an accuracy of 0.01 s. Instrumented starting blocks are used so that a false start is registered if the athlete moves within 0.1 s of the pistol being fired, which is deemed to be the limit of human reactions. In fact, the International Association of Athletics Federations (IAAF) now adds on 0.24 s to hand-timed 100 m results when comparing them with times measured electronically.
The average of the top 25 times for 1968 of 10.04 s stands out as an exception: it is shorter than that for 1967 or 1969 by 0.1 s. Looking in the record books, the most obvious explanation is that the Olympics took place that year in Mexico City at a height of around 2300 m above sea level. To understand the consequence of this it is useful to know that the drag force on a body moving through a fluid of density ρ at speed v is ρACdv2/2, where A is the cross-sectional area of the body presented to the air and Cd is the drag coefficient of the athlete. The air density at Mexico City’s altitude is about 80% that at sea level, which means that the drag force would reduce proportionately, leading to a faster run. (Sprinters run aerobically so they are relatively unaffected by the lowered oxygen levels of high altitude during the race.) Although the Olympics was only one of the competitions held in 1968, athletes trained and competed at altitude in preparation for it, so that of the top 25 performances, a third were at altitude, leading to a distinct improvement in the 100 m performance for the whole of 1968.
Speed demon Usain Bolt powered to his 100 m world record of 9.58 s at the 2009 World Athletics Championships in Berlin, knocking 0.11 s off his previous world record, achieved at the Beijing Olympic Games in 2008. His record has not been beaten yet, but could it be one to keep an eye on? (Courtesy: Christophe Karaba/epa/Corbis)
There is also a sustained step-change in average performance in the 100 m of 0.06 s in 2008 – the year when Jamaica’s Usain Bolt stormed onto the scene. It is tempting to guess that this effect is all down to Usain Bolt’s extraordinary time of 9.69 s in Beijing, but if his time is removed so that the average is taken of the remaining 24 athletes, then the step-change is almost the same. It appears, then, that these tremendous athletes suddenly competed at an even higher level than before because of the dramatic performance of their peer Usain Bolt.
Javelin throw
The most obvious feature of the men’s javelin is the downward step-change in the mid-1980s. Around this time, average distances thrown were more than 90 m, with one astounding throw of 104.8 m by Uwe Hohn in 1984. However, there was an issue at the time that made the event difficult to adjudicate: the javelin would seemingly float to the ground and land flat, so that it was hard to tell whether the tip had landed first – the main requirement in javelin competitions. To solve this, the IAAF decided to change the specifications of the javelin itself by moving its centre of mass towards the tip by 4 cm. The effect of this was to keep the nose down, reduce lift while it was in the air and force the javelin to land tip first about 9 m shorter than previously. Given that throws over 100 m were potentially endangering spectators – with javelins being hurled almost the full length of a sports stadium – this was seen as a success by the IAAF.
Following this rule change, alternative javelin designs appeared in the early 1990s with roughening or dimples (similar to those on a golf ball) on the tail to change the drag characteristics. This helped improve performances and counter the previous rule change, but ultimately a ban on these tail features was imposed at the end of 1991 (just visible in figure 1b). Performances have now levelled off at a top-25 average of around 84.5 m, which clearly falls short of the distances achieved before the rule change. The authorities handled the issue of world records by having a “new rules” world record for throws after the 1986 rule change and they even nullified some records between 1986 and 1991 rather than creating a new-new-rules world record in this period, when increasingly aerodynamic surfaces were being used. The pre-rule-change world record of 104.8 m is unlikely ever to be beaten.
100 m freestyle
Performance enhancing The now outlawed tight-fitting full-body swimsuits used from 2008 to 2009 reduced the cross-sectional area and the drag coefficient of the swimmer, leading to reduced drag through the water and improved performances. (Courtesy: REUTERS/Jean-Paul Pelissier)
Swimming went through a tricky period between 2008 and 2010: an unprecedented 25 and 47 world records were broken in 2008 and 2009, respectively, with new technologies seen as the main cause. So although times in the women’s 100 m freestyle had gradually dropped by 12.6 s between 1948 and 2008, there was a sudden fall in 2009. This coincided with the introduction of full-body swimsuits with polyurethane panels.
The formula for drag force, mentioned earlier, can be used to understand how the new swimsuits might have improved performance. They were relatively tight and reduced the cross-sectional area of the body, A, by pulling it into a more cylindrical shape, thus reducing drag. Also, the polyurethane affected the way the water flowed over the body and effectively reduced Cd by reducing skin friction, as evident in the reduced size of the wake. A further effect was on the dynamics of the human body itself: the stiff suits stopped the relatively soft tissues wobbling, which reduced any transient changes in A or Cd during the swimming action. A further claim is that the suit trapped air, which increases buoyancy and allows the swimmer to float higher and more horizontally in the water.
On 1 January 2010 FINA (the ruling body of swimming) banned the full-body polyurethane swimsuits – a feature clearly seen in the data. As a consequence some records may not be broken for quite some time. Perhaps FINA should have created a “new rules” world record, as the IAAF did with the javelin.
Quantifying performance
One obvious problem with comparing performance across events is that the units of measurement are different, being either in metres or seconds, for example. The 100 m sprint time, for example, has decreased by about 10% in 120 years, while the javelin distance has increased by 165%. But these numbers are not necessarily valid comparisons. It is difficult to fairly compare two performances within a single sport, let alone compare performances across different sports, or quantify the effects of technologies or rule changes.
To tackle this dilemma, in 2009 I came up with the idea of the performance improvement index (PII). This works on the principle of using simple equations to determine the useful work done in a performance. For instance, the performance measure in the pole- vault is the height of the bar, so an approximation to the potential energy in the jump is mgh for an athlete of mass m. If we take a baseline performance h1 for our comparison, then the height of any other jump h2 can be compared using (work)2/(work)1 = (mgh)2/(mgh)1.
If we use an average of the top 25 athletes, then the average mass is not likely to change too much so that the PII is the ratio h2/h1. For example, comparing the top-25 average performance in the pole vault in 2010 of 5.76 m to the 4.26 m average for 1948 gives an index of 1.23 (equating to an improvement of 23%).
Then and now Historical black-and-white photo of a man throwing a javelin and modern colour photo of World Record holder Jan Zelezný throwing a javelin in 2003. (Courtesy: Olivier Prevosto/Photo & Co./Corbis).
For a throwing event such as the javelin, the PII works out as d2/d1, where a throw of distance d2 is compared with a baseline performance d1. Comparing the top-25 average of the men’s javelin in 2010 of 84.78 m with that in 1948 of 68.81 m gives a PII of 1.35 (equating to an improvement of 35%).
In running, the dominant retarding force is the ubiquitous drag force. The PII here – a ratio of work done (force × distance) for two events – simplifies to the square of the inverse ratio of the times taken to run the race: (t1/t2)2. This assumes fixed air density and distance, and that the top-25 average ACd is a constant over time. As an example, the top-25 average of the men’s 100 m sprint in 1948 was 10.42 s. Comparing this with the average of 9.96 s in 2010 gives a PII of 1.10 (or a 10% increase).
The same PII equation can be used for swimming, where hydrodynamic drag is also the dominant retarding force. In the women’s 100 m freestyle, the 12.4 s decrease between 1948 and 2010 equates to a PII of 1.52 (or a 52% increase).
One to watch
2 Performance quantified The performance-improvement index for the men’s 100 m sprint and javelin, and the women’s 100 m freestyle swimming. The index for each sport, based on simple physics equations of the work done by the athlete, allows a single performance to be compared with a baseline performance – here, the mean top performances in each sport in 1948. This allows comparison between sports, getting around the fact that, for example, it does not make much sense to compare a 16 m improvement in javelin throw to a 0.5 s reduction in sprint time.
These PII equations can be used to compare performance change within or across sports and to quantify the effect of technologies or any other effect visible in the data. For example, figure 2 compares the PII for the men’s 100 m sprint and javelin, and the women’s 100 m freestyle swimming, using the post-war performances of 1948 as a baseline.
PII values for the 100 m sprint can be seen to have increased by around 10% by 2010, with fully automated timing causing a decrease of 2.8% in 1974. The year 1968 saw a transient 2.2% improvement caused by performances at altitude, while the “Usain Bolt effect” since 2008 has caused a boost of 1.4%. The 1986 javelin rule change – moving the centre of mass – reduced performance by about 13%, while the 1991 rule change about aerodynamics further reduced it by 2.4%. The 2010 ban on full-body polyurethane swimsuits lowered the PII in the women’s 100 m freestyle by around 6.1%, showing the approximate gain they must have given. There is also a steep rise of more than 10% between 1970 and 1976, which is likely caused by something that is less controversial these days – the introduction of hats and goggles, and the concept of shaving off body hair to reduce drag.
So what can we expect this summer? Of the sports studied here, the javelin is the least likely to show significant improvement, as it appears to have reached a plateau. In swimming, there will be few world records in the sprint events because of the swimsuit ban. If there are any records in swimming, they are likely to be in the long-distance events where the suits had less effect (possibly because their stiffness caused an increase in fatigue).
The data point toward the men’s 100 m sprint being one event not to miss. The top-25 average coming into 2012 is already consistently below 10 s, so expect fast performances and extreme rivalry. Weather permitting, of course.
At a glance: Elite performance
Sporting performance has improved over time because of population increase, improved nutrition, coaching and access to facilities
In addition, there have been step-changes and blips in performance caused by new technologies, rule changes and more abstract causes such as the “Usain Bolt effect”
The amount by which these steps and blips affect performance can be quantified using the “performance improvement index” (PII)
The PII can also be used to compare performances within and across sports, and to predict in which events to look out for new world records
More about: Elite performance
M W Denny 2008 Limits to running speed in dogs, horses and humans J. Exp. Biol. 211 3836
L Foster, D James and S J Haake 2010 Understanding the influence of population size on athletic performance Procedia Engineering 2 3183
S Haake 2009 The impact of technology on sporting performance in Olympic sports J. Sports Sci. 27 1421
A week ago today, physicists at CERN announced that they have discovered a “Higgs-like” boson. But is it the Higgs boson as described by the Standard Model of particle physics?
The answer to that question is “we don’t know yet”, and the race is on to interpret the results presented last week by the CMS and ATLAS experiments on the Large Hadron Collider (LHC).
Famous for being quick off the mark when new data are available, Dan Hooper of Fermilab has teamed up with colleague Mathew Buckley to look for hints of supersymmetry (SUSY). In a preprint uploaded to arXiv just one day after the announcement, Buckley and Hooper focus on the decay of the Higgs via two gamma rays (the diphoton channel) and via two gluons (the gg channel).
While the diphoton channel is relatively straightforward to study at the LHC, the gg channel cannot be seen because the colliding protons produce so many background particles that the decay cannot be isolated. However, Higgs bosons are produced in the LHC by the reverse process – the fusion of two gluons. The rate at which this fusion occurs is related to the rate at which the Higgs decays to gg.
Unlike other Higgs-producing processes, gg fusion does not produce additional particles such as a W or Z boson. As a result, physicists are able to get a handle on the gg fusion rate by looking at Higgs decays that aren’t associated with these other particles.
Putting all of this together, Buckley and Hooper figure that the diphoton decay rate is about three times higher than predicted by the Standard Model, whereas the gg decay rate is about half of that expected.
What could this mean? The Fermilab pair thinks that it could be emerging evidence for SUSY. Specifically, it could point to the existence of a scalar top supersymmetric quark (stop squark), which is the supersymmetric partner of the top quark. Unlike the top quark, which is by far the heaviest quark, the stop is expected to be a lightweight squark – which Buckley and Hooper say fits their analysis.
Hooper is fast, but not as quick as his Midwestern colleagues Ian Low, Joseph Lykken and Gabe Shaughnessey – who uploaded a paper on 4 July, the day the announcement was made. The paper was uploaded shortly before 20:00 GMT, so assuming the trio had no prior knowledge of the announcement, it must have been written in less than 11 hours!
In their paper on arXiv, the researchers point out that the observed Higgs decay rates are consistent with the existence of a “Higgs imposter” – a particle that looks like a Higgs but isn’t a Higgs.
While both papers are interesting, I should point out that the CMS and ATLAS data are also consistent with a boring old Standard Model Higgs boson, and more data are needed before we know the exact nature of what was discovered last week at CERN.
Researchers in Spain and the US have discovered that ultraslow waves occur during the expansion of living tissue. These waves could explain how cells migrate to the right places for an organism to grow, repair itself or develop tumours.
Growth, repair and the development of tumours are all processes that involve the expansion of a monolayer of cells, or “epithelial expansion”. If you have a small wound, for example, the wound will form a scab and, beneath that, a matrix for the construction of new tissue. But in the final stage, a monolayer of cells will migrate from undamaged tissue to form a new outer-boundary layer.
Understanding this migration has been difficult. The dynamics of the protein network or “cytoskeleton” within cells that governs cell propulsion occurs at speeds of several microns per second. However, cell motion itself is stifled by viscous drag and is therefore thousands of times slower, at just a few microns per hour. Such a disparity has troubled scientists, who are trying to explain how the migration is guided. Experiments on cell cultures have revealed the production and spatial distribution of mechanical forces during migration. Nonetheless, a complete description of the mechanical forces – and the rules that govern them – has in the past been out of reach.
Measuring forces
Xavier Trepat and colleagues at the Institute for Bioengineering of Catalonia in Barcelona and Harvard University have now found a way to tease out some of these mechanical rules. They grew a monolayer culture of canine epithelial cells within a mask and then removed the mask to study the subsequent expansion. Using techniques known as traction-force microscopy and monolayer-stress microscopy, the researchers measured the expansion and mechanical forces in one dimension. To their surprise, they discovered wave-like crests that formed at the edges of the cell monolayer and propagated inwards at roughly twice the speed of the cells’ migration.
The wave is a bit like a traffic jam seen from above, says Trepat. Like stopping and starting cars, the cells ripple in density throughout the monolayer. This happens slowly, at about 1 mm per day. The wave transmits mechanical stress from the moving front of the monolayer to the centre of the group. Although the researchers cannot be sure of the function of the wave, they believe that it might help control the cell monolayer’s movement.
Signalling with a wave
Biomedical engineer Yu-li Wang of Carnegie Mellon University in the US thinks the discovery adds to a body of evidence that suggests that cells cannot just communicate via chemical signals, but via mechanical signals too. “The kind of waves described in this paper is predictable although never demonstrated,” he says.
Biophysicist Rhoda Hawkins at the University of Sheffield, UK, agrees. “[The study] shows the importance of [the] physical properties of such cellular systems,” she says. “Cells are not just bags of chemicals – they interact mechanically with the environment and each other.” She adds, however, that because the researchers did not provoke the cell expansion by cutting, the results are probably more relevant to cancer growth than wound healing.
Trepat says that his group is now going to investigate whether the waves exist in other types of tissue and whether there is any interplay with chemical signalling. “So, how this mechanical wave talks to the biochemistry,” he adds.
A new way to extend the lifetimes of charge carriers in solar cells has been unveiled by researchers in Spain. The technique involves creating an aggregate of two different kinds of quantum dots, which can be made using low-cost solution-processing techniques. According to the researchers, the method could be used to boost the performance of solar cells – even those based on photovoltaic materials that have relatively poor optoelectronic properties.
Solution-processed inorganic solar cells are made by depositing layers of quantum dots – tiny pieces of semiconductor – in colloidal suspension. The devices have shown much promise because they can absorb light over a wide spectrum of wavelengths. This is a result of the fact that the electronic band gaps in a quantum dot can be tuned over a large energy range by simply changing the size of the dot. They are also comparatively cheap to produce.
However, only a limited number of materials have been exploited in this type of solar cell. When light is absorbed by a solar cell it liberates pairs of charge carriers (electrons and holes), which must endure for a long enough time to travel through the device to where they can become a useful electrical current. The problem is that only a handful of materials – two common examples being lead- or cadmium-based quantum dots – have carrier lifetimes that are long enough.
Avoiding toxic elements
“However, lead- and cadmium-based quantum dots are based on toxic elements, so we researchers are actively looking for other, safer materials, even if their optoelectronic properties are poorer – but then we need a device structure to accommodate them in a useful way,” explains Gerasimos Konstantatos of the Institut de Ciències Fotoniques in Barcelona, who led this latest research.
Konstantatos’s team created a “bulk nano-heterojunction” in a solar-cell device consisting of p-type and n-type semiconductors. The two materials were mixed in such a way that, when exposed to sunlight, photogenerated electron-hole pairs were then able to separate at the nanoscale and travel along the device via two very different paths, something that reduced the chances of them recombining.
The device consisted of a nanocomposite comprising a mixture of p-type PbS quantum dots and n-type Bi2Si3 quantum dots (see figure). This mixture is sandwiched between a layer of pure Bi2Si3 quantum dots – which transports electrons and blocks holes – and a layer of PbS quantum dots, which has the opposite transport properties. To determine the relative efficacy of the mixture layer, the team also made “bilayer devices” with an abrupt junction between the two types of quantum dots. Konstantatos and colleagues found that the power-conversion efficiency of the bulk nano-heterojunction devices was found to be around 4.8%, a value that is three times higher than the bilayer devices with sharp junctions.
Longer lifetimes
To work out the reason for this improved efficiency, team member Arup Rath and colleagues set about measuring the lifetimes of charge carriers in the devices while exposing the cells to varying optical intensities. Although both devices show long lifetimes at low light intensity, at higher intensities similar to sunlight, the device contains carriers with shorter lifetimes because electron and holes combine at a faster rate here. Carriers in the bulk nano-heterojunction device, on the other hand, appear to last three times longer than in the bilayer structure since electrons and holes recombine at a significantly slower rate.
“Although the power-conversion efficiency of our cells is still a bit lower than record efficiency devices based on PbS quantum dots and titania n-type electrodes, it does demonstrate the proof-of-principle,” Konstantatos says. “What is more, unlike previous studies that relied on either sputtered oxide-electron acceptors or high-temperature sintering at 500 °C, our technique works using a fully solution-based process and at low temperatures of less than 100 °C – non-negligible advantages for low-cost roll-to-roll manufacturing, for example.”