They were menacing enough before, but how would you feel if you knew sharks were employing advanced mathematical concepts in their hunt for the kill? Well, this is the case, according to new research, which has tracked the movement of these marine predators along with a number of other species as they foraged for prey in the Pacific and Atlantic oceans. The results showed that these animals hunt for food by alternating between Brownian motion and Lévy flights, depending on the scarcity of prey.
Lévy flight is a special class of movement characterized by many small steps punctuated by longer relocations. As the patterns show little invariance over a range of different scales, the processes associated with these movements are closely linked with fractal geometry. For instance, it has been suggested that the colourful squiggles that characterize the work of Jackson Pollock, the celebrated abstract painter, were created as his brush took a number of Lévy flights.
For the past decade, several biologists have been claiming that certain animals may also be using Lévy flights to maximize their chances of encountering prey when there is not much choice on offer. The suggestion is that they revert to this from the more random, Brownian, motion that they follow when prey is available in abundance. This hypothesis, however, has never been tested on wild animals, and it is difficult to separate the movement of animals into its different phases, which also include resting and migration.
Over 12 million movements
In new research, David Sims at the Marine Biological Association Laboratory in Plymouth, UK, working with colleagues in Europe and the US, has carried out the first large-scale survey to track the movement of foraging marine predators. Sims’ team attached electronic tags to animals from 14 different species including silky sharks (Carcharhinus falciformis) and yellowfin tuna (Thunnus albacares). 55 individuals were tracked over 12 million movements in the north-east Atlantic and the eastern and northern Pacific.
By analysing the results as a time series, the researchers were able to break down the results into sections that showed more consistent behaviour than the whole. They found that found that the sharks, tuna, billfish and ocean sunfish showed movement patterns well approximated by a Lévy walk, but that they also showed Brownian-type motion. Closer analysis revealed that individuals were switching between Lévy and Brownian movements, consistent with the idea that predators adjust their movement depending on the abundance of prey.
“We used the most reliable and robust statistical analyses on the largest data set yet analysed in this way,” Sims told physicsworld.com.
Managing stocks more effectively
“The results show that to a certain degree the movements of animals are predictable in relation to habitat types they encounter. In the case of fish, we think this will help parameterize a new wave of spatially structured population models that will help us to manage stocks more effectively in the face of overfishing and climate change, for example,” says Sims.
But despite the scale of the research, not all researchers are convinced that the research provides a particularly complete picture of marine foraging. “In this study predators are considered as fully stupid, unable to process environmental information and to act accordingly,” says Simon Benhamou, a marine ecologist at the Center for Functional and Evolutionary Ecology in France. Benhamou feels that future studies should take a more integrated approach including neuroscience, ethology and behavioural ecology.
Sims and his team intend to develop their research by tracking the foraging paths of other marine species, lower down the food chain, including octopuses and marine snails.
Astronomers using the Very Large Telescope (VLT) have caught an unprecedented glimpse of an exoplanet moving in its orbit around a distant star. Called Beta Pictoris b, the exoplanet has been directly imaged in two separate points covering nearly half of its orbit. The achievement could prove a significant stepping stone in our understanding of how planetary systems, including our own solar system, formed.
Since the discovery of the first extra-solar planet – or exoplanet – in 1995, over 450 more have subsequently been unveiled. Most of these other worlds have been indirectly inferred from their effect on the motion or light of their host stars. This latest research adds Beta Pictoris b to the handful of exoplanets actually captured on camera. The planet, with a mass of about nine Jupiters and orbiting as far from the star Beta Pictoris as Saturn does from the Sun, had been predicted to exist ever since its host star became the first to be found with a dusty disc of debris encircling it in 1984.
Subsequent investigation found that this disk was significantly warped and the presence of a planet was hypothesized to account for it. However, direct evidence of its existence had eluded researchers until now. “There were all these clues that there should be a planet orbiting the star but these were indications and not proof. Before these images we couldn’t be sure,” lead investigator Anne-Marie Lagrange, of the Laboratoire d’Astrophysique de l’Observatoire de Grenoble (LAOG), tells physicsworld.com.
Planet or rogue?
Not only have we confirmed it is a planet but we have seen it move almost half an orbit Anne-Marie Lagrange, LAOG
In fact, Beta Pictoris b was first directly imaged in 2003 using the European Southern Observatory’s VLT, but the team couldn’t be sure that it was a planet and not some other rogue source. It was spotted again in 2009 and improvements in observing techniques allowed astronomers to conclude that it is indeed an exoplanet – and that it had moved from its original position. “The source we detected in 2003 was in the north-east part of the disc and now it is in the south-west of the disc. Not only have we confirmed it is a planet but we have seen it move almost half an orbit,” Lagrange says.
Beta Pictoris completed a little under half an orbit in six years, allowing Lagrange and team to estimate that the giant planet orbits at a distance 8–15 times further away than the Earth orbits the Sun. Pinning down its motion opens the door to calculating many of the planet’s other characteristics, a chance Lagrange is keen to exploit.
“It is important because on a very short time scale, in terms of an astronomer’s life, we have the opportunity to follow the complete orbit of an extrasolar planet. This will allow us to far more accurately model the history of the planet’s formation,” she says.
Modelling planet formation
This unprecedented chance to watch a planet sweep through the dust around its star is one that fellow planet hunter Carole Haswell, of the Open University, finds exciting. “This research is going to have a big impact. There is going to be a lot of theoretical work that will use this discovery as a touchstone to make sure that they are doing the right thing when it comes to modelling planet formation,” she says.
Coel Hellier of Keele University who, like Haswell, studies exoplanets but was also not involved in the research, sees echoes our own planetary system in Lagrange’s findings. “What we are seeing in Beta Pictoris is probably a very young example of what previously happened in our own solar system; Jupiter and Saturn probably formed in the same way as the planet seen in Beta Pictoris,” he explains.
Researchers in the US have used a high-speed camera to watch the bursting behaviour of bubbles lying on the surface of a glass slide – and found they burst in a cascade that produces increasingly smaller bubbles and eventually jets of liquid. The study, carried out by Jacy Bird and colleagues at Harvard University, could help to improve processes used to make foamy materials. It could also boost our understanding of how ocean bubbles inject aerosols into the atmosphere.
Bird was inspired to do the research after noticing that a ring of small bubbles is produced when a large bubble bursts on a surface. To study the process in more detail, the team covered a glass slide in a film of water plus surfactant and then used a syringe to blow a bubble that is a centimetre or so in diameter. The bubble, which remains on the slide and therefore assumes a hemispherical shape, was pierced at its summit. The researchers then used their high-speed camera to see what happens next.
The bursting was seen to occur in two distinct steps. Once the bubble is pierced, capillary forces – that beforehand squeeze the bubble and pressurize the air inside – expand the initial hole at the top of the bubble. The pressurized gas inside the bubble escapes through this hole, causing the liquid film away from the hole to move inwards. However, the liquid right at the edge of the hole has gained enough inertia to continue to move outwards and thus resists the inward pull of the collapsing bubble.
Unstable doughnuts
According to Bird, the resulting tug-of-war stretches out the rim and creates a sharp fold (see “Folding the rim”). When the rim reaches the glass surface, the fold entraps the air beneath it to create two concentric doughnut-shaped bubbles. This all occurs in about 3 ms.
However, these doughnut bubbles are unstable and, in the second step of the process, they begin to break up over a period of about 50 ms into a ring of smaller hemispherical “daughter” bubbles on the surface. The team was then able to pop these daughter bubbles when they were on a solid surface and saw the same process over again. However, on a liquid surface, the daughter bubbles penetrate the liquid so that they are no longer hemispherical. In this case, their collapse resulted in narrow jets of liquid rising from the surface.
The team repeated its experiment using a number of liquids with different viscosities and surface tensions and with bubbles of different radii. Three distinct type of behaviour were observed.
In silicone oils, which are very viscous and have a low surface tension, no daughter bubbles were formed. However, in glycerol-water-soap solutions – with intermediate values of viscosity and surface tension – daughter bubbles were formed by two concentric rings. Finally, using samples of local river water, which have low viscosity and high surface tension, they found that the bubbles collapsed to form a single ring and also formed daughter bubbles.
Fine tuning foams
Armed with these observations, Bird and colleagues were then able to create a mathematical model that reproduced the folding effect. Bird believes that a better understanding of this cascade process could help researchers to fine tune processes for making foams. “We are currently trying to understand the implications for industry,” he told physicsworld.com.
Bird is also interested in looking at bubbles in more exotic materials including lava – the results of which could lead to the development of new ways of studying the properties of molten rock. “Pictures of lava bubbles could tell us something about lava that can’t be measured directly because the material is too hot,” he says.
Bird also believes that the research could further our understanding of the atmosphere because jets emerging from bubbles on the surface of the oceans are known to be a major source of aerosols. In particular, the research could help scientists gain a better understanding of how different sized bubbles affect this process.
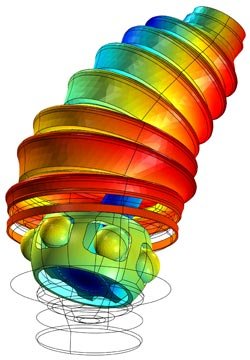
COMSOL Multiphysics in action: Courtesy Metelli SpA (Cologne, Italy)
By Joe McEntee, group editor, in Boston
I’ve been on something of an east-coast road trip this past week – Washington DC, Philadelphia, Boston and several points inbetween.
Just outside Boston, in the high-tech corridor in and around Burlington, Massachusetts, I spent a morning at the North American headquarters of COMSOL, a firm that develops the COMSOL Multiphysics software platform for the modelling and simulation of all manner of physics-based systems.
Regular readers of physicsworld.com will doubtless be familiar with COMSOL Multiphysics and its range of scientific applications. If you’re not, you can get up to speed easily enough by checking out COMSOL’s series of popular tutorial webinars over on the multimedia channel.
Webinars aside, COMSOL is also a player in the live-events business. Planning for the company’s sixth annual user conference in Boston (7–9 October 2010) is well advanced, according to Bernt Nilsson, COMSOL’s senior vice-president of marketing.
“The conference is a great way to create community – to get COMSOL Multiphysics users together so that they can share ideas and learn from others about the software tools used to solve physics problems,” Nilsson told me.
He described the user conference as “a smorgasbord of different applications”, spanning acoustics, computational fluid dynamics, electromagnetics, batteries and fuel cells, and many other areas of physics.
For the record, last year’s conference in Boston pulled in 300 delegates from 11 countries with a programme comprising more than 130 user presentations and a supporting schedule of Multiphysics courses and tutorial sessions.
Right now, scientists and engineers are being invited to submit abstracts describing projects in which COMSOL Multiphysics has played a key role. If your submission gets accepted, you’ll be invited to present your work at the conference and submit a paper or poster for the CD version of the proceedings (more than 100,000 of which are distributed to COMSOL’s worldwide contacts).
P.S. Don’t miss the next instalment in COMSOL’s webinar series, “Plasma modelling with COMSOL Multiphysics”, which is scheduled for Thursday 17 June at 10.00 a.m. BST on physicsworld.com. Click here to register.
In the land of theoretical physics, equations have always been king. Indeed, it would probably be fair to caricature theoretical physicists as members of a company called “Equations-R-Us”, since we tend to view new equations as markers of progress. The modern era of equation prediction began with Maxwell in 1861, continued through the development of Einstein’s equations of general relativity in 1916 and reached its first peak in the 1920s with the Schrödinger and Dirac equations. Then a second, postwar surge saw the development of equations describing the strong force and the electroweak force, culminating in the creation of the Standard Model of particle physics in about 1973. The equations trend continues today, with the ongoing struggle to create comprehensive equations to describe superstring theory. This effort – which aims to incorporate the force of gravity into physical models in a way that the Standard Model does not – marks the extant boundary of a long tradition.
Yet equations are not the only story. To an extent, geometrical representations of physical theories have also been useful when correctly applied. The most famous incorrect geometrical representation in physics is probably Johannes Kepler’s model of planetary orbits; initially, Kepler believed the orbits could be described by five regular polygons successively embedded within each other, but he abandoned this proposition when more accurate data became available. A less well known but much more successful example of geometry applied to physics is Murray Gell-Mann’s “eightfold way”, which is a means of organizing subatomic particles. This organization has an underlying explanation using triangles with quarks located at the vertices.
Like their African forebears, mathematical adinkras represent concepts that are difficult to express in words, and they may even contain hints of something more profound
For the past five years, I and a group of my colleagues (including Charles Doran, Michael Faux, Tristan Hubsch, Kevin Iga, Greg Landweber and others) have been following the geometric-physics path pioneered by Kepler and Gell-Mann. The geometric objects that interest us are not triangles or octagons, but more complicated figures known as “adinkras”, a name Faux suggested. The word “adinkra” is of West African etymology, and it originally referred to visual symbols created by the Akan people of Ghana and the Gyamen of Côte d’Ivoire to represent concepts or aphorisms. However, the mathematical adinkras we study are really only linked to those African symbols by name. Even so, it must be acknowledged that, like their forebears, mathematical adinkras also represent concepts that are difficult to express in words. Most intriguingly, they may even contain hints of something more profound – including the idea that our universe could be a computer simulation, as in the Matrix films.
If you knew SUSY like we know SUSY…
To understand what adinkras are, we must first examine the physical theory to which they relate: supersymmetry, commonly abbreviated as SUSY. The concept of symmetry is ubiquitous in nature, but on a more technical level it has been a powerful mathematical tool for the development of equations. Einstein recognized that there was a symmetry between the effects observed by someone in an accelerating spacecraft far away from all planets and those observed by someone standing on the planet’s surface. He called this recognition the “happiest thought” of his life, and he used it to determine the form of his equations of general relativity, which describe how matter warps space and time to create gravity.
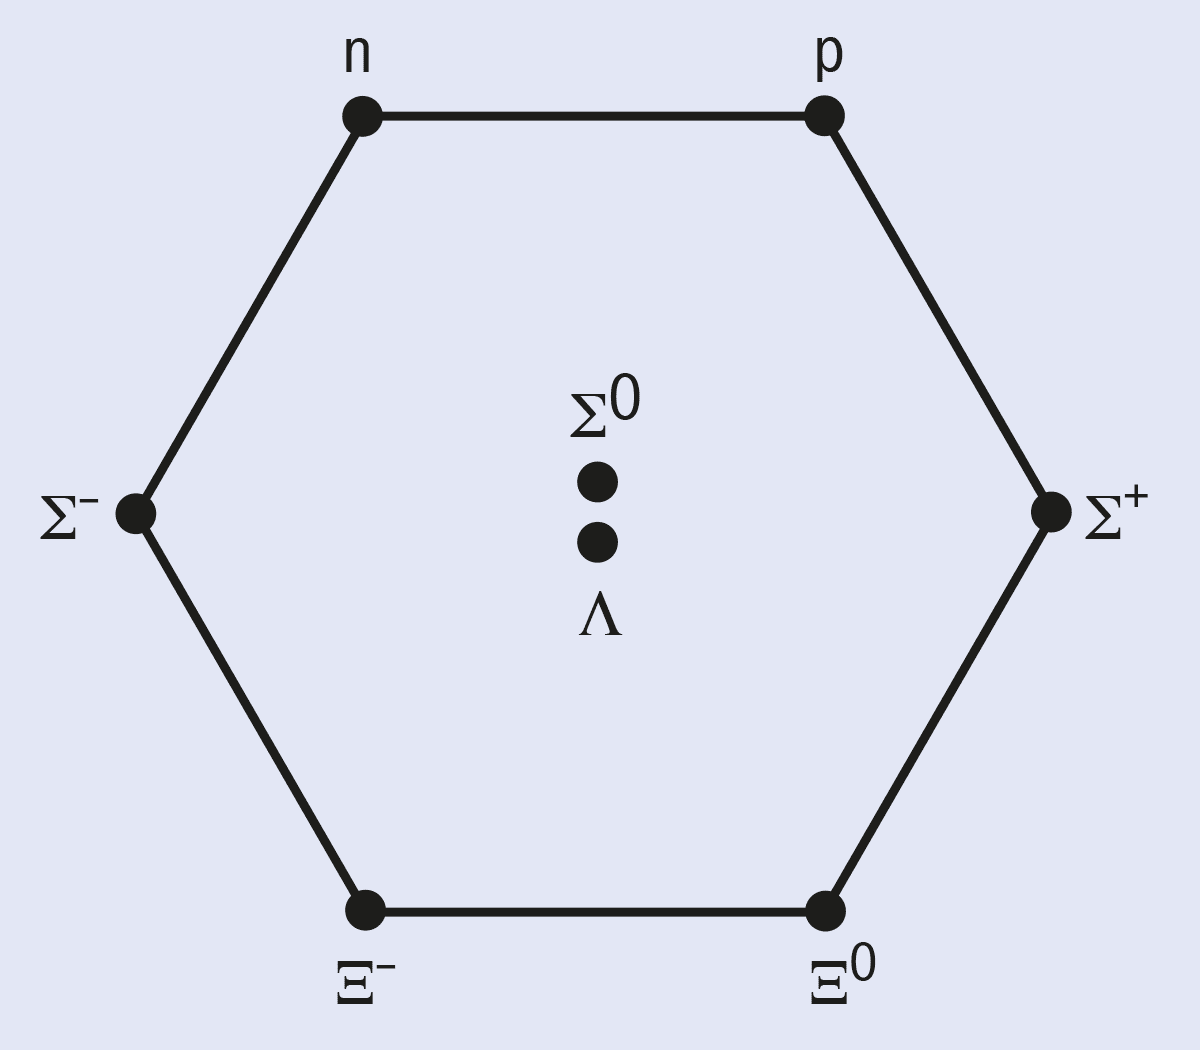
Moving on to the Standard Model, the set of equations used to describe the physics of quarks, leptons (the family of particles that contains the electron) and force-carrying particles like the photon (carrier of the electromagnetic force) is also largely determined by symmetry groups. Photons, for example, possess a type of symmetry known as U(1), which means that two distinct photons can produce the same electric and magnetic forces on a charged particle. Another important symmetry is the SU(3) symmetry of quarks, which can be visualized using what mathematicians call a “weight-space diagram” (figure 1). This diagram shows the entire family of nuclear particles of which the proton, p, and neutron, n, are members. The location of particles in this diagram is determined by particle properties called isospin and strangeness, the values of which were first measured in the 1950s and 1960s. Six triangles lurk inside it – you can see them if you draw lines from the centre to each vertex – and this “triangular” symmetry is part of what leads to the designation SU(3).
1 Weight-space diagrams
This weight-space diagram shows the “baryon octet” group of particles, including the proton (p), neutron (n) and six more exotic species known as hyperons. Particles are arranged according to their isospin (how they interact with the strong nuclear force) and the number of strange quarks they contain (their “strangeness”).
Such diagrams are more than pictures. In fact, it was an insight drawn from such diagrams that led Gell-Mann and George Zweig to a new understanding of nuclear matter. Gell-Mann and Zweig realized that patterns in diagrams showing families of nuclear particles meant that those particles must be made up of smaller, more fundamental particles: quarks. The nuclear-particle octet diagram gets its name because there are particles associated with each of its six vertices, and two additional particles associated with its centre, hence an “octet” of particles. This diagram is useful as a kind of accounting tool: in certain nuclear reactions, two or more experiments will lead to simply related results if one member of this family is replaced by another. For example, measuring how a proton is deflected from a neutron by the strong nuclear force will yield a result that is directly related to the deflection of a Σ– particle from a neutron. This is the power of using symmetries. When we know that certain symmetries are present in nature, we can use one experiment to predict the outcome of many others.
As its name implies, the theory of supersymmetry takes the idea of symmetry a step further. In the Standard Model there is a dichotomy between leptons and quarks – collectively called “matter particles” – and force-carrying particles like photons. All matter particles are fermions, particles with half-integer quantum spin that obey the Pauli exclusion principle. Force-carrying particles, in contrast, are bosons, which have integer spin and can violate the exclusion principle. This means that not only photons but also gluons (which carry the strong nuclear force), the W and Z bosons (which carry the weak nuclear force), and even the hypothetical Higgs boson are all free to possess any allowed quantum numbers in composite systems.
SUSY breaks this rule that all matter particles are fermions and all carriers are bosons. It does this by relating each Standard Model particle to a new form of matter and energy called a “superpartner”. In its simplest form, SUSY states that every boson has a corresponding “super-fermion” associated with it, and vice versa. These superpartners have not yet been observed in nature, but one of the main tasks of CERN’s Large Hadron Collider (LHC) will be to look for experimental evidence of their existence. If the LHC finds these superpartners, then the Standard Model will have to be replaced by the Minimal Super symmetric Standard Model (MSSM), or perhaps another more exotic variant.
From the point of view of equations, however, SUSY presents an additional challenge. Even if the LHC finds evidence that we live in a supersymmetric universe, there are many different sets of equations that incorporate supersymmetry. How, then, do we pick the right ones? The answer, of course, is that we pick the equations that agree with experimental observations. However, we can also ask a more subtle question: how do we ensure that the SUSY property is made manifest at every stage of calculations involving the quantum behaviour of these equations? It is here that adinkras might prove useful. Just as a weight-space diagram is a graphical representation that precisely encodes the mathematical relations between the members of SU(3) families, so an adinkra is a graphical representation that precisely encodes the mathematical relations between the members of supersymmetry families.
Building up adinkras
Now that we know a little bit about how adinkras can be used, we can begin to discuss what they look like. All adinkras are constructed by starting with squares, cubes and their higher-dimensional generalizations; these structures provide a “skeleton” that is then “decorated” by additional operations. Each of these decorations has a mathematical significance, which I will discuss later. For the moment, let us just concentrate on building a simple adinkra.
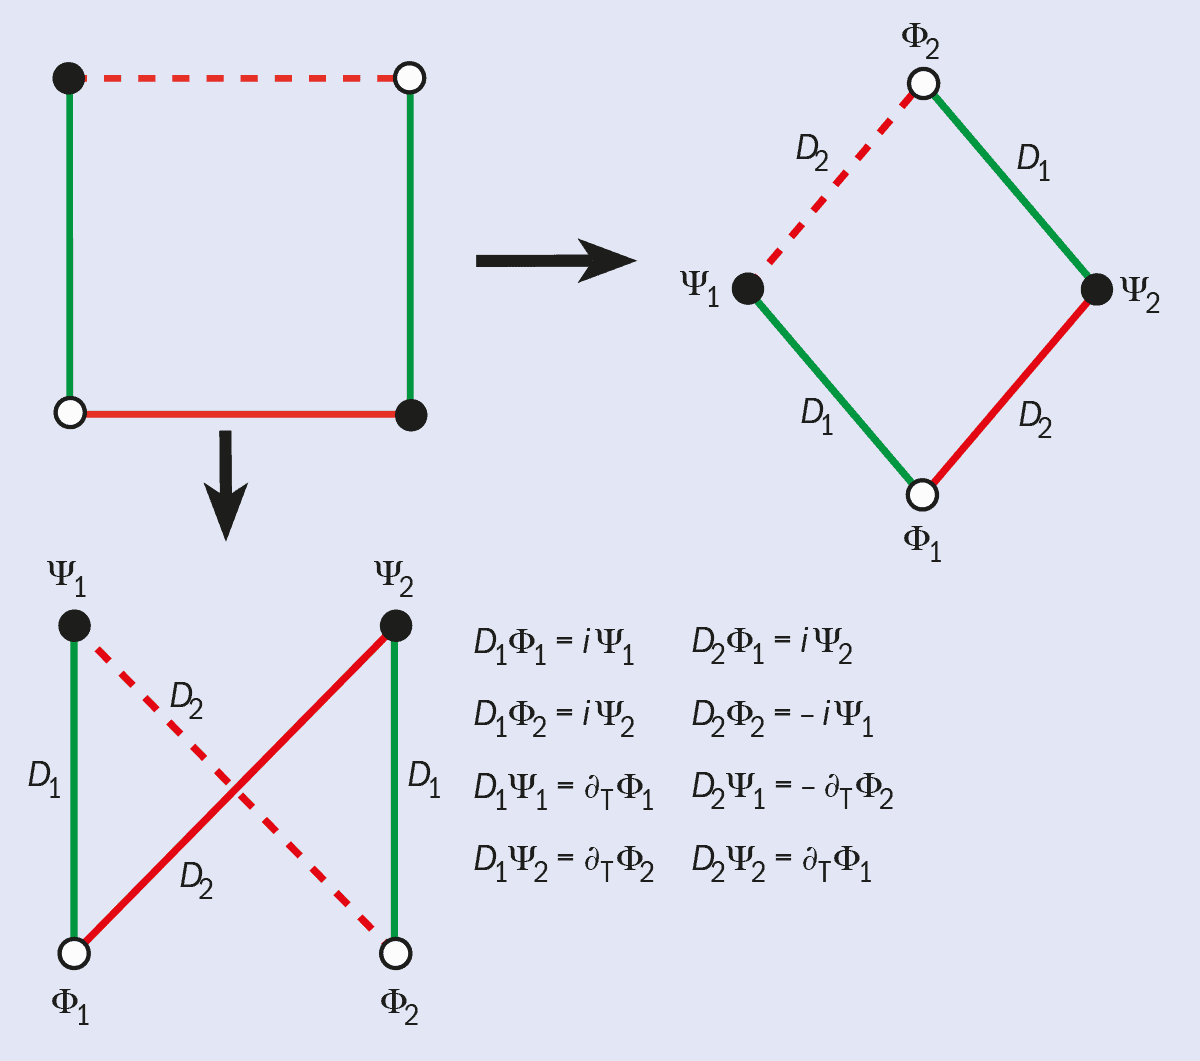
To make a square into an adinkra, we begin by placing a white dot at one vertex (figure 2). The rules of adinkras then dictate that the two line segments connected to the white dot must have black dots at their opposite ends. This means that the final unpopulated vertex is connected to “black dot” vertices, so it must be populated by a white dot. Next, we need to assign directions to each line segment, or link. To keep track of these different directions, we assign distinct colours to each of them: all links that point in the same direction are assigned the same colour, and links that point in different directions are never assigned the same colour.
2 From squares to adinkras
A square can be transformed into two distinct adinkras. The set of eight super-differential equations relates to the bottom adinkra.
Then, we need to assign an “edge-parity” to each link: each coloured line can be drawn as either solid or dashed. Every two-colour closed path in an adinkra must contain an odd number of dashed links. One last rule is that white dots and black dots are never allowed to have the same vertical position; that is, no black dot in an adinkra is ever allowed to appear at the same height as a white dot. Figure 2 shows a square that has been “decorated” in two different ways and made into two distinct adinkras.
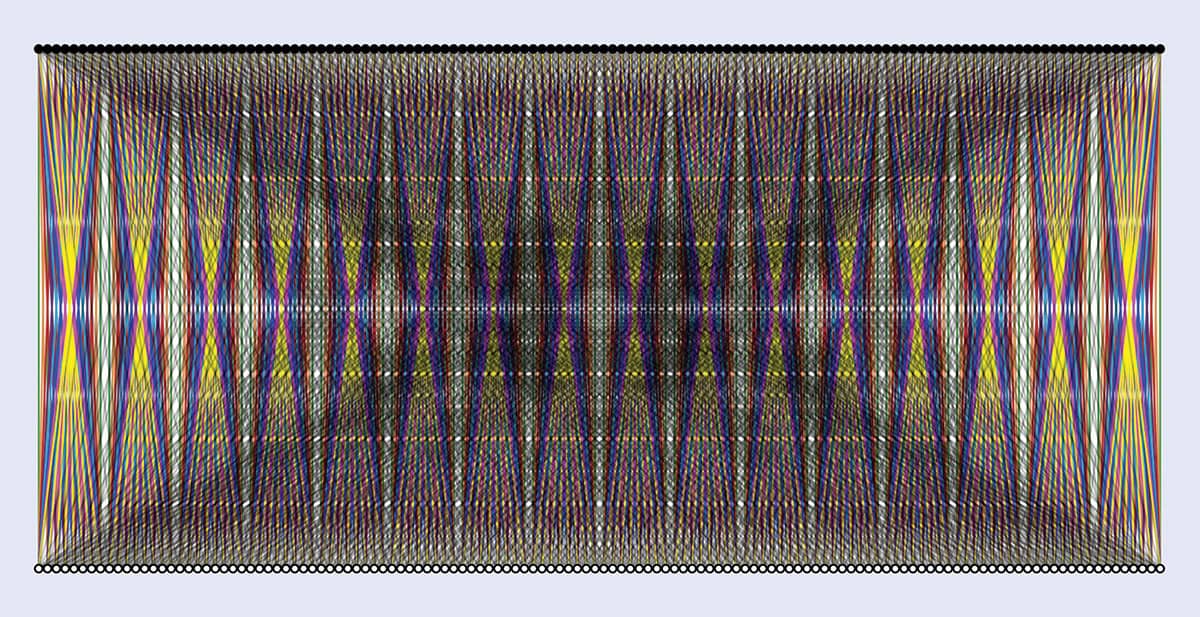
There is no limit to the number of colours that may be used to construct an adinkra. As a result, higher-dimensional adinkras have a certain aesthetic appeal (figure 3). As Einstein once said, “After a certain high level of technical skill is achieved, science and art tend to coalesce in aesthetics, plasticity and form.” Perhaps the “artistic” depictions shown here are an example of this.
But adinkras, like Gell-Mann’s octets, are not just pictures. In fact, they are in some ways rather similar to Feynman diagrams, which are the series of line drawings used to describe calculations in quantum electrodynamics. Like Feynman diagrams, adinkras are a precise mathematical description of calculations. They also serve as an aid to performing these calculations, since the way that adinkras are constructed provides a streamlined description of the most compact sets of equations with the SUSY property. But while Feynman diagrams describe calculations for particle quantum behaviour, adinkras are connected instead to mathematical objects known as Clifford algebras and super-differential equations.
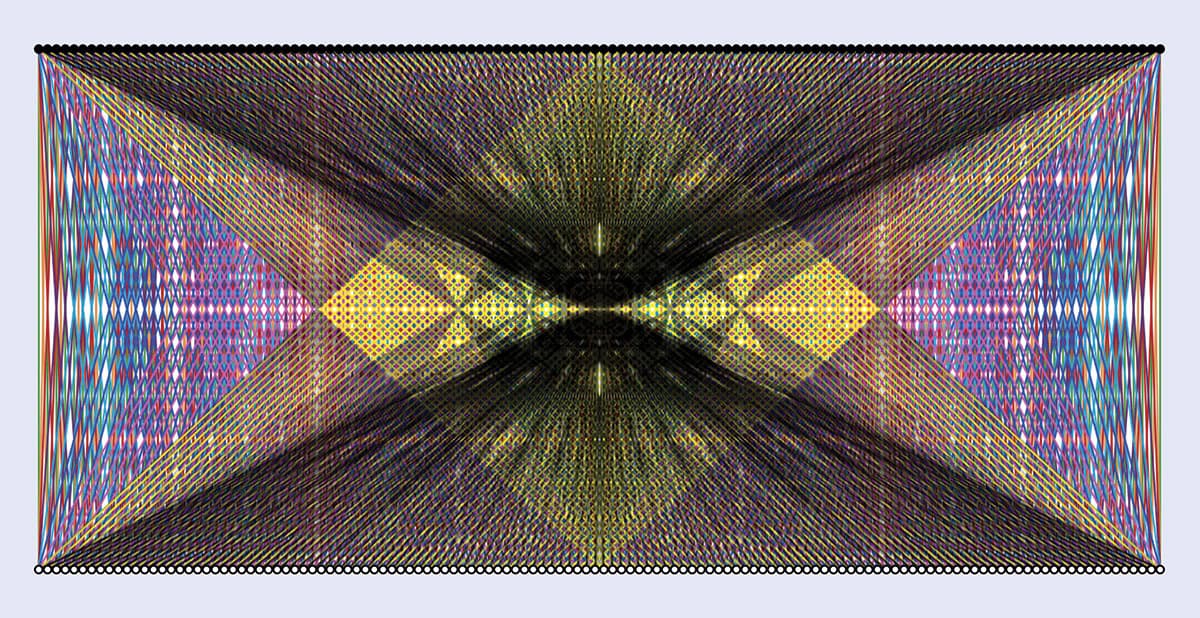
3 Multidimensional adinkras
(Courtesy: Gregory D Landweber)
These large n-colour folded adinkras represent complex systems of super-differential equations.
Clifford algebras were introduced by the English mathematician and philosopher William Kingdom Clifford in the 1870s as mathematical constructions that generalize complex numbers. However, they also provide the mathematical basis for our modern understanding of fermions. Where adinkras are concerned, if one ignores the information contained in the vertical height of the same type of dots in an adinkra, then that adinkra provides an exact description of mathematical matrices associated with Clifford algebras. For example, using the rules associated with adinkras, the bottom adinkra in figure 2 yields two of the three “Pauli matrices” (elements of a Clifford algebra) that describe the spin states of fermions.
A second connection to mathematics is even more similar to Feynman diagrams. It can be shown that each adinkra corresponds to a distinct set of super-differential equations. Super-differential equations involve both the ordinary derivative operator (invented by Newton and Leibnitz) and a newer type of operator called a “super derivative”, which was invented in the mid-1970s by the mathematician Felix Berezin and then elaborated on by the physicists Abdus Salam and John Strathdee. Super derivatives, represented by the links in an adinkra, are similar to the ordinary derivative, except that they are allowed to violate the usual product rule for derivatives. The super-differential equations for the bottom adinkra derived from a square are shown in figure 2.
Since there are only two types of coloured links, there are only two super derivatives: D1 associated with green links and D2 associated with red links. We also have two bosonic superfunctions (Φ1 and Φ2) associated with the correspondingly labelled white dots and two fermionic superfunctions (Ψ1 and Ψ2) associated with the correspondingly labelled black dots. As complex numbers generally consist of both a real and imaginary part, a superfunction consists of both bosonic and fermionic parts. To turn these components of the adinkra into a set of equations, we begin by picking one dot – let’s use the bottom-left one as an example – and writing its associated superfunction, Φ1, to the left of an equal sign. Next, we choose one of the coloured links and write its associated D to the left of the superfunction. For the green link this would be D1; for the red link it would be D2. Then we look to see what dot is at the other end of this link. If we pick the green link, the “target dot” is the one associated with the superfunction Ψ1, so this symbol belongs on the right of the equals sign. These rules alone are enough to give us the upper four equations in figure 2.
To “derive” the second group of four equations we need to introduce the ordinary differential operation, denoted by δΤ. The manner in which it appears in the equations is controlled by the relative height of the dots within each diagram: whenever the “starting” dot is higher in the adinkra than the “target” dot, this ordinary derivative appears on the right-hand side of the corresponding equation. The dashed links simply insert minus signs into some equations. You should have enough information now to apply this analysis to the second diagram in order to write down its associated equations – although, in time-honoured fashion, I have left this as an exercise for the reader.
SUSY and adinkras
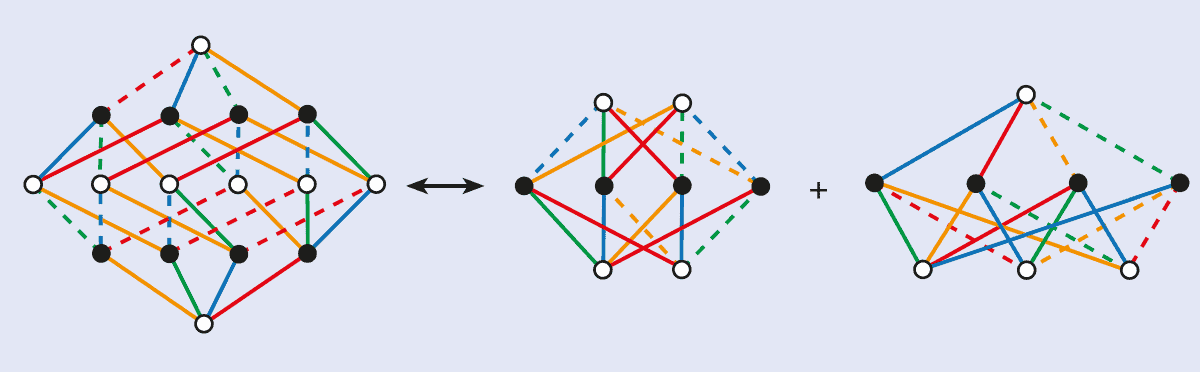
Returning now to the concept of supersymmetry, Salam and Strathdee devised a simple test to determine when systems of equations possess the property of SUSY. The system shown in figure 2 easily passes Salam and Strathdee’s test, but this does not necessarily mean that they are the equations that theorists from the Equations-R-Us company are seeking. In fact, they are not: aside from the Pauli matrices, the square-derived adinkras are just too simple to be associated with differential equations that have physical meaning. The same is true for adinkras based on a 3D cube. However, with a 4D hypercube, or tesseract, it is a different story. The four-colour adinkra (figure 4) demonstrates a behaviour that is not present for adinkras with fewer colours: it can be broken into two separate, smaller adinkras. These smaller adinkras do have physical meaning. The one on the far right is in fact related to Maxwell’s equations. If one first removes the uppermost open dot and then performs the Salam–Strathdee test, then Maxwell’s equations involving current charges emerge. Similarly, removing the two uppermost dots from the centre adinkra followed by the Salam–Strathdee test leads to the equations for the behaviour of the electron and its SUSY partner (known as the “selectron”).
4 Adinkras within adinkras
The “decorated tesseract” adinkra on the left can be broken down into two separate adinkras. The author’s collaboration of mathematicians and other physicists has introduced the name “gnomoning” for this process of subtracting a smaller adinkra from larger ones. The word gnomoning was used by Euclid, the founder of geometry, to describe a plane figure obtained by removing a smaller figure that is similar to the larger one.
Some of the equations described here have been known for some time to physicists who study SUSY. Yet it was not until 2009 that research on adinkras (arXiv:0902.3830) showed that these geometric objects can mimic the behaviour of the equations, and thus provided the first evidence that adinkras could be related to physics. The next key question to answer is whether the reverse process can also occur – beginning with an adinkra and using it to derive, via a set of well-defined rules, something like the Maxwell or Dirac equations. In 2001 (arXiv:hep-th/0109109) my students and I conjectured that this could indeed be the case, but only if we could encode the properties of 4D equations onto objects in a mathematical 1D format. Though this conjecture has not yet been proven, work completed by Faux, Iga and Landweber in 2009 (arXiv:0907.4543, arXiv:0907.3605) has provided the strongest evidence to date of its correctness. So, just as weight-space diagrams opened a new way to conceptualize the physics of nuclear matter, it is conceivable that adinkras may yield an entirely new way to formulate theories that possess the property of SUSY.
Adinkras may yield an entirely new way to formulate theories that possess the property of SUSY
From theoretical physics to codes
As it turns out, it is not just four-colour adinkras that can be separated into two smaller adinkras with the same number of colours; adinkras with more than four colours also possess this property of separability. But why does this occur only for four or more colours? Investigating this question launched our “treasure hunt” in a completely unexpected direction: computer codes.
Modern computer and communication technologies have come to prominence by transmitting data rapidly and accurately. These data consist principally of strings of ones and zeros (called bits) written in long sequences called “words”. When these computer words are transmitted from a source to a receiver, there is always the chance that static noise in the system can alter the content of any word. Hence, the transmitted word might arrive at the receiver as pure gibberish.
One of the first people to confront this problem was the mathematician Richard Hamming, who worked on the Manhattan Project during the Second World War. In 1950 he introduced the idea of “error-correcting codes” that could remove or work around any unwanted changes to a transmitted signal. Hamming’s idea was for the sending computer to insert extra bits into words in a specific manner such that the receiving computer could, by looking at the extra bits, detect and correct errors introduced by the transmission process. His algorithm for the insertion of these extra bits is known as the “Hamming code”. The construction of such error-correcting codes has been pursued since the beginning of the computer age and many different codes now exist. These are typically divided into families; for example, the “check-sum extended Hamming code” is a rather complicated variant of the Hamming code and it belongs to a family known as “doubly even self-dual linear binary error-correcting block codes” (an amazing mouthful!). Yet whatever family they belong to, all error-correction codes serve the same function: they are used to detect errors and allow the correct transmission of digital data.
How does this relate to adinkras? The middle adinkra in figure 4 is obtained by folding the image on the left of the figure. The folding involves taking pairs of the dots of the same type and “fusing them together” as if they were made of clay. In general, an adinkra-folding process will lead to diagrams where the associated equations do not possess the SUSY property. In order to ensure that this property is retained, we must carry out the fusing in such a way that white dots are only fused with other white dots, black dots with other black dots, and lines of a given colour and dashing are only joined with lines that possess the same properties. Most foldings violate this, but there is one exception – and it happens to be related to a folding that involves doubly even self-dual linear binary error-correcting block codes.
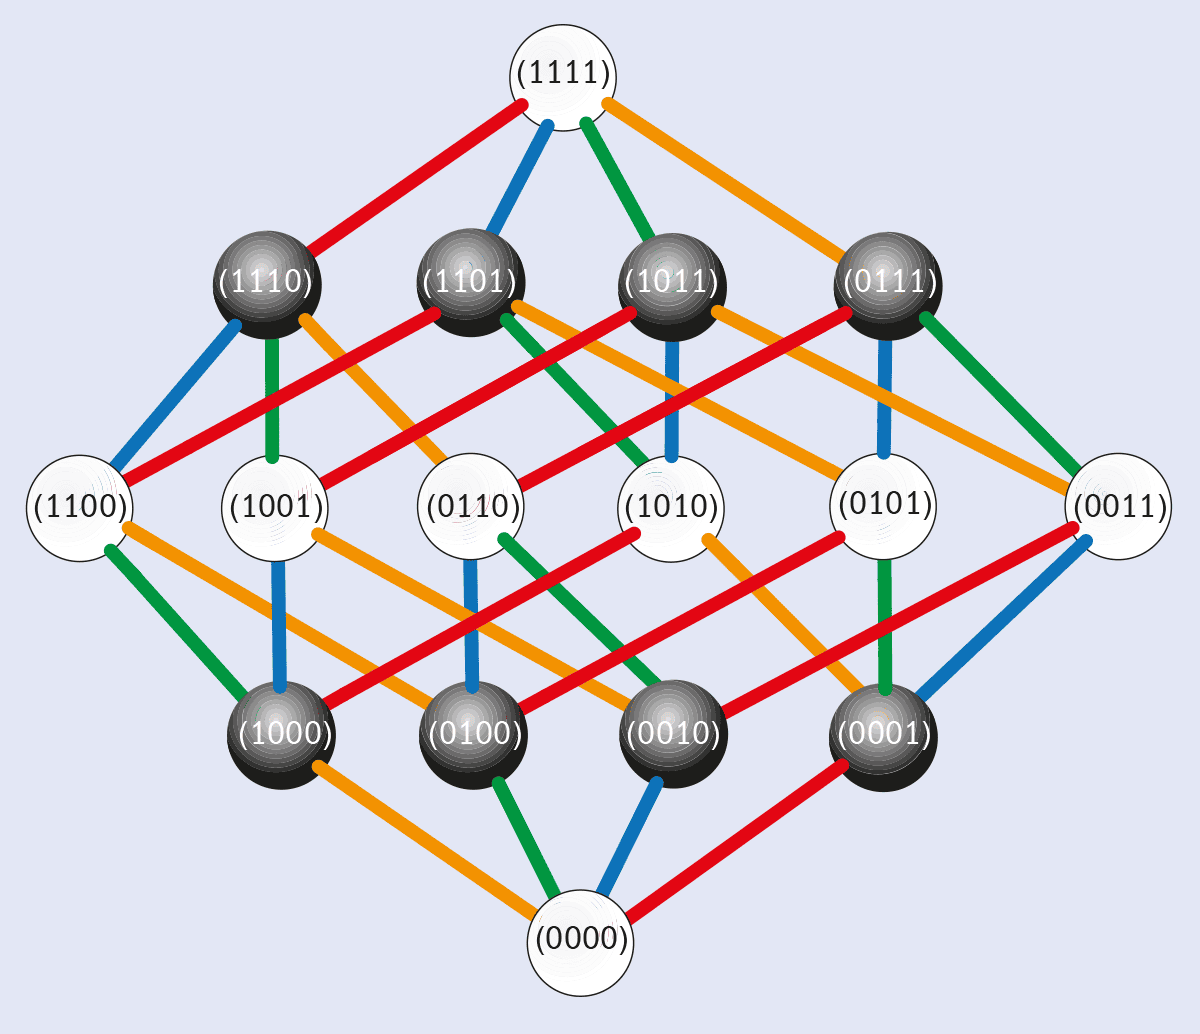
5 Coded adinkras
The decorated-tesseract adinkra and its associated computer “words”. For simplicity, the adinkra is shown without dashed lines.
The adinkra in figure 5 is the same as the left-hand part of figure 4 but for simplicity it is shown without dashed edges. We pick the bottom dot as a starting point and assign it an address of (0000). To move to any of the dots at the second level requires traversing one of the coloured links. There are four distinct ways in which this can be done. To move to any dot at the third level from the bottom dot requires the use of two different coloured links, and so on for the rest of the adinkra. In this way, every dot is assigned an address, from (0000) to (1111). These sequences of ones and zeros are binary computer words.
To accomplish the folding that maintains the SUSY property in the associated equations, we must begin by squeezing the bottom dot together with the upper dot. When their addresses are added bit-wise to one another, this yields the sequence (1111). If we continue this folding process, always choosing pairs of dots so that their associated “words” sum bit-wise to (1111), we can transform the adinkra on the left-hand side of figure 4 to the one on the right. Thus, maintaining the equations’ SUSY property requires that the particular sequence of bits given by (1111) be used in the folding process. The process used to meet this criterion happens to correspond to the simplest member of the family containing the check-sum extended Hamming code.
The part of science that deals with the transmission of data is called information theory. For the most part, this is a science that has largely developed in ways that are unrelated to the fields used in theoretical physics. However, with the observation that structures from information theory – codes – control the structure of equations with the SUSY property, we may be crossing a barrier. I know of no other example of this particular intermingling occurring at such a deep level. Could it be that codes, in some deep and fundamental way, control the structure of our reality? In asking this question, we may be ending our “treasure hunt” in a place that was anticipated previously by at least one pioneering physicist: John Archibald Wheeler.
Life in the Matrix?
Wheeler, who died in 2008, was an extremely well-regarded figure within physics. He served as advisor to a clutch of important physicists, including Richard Feynman, while his own work included the concept of the “S-matrix” (a mathematical tool that helps us understand Standard Model particles). Beyond the physics community, Wheeler is probably best known for coining the terms “black hole” and “wormhole”. But he also coined a slightly less familiar phrase – “it from bit” – and this is what concerns us here.
The idea of “it from bit” is a complex one, and Wheeler’s own description of it is probably still the best. In 1990 he suggested that “every ‘it’ – every particle, every field of force, even the space–time continuum itself – derives its function, its meaning, its very existence entirely…from the apparatus-elicited answers to yes-or-no questions, binary choices, bits”. The “it from bit” principle, he continued, “symbolizes the idea that every item of the physical world has at bottom…an immaterial source and explanation: that which we call reality arises in the last analysis from the posing of yes–no questions and the registering of equipment-evoked responses; in short, that all things physical are information-theoretic in origin and that this is a participatory universe”.
When I first heard the idea of “it from bit” as a young physicist, I thought Wheeler must be crazy. The concept of a world made up of information just sounded strange, and (although I did not know it at the time) I was not the only one who thought so. However, sometimes crazy ideas turn out to be true, and Wheeler has been proved right before. As Feynman said, “When I was [Wheeler’s] student, I discovered that if you take one of his crazy ideas and you unwrap the layers of craziness from it one after another, like lifting layers off an onion, at the heart of the idea you will often find a powerful kernel of truth.” Indeed, another of Wheeler’s “crazy” ideas – his suggestion that a positron can be treated as an electron moving backwards in time – played a role in Feynman later winning a Nobel prize.
As for my own collaboration on adinkras, the path my colleagues and I have trod since the early 2000s has led me to conclude that codes play a previously unsuspected role in equations that possess the property of supersymmetry. This unsuspected connection suggests that these codes may be ubiquitous in nature, and could even be embedded in the essence of reality. If this is the case, we might have something in common with the Matrix science-fiction films, which depict a world where everything human beings experience is the product of a virtual-reality-generating computer network.
If that sounds crazy to you – well, you could be right. It is certainly possible to overstate mathematical links between different systems: as the physicist Eugene Wigner pointed out in 1960, just because a piece of mathematics is ubiquitous and appears in the description of several distinct systems does not necessarily mean that those systems are related to each other. The number π, after all, occurs in the measurement of circles as well as in the measurement of population distributions. This does not mean that populations are related to circles.
Yet for a moment, let us imagine that this alternative Matrix-style world contains some theoretical physicists, and that one of them asks, “How could we discover whether we live inside a Matrix?”. One answer might be “Try to detect the presence of codes in the laws that describe physics.” I leave it to you to decide whether Wigner’s warning should be applied to the theoretical physicists living in the Matrix – and to us.
It sounds like a plot to a Dan Brown novel, but this bizarre tale is true.
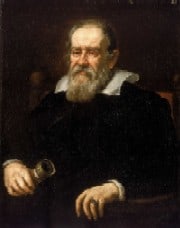
The middle finger, thumb and a tooth of Galileo Galilei will go on display at the Galileo Museum in Florence, which reopens this Friday after two years of renovations.
The preserved body parts were removed from the great Italian natural philosopher, along with his second finger and a vertebra, in a special ceremony 95 years after Galileo’s death.
While the second finger and vertebra have been preserved in Florence and Padua since 1737, the other body parts went missing at the start of last century.
Then, out of the blue, they turned up last year in a case bought at an auction by a renowned art collector from Florence. Subsequent tests have confirmed that the fingers and tooth do indeed belong to Galileo, and they have now been acquired by the Galileo Museum.
The reopening of the Galileo Museum coincides with the 400th anniversary of Galileo’s Sidereus Nuncius – The Starry Messenger – considered by many to be the first formal text based on telescopic observations.
The engineer who led the testing of the ball for the FIFA World Cup – which gets under way this Friday – is defending the product despite a torrent of criticism from leading footballers. In the British press it is the goalkeepers who seem to be most unhappy, with the England number one, David James, describing the ball as “horrible” and “dreadful”, and his Italian counterpart, Gianluigi Buffon, fearing that its “unpredictability” could ruin the tournament.
The new ball, called the Jabulani, meaning “celebrate” in isiZulu, was unveiled by the sports manufacturing firm Adidas in December of last year. Loughborough University in the UK was the exclusive research partner, where a group of engineers spent four years testing and developing the aerodynamic features of the ball. This included a “kicking robot” positioned in a wind tunnel to see how the ball responded to aerodynamic instabilities. The final design introduces a new texture, trademarked as “Grip ‘n’ Groove”, and a new manufacturing process. When combined these features are supposed to make the ball more round and more predictable in flight.
The flight of a good quality match ball is noticeably faster and more reliable than that of a smooth plastic football that you might buy at a local grocery store. When a smooth ball moves through the atmosphere, the drag is large – being proportional to the surface area of the ball coming into contact with the air. And because the kinematic energy of the ball is converted into heat at such a high rate, the air flows cannot recombine behind the ball. This creates a zone of turbulent eddies in the wake of the ball, which can cause the ball’s motion to become unpredictable.
All-important seams
Higher quality balls are designed to reduce drag by having a surface made from several panels stitched together. These indentations trigger small instabilities at the boundary between the ball’s surface and the air. The result is twofold: the drag is reduced because the airflows no longer oppose the flight of the ball in such a uniform way; and the flight is more reliable because the mixing effects at the ball-air boundary enable airflows to recombine behind the ball, thus avoiding a wake of turbulent eddies.
Ball manufacturers for a World Cup are on a hiding to nothing. Whatever they do they’ll get hammered. Steve Haake, Sheffield Hallam University
The Jabulani ball is touted as offering both of these qualities, being both fast and reliable. It is moulded from panels of ethylene-vinyl acetate, a polymer used in shoes and other athletic materials to absorb physical shock, and thermoplastic polyurethanes, another group of highly elastic plastics. The panels are thermally bonded rather than being stitched together, which enabled the researchers to experiment with a larger range of groove shapes. The final design, according to the researchers, is a ball that travels 5% faster than previous balls while behaving in a smoother, more predictable way.
“The laws of physics mean that we cannot eliminate the possibility of unstable flight, but we can include features that reduce its likelihood and effect,” says Andy Harland, who led the team of engineers at Loughborough University. “We also investigated how groove width, depth and shape can affect aerodynamic side forces and have learned some features are highly sensitive,” he adds.
‘It moves all over’
But the ball has not been well received by several players, who are claiming that the Jabulani is in fact far less predictable than previous balls. Tim Howard, the US goalkeeper is reported in The Times as saying: “It moves all over. If you hit five balls with the same striking motion you wouldn’t get the same result.”
This sentiment is backed up Derek Leinweber, a physicist at the University of Adelaide, who has put the ball through his own series of aerodynamic tests, comparing the Jabulani’s performance with the ball from the previous World Cup, the Teamgeist. “The Jabulani is expected to ‘bend’ more for the players than any ball previously encountered. Players are also discovering new opportunities to move the ball in erratic ways, alarming the world’s best goalkeepers,” he says. “By the time the ball reaches the goalkeeper, the Jabulani will have swerved and dipped, arriving with more power and energy than the Teamgeist.”
Perhaps the reason that players are struggling with the new ball is simply the scale of the change between the Jabulani and previous balls. Steve Haake, a sports engineer at Sheffield Hallam University in the UK believes that players, especially goalkeepers, are highly sensitive to any change in ball technology. “Ball manufacturers for a World Cup are on a hiding to nothing. Whatever they do they’ll get hammered,” he says.
Andy Harland agrees that any new ball design will always divide opinion. “As an ex-goalkeeper myself I would consider a more stable ball to be a good thing! I know also that the surface texture and colour contrasts have been well received by professional goalkeepers. Having said that, tournament organizers want goals and I anticipate that when goals are scored, some goalkeepers will be unhappy, so time will tell,” he says.
Harland is joined by the footballers Frank Lampard (England), Petr Čech (Czech Republic) and Kaká (Brazil) in discussing the new ball in this video, courtesy of Loughborough University.
You can also read about the physics of football in more depth in this Physics World feature.
Contradictory results from experiments searching for dark matter can be resolved if the elusive dark stuff is made up of two types of particle, according to physicists in the US.
The new theory could clear up a mystery that came to light in 2008, when the PAMELA collaboration released one of the strongest pieces of evidence yet for the direct detection of dark matter – a substance thought to make up over 80% of the universe’s matter. PAMELA saw a bump in the abundance of cosmic anti-electrons, also known as positrons, thought to be generated as dark-matter particles annihilate. But there was no concordant signal for anti-protons, which should also be generated by the annihilation.
That isn’t the only problem. If the PAMELA signal was indeed evidence for annihilation, the dark matter involved would be of a type that would never show up in direct-detection experiments, such as CDMS-II, located in a mine in Minnesota, US. But in recent years CDMS-II and other direct detection experiments have found their own hints of dark matter.
Lurking in the ‘hidden sector’
Now Daniel Feldman at the University of Michigan and colleagues at other US institutions think that they have found a way to join up these mismatching signals. They say that dark matter could be made up of two types of particle – one conventional particle, which would show up in direct-detection experiments, and one “hidden sector” particle, which would explain the PAMELA signal. “I think that we have the first model with which we are able to explain essentially all of the current dark-matter data,” says Pran Nath, one of Feldman’s co-authors based at Northeastern University in Boston.
I think that we have the first model with which we are able to explain essentially all of the current dark-matter data Pran Nath, Northeastern University
Dark matter is thought to interact only through gravity and the electroweak force, so one of the most popular candidates is so-called weakly interacting massive particles, or WIMPs. But in recent years some researchers have begun to look past the WIMP hypothesis in favour of more complex ones, in response to experiments giving mismatching evidence.
When two WIMPs annihilate, for example, they should produce two bosons, which decay into either electrons and positrons, or protons and anti-protons. PAMELA, a satellite orbiting Earth, only witnessed one side of this process – the electron and positron side – which suggests either its signal is faulty, or something is not quite right with the theory.
Tantalizing hints
One reason to think that theory might be lacking comes in the data from direct-detection experiments, which typically look for the recoil of atoms as WIMPs collide into them. For years the DAMA collaboration based in Italy has claimed evidence of this sort, and recently the collaborations CDMS-II and CoGeNT have flagged up their own tantalizing hints. But these signals do not match the WIMP signal seen by PAMELA – indeed, if the PAMELA signal is real, according to the standard WIMP hypothesis, the direct detection experiments should see nothing.
Feldman, Nath and colleagues’ theory explains how PAMELA and the direct-detection experiments could both find evidence for dark matter. They propose a type of multi-component dark matter that consists of two very different particles. One of these would be a conventional WIMP – a neutralino, predicted in supersymmetric extensions to the Standard Model of particle physics. The neutralino is a “Majorana” particle (which means it is its own anti-particle) and produces very little antimatter upon annihilation, but would produce nuclear recoils in direct-detection experiments.
The other particle would be an unconventional, hidden-sector WIMP. The hidden sector is an addition to the Standard Model that involves different particles and forces to those known to exist today. The US group thinks that a hidden-sector “Dirac” particle (which has a separate anti-particle) would be able to decay into positrons after annihilation but not anti-protons, and would therefore explain the PAMELA signal.
Testability is a benefit
Joe Silk, a cosmologist at Oxford University, UK, thinks the study is one of numerous others that have attempted to explain the mismatching dark-matter signals, but notes that it does benefit from being testable. “Any annihilation-type model that fits the PAMELA data must give a large flux of high-energy electrons and positrons in the early universe when the density of dark matter was much higher than today,” he says. This, he adds, would “mess up” the universe’s early period when electrons and protons first combined into neutral hydrogen atoms, and should therefore show up as fluctuations in the cosmic microwave background (CMB) radiation.
Such fluctuations might be too small to notice with WMAP, the satellite that has provided most information to date on the CMB. But the Planck observatory, which launched into orbit last year, will be able to search in far more detail. Only then, it seems, might we get a hint of whether dark matter is as complex as Feldman, Nath and others think it is.
In three days’ time all eyes will turn to South Africa as the first match kicks off in the 2010 FIFA World Cup, the first time the tournament has been hosted by an African nation.
Love it or loathe it, football has developed into a truly global force where fans are now interested in many different aspects of the game from the silky skills of the top players to the fashion styles of the wives and girlfriends.
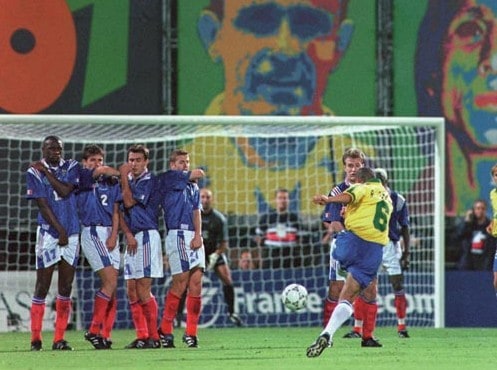
One aspect that hasn’t changed over the years is the underlying physics of the game, notably the aerodynamics that governs the behaviour of the ball. Indeed back in 1998 we published a feature about this topic inspired in part by a freakish goal by the Brazilian fullback, Roberto Carlos, which appeared to defy the laws of physics.
Playing in a tournament in France, Carlos struck a free kick 30 m from his opponents’ goal. It was heading so far wide of the goal it made a ball boy, standing several metres to the right of the goal, duck his head in response. Then, once the ball had cleared the wall of defenders, it took a wicked late swerve into the top right hand side of the goal, leaving the crowd and subsequent viewers truly gobsmacked.
After scoring that spectacular goal, Carlos took every opportunity to try to repeat the trick but never quite managed it.
The Physics World feature, co-authored by sports engineer Steve Haake of Sheffield Hallam University, breaks down this legendary strike to explain the aerodynamics of the ball’s flight. It confirms something that I have suspected for a long time: that Carlos is not actually a magical free-kick taker, but that some highly unusual atmospheric conditions were in play that memorable night in Paris.
It is a fascinating read and the article also looks more generally at the aerodynamics of sports balls and the kind of research that can explore these processes.
There are some challenges in physics that are, quite simply, harder and more important than others.
Some will argue that the number one challenge is the search for the Higgs boson, the building of a practical quantum computer or the creation of a unified theory.
But for others, the biggest deal in physics is the search for dark matter – the invisible and so far elusive substance that is believed to make up more than 80% of the mass in the universe.
And what is particularly hard about searching for dark matter is not just that it’s invisible, but that most people looking for it spend their days hundreds of metres below ground, often in mines.
There can’t be many physicists whose job involves travelling up and down lift shafts wearing a hard hat and a day-glo jacket, before brushing the dust off, entering a clean room and then trying to coax a detector into spotting something that we’re not even sure what it might be.
But the reward for whoever makes the first definitive direct detection will be as big as it gets – a Nobel Prize for Physics is almost a nailed-on certainty.
Dark matter was first proposed in the 1930s to explain why galaxies in certain clusters move faster than should be possible if they only contained ordinary matter that we can see. Most physicists now think that this “missing mass” is some form of weakly interacting massive particle (WIMP), although its exact nature is still unknown.
Most dark-matter searches are located in deep underground laboratories because the overhead rock then shields the detectors from cosmic rays that can swamp the dark-matter signals.
But until you actually visit one of these experiments, it’s hard to appreciate the practical difficulties that are involved.
I recently travelled to the Boulby Underground Laboratory in Cleveland on the north-east coast of England for this video interview with lab manager Sean Paling from Sheffield University and the Rutherford Appleton Laboratory.
Once you get underground, the Boulby lab – home to the ZEPLIN-III and DRIFT experiments – looks like any other. But as Paling explains in our video interview, getting the equipment down there is no mean feat.
Paling and colleagues might have a hard life, but they are lucky on one front – the lab is located in a working potash mine, which means that the UK forks out just £300,000 a year on infrastructure costs for housing its dark-matter search.
Other dark-matter searches, in contrast, are located in specially built labs. The XENON-100 and DAMA experiments, for example, are at the Gran Sasso lab deep inside the Apennines in central Italy, while the Cryogenic Dark Matter Search (CDMS) is in a disused mine. The US is even planning a giant new Deep Underground Science and Engineering Laboratory (DUSEL) that will cost the US billions of dollars.
So the UK search, which has been leading the way for nearing 20 years, is great value for money. But like many areas of UK physics, the Boulby dark-matter work is currently facing turbulent financial times after a decade of healthy funding.
Paling acknowledges that times are hard, and that much effort is needed to secure funding for the future of the Boulby experiments. Let’s hope he and colleagues succeed as the search for dark matter is really starting to hot up as we reported last month.