Higgs hunters face long haul

Apart from being so huge, complex and expensive, CERN’s Large Hadron Collider (LHC) is perhaps most famous for having broken down just nine days after it switched on in September 2008. Fourteen months and some CHF40m of repairs later, the LHC came spectacularly back to life late last year as jubilant physicists collided particles at record-breaking energies.

But to reduce the chances of the LHC being derailed again by a similar accident, physicists at the Geneva lab have decided to run the collider at just half its design energy for the next 18-24 months. The decision will potentially increase the time it will take the CHF6bn machine to unearth new fundamental particles, particularly the Higgs boson.

Under the latest schedule announced this week, the 27 km circumference collider will begin to smash beams of protons into one another at an energy of 7 TeV (3.5 TeV per beam) in early March. Experiments will then continue until its detectors have accumulated one “inverse femtobarn” of data – roughly 10 trillion proton–proton collisions – with the run ending after two years at the latest. By the time it was shut down on 16 December last year after just four weeks of operation, the LHC had delivered more than 50,000 collision “events” at a record energy of 2.36 TeV to its two largest particle detectors, ATLAS and CMS.

5 TeV per beam now looks very risky Roger Bailey, CERN

The previous plan to step the collision energy to 10 TeV this year was shelved following lab tests carried out late last year that simulated the accident of 19 September 2008. It occurred when a connection between two of the LHC’s superconducting magnets evaporated while carrying a current of 8.7 kA, puncturing the machine’s liquid-helium cooling system and causing significant collateral damage.

By opting to run at just 7 TeV, CERN is playing it safe. “5 TeV per beam now looks very risky,” LHC operations leader Roger Bailey told physicsworld.com.

Risky business

Once the 7 TeV run is over, CERN will shut the LHC down in 2012 for a year or more to prepare it to go straight to maximum-energy 14 TeV collisions in 2013. This will be a complex job that will involve replacing some 10,000 superconducting magnet connections with more robust ones.

However, Chiara Mariotti, who co-convenes the Higgs working group on the CMS experiment, says that choosing to stay at lower energies is a big price to pay in terms of the Higgs search. “We will need more than twice the data at 7 TeV compared to that needed at 10 TeV to reach the same discovery potential,” she says. “At this energy we can at best expect to exclude a Higgs with a mass between 155 and 175 GeV.”

Her CMS colleague Tommaso Dorigo, who has written extensively about the Higgs search on his blog, reckons the hope of discovering the Higgs boson at the LHC before 2012 is “faint”.

However, the decision to run at lower energies still offers plenty of opportunity for CERN researchers, who could make major discoveries such as supersymmetric particles – or even something totally unexpected – relatively early. Indeed, the run energy of 7 TeV is still 3.5 times greater than at the Tevatron collider at Fermilab in the US, which until December was the world’s most powerful collider. What will be discovered – if at all – depends largely on how heavy such new particles are and on how easy they are to spot among “background” processes taking place in the proton–proton collisions.

Friendly rivalry

The Higgs boson is the last missing piece of the Standard Model of particle physics, and its discovery would confirm the most compelling explanation physicists have for how elementary particles acquire mass. Although the theory does not predict the mass of the Higgs boson, precision measurements of known Standard Model particles mean that its mass is unlikely to be more than 186 GeV. Meanwhile, direct searches made at CERN’s Large Electron–Positron collider – the forerunner to the LHC – rule out a Higgs that is lighter than 114 GeV.

There is less and less room for the Higgs to hide Stefan Söldner-Rembold, D0 experiment

Efforts are therefore being focused on the region inbetween, and not only by physicists who work at the LHC. Keen to spot evidence for the Higgs first, researchers at the Tevatron’s two experiments – CDF and D0 – have spent the past few years feverishly gathering data from proton–antiproton collisions at an energy of 1.96 TeV. These experiments suggest that physicists could be in for a long slog: a joint paper accepted for publication this week in Physical Review Letters rules out a Higgs with a mass of around 165 GeV, while disfavouring (at lower statistical significance) the region 160–180 GeV. “There is less and less room for the Higgs to hide,” says D0 co-spokesperson Stefan Söldner-Rembold.

A lighter Higgs?

Although such exclusion limits allow physicists on both sides of the Atlantic to focus more sharply on the region where the Higgs might exist, the data – when taken with indirect limits from measurements at previous colliders – tentatively point to a light Higgs, which would be harder to discover. For example, a Higgs weighing less than about 140 GeV would be less likely to decay into pairs of W or Z bosons, which would leave clear, quick-to-find signatures in the LHC’s detectors, and more likely to decay into pairs of b-quarks, which are much harder to distinguish from background. The LHC experiments would therefore need to collect more data to build a strong enough statistical case to identify a Higgs “signal”.

Although the Tevatron does not have the capability to discover the Higgs outright – that task will only be possible with the LHC – it could produce the first strong hints of the particle’s existence if the Higgs is lighter than about 160 GeV. “There is very high level of excitement at Fermilab and in other places including the US Department of Energy [which funds the laboratory],” say D0 co-spokesperson Dmitri Denisov. “But in order to claim evidence for Higgs we need to see the signal, not just exclude other areas. And keep in mind that the Higgs might not exist at all.”

The Tevatron result certainly is adding more pressure for the LHC to join this race without delay Pedro Teixeira-Dias, ATLAS experiment

The Tevatron is now expected to run in tandem with the LHC’s 7 TeV run until the end of 2011 following President Obama’s budget request, which was made earlier this week. “Anything beyond that is a guess,” says CDF co-spokesperson Jacobo Konigsberg.

As the high-energy baton passes from Fermilab to CERN, the race for the Higgs and perhaps other ground-breaking discoveries is on. “The Tevatron result certainly is adding more pressure for the LHC to join this race without delay,” says ATLAS physicist Pedro Teixeira-Dias. “Compared with the Tevatron the LHC will have a much higher Higgs cross-section and a better signal-to-background ratio, even at ‘just’ 7 TeV. But the Tevatron is now at the top of its game and is clearly not to be discounted. We live in exciting times.”

Spider web inspires fibres for industry

Spiders may not be everybody’s idea of natural beauty, but nobody can deny the artistry in the webs that they spin, especially when decorated with water baubles in the morning dew. Inspired by this spectacle, a group of researchers in China has mimicked the structural properties of spider webs in creating a fibre for industry that can manipulate water with the same skill and efficiency.

Lei Jiang of the Chinese Academy of Sciences set out with his colleagues to look at the fine detail of spider webs and the way that the silks interact with moisture in the atmosphere. They found that the water-collecting ability of Uloborus walckenaerius – a common, non-venomous spider – is the result of a network of knots that form in the web when it gets wet.

Dotted periodically throughout the web, these structural features create gradients of energy and pressure between knots. The result is a sort of cascade whereby moisture condenses from the atmosphere and is then channelled towards these spindle knots. As a result, drops of water as big as 100 µm in diameter can form.

Web knots

Individual knots begin to form when tiny water droplets condense at certain sites or “puffs” in the spider silk. Using Scanning Electron Microscopy (SEM), the researchers found that at these sites, known as “puffs”, the nanofibrils that comprise the silk are no longer aligned but point in random directions.

Armed with this knowledge, Jiang’s team then replicated the spider fibres using polymethyl methacrylate, a synthetic polymer that was chosen because it bonds well with water molecules. The major technical challenge was to fine-tune these fibres to function in realistic industrial conditions whereby temperatures and humidity levels are often changing. They succeeded in creating individual fibres that could trap and transport water droplets in the same way as the spider silk.

The researchers are unsure of why the spider has evolved to possess this ability. “It could be for its drinking activities, or it could be to refresh the web structure to make it stronger and stickier for prey,” Jiang told physicsworld.com.

Smart catalysis

Mato Knez at the Max Planck Institute of Microstructure Physics, who is also interested in industrial applications inspired by spider webs, believes that it could be a tactic to protect the web. “If the water is distributed along the silk as film, this might lead to destruction. However, by allowing the droplets to grow until reaching a critical size they will presumably fall from the silk,” he says.

Jiang and his team intend to develop their research by preparing a series of materials that control water in different ways. One application could be “smart catalysis”, which can speed up a chemical reaction without needing a catalyst.

Andrew Martin, a bioengineer at Bremen University in Germany, is doubtful that this technology could be useful on a large industrial scale, but he envisages smaller-scale application. “The directionality of water collection might be useful in any rheological or microfluidic process.”

This research is published in Nature.

Bell Labs launch Ireland expansion

Bell Labs, the research arm of the telecommunications giant Alcatel-Lucent, has today announced that it will double the number of researchers at its Irish research centre in Dublin. The lab, once a powerhouse of basic physics research with seven Nobel prizes to its name, announced that it will create 70 new jobs over the next five years to carry out research into novel telecommunications devices. Alcatel-Lucent also has research centres in the US, China, India, Germany, France and Belgium.

Speaking at the launch of the expansion, Mary Coughlan, Ireland’s deputy prime minister, said that it was “a significant investment in high-calibre jobs” that would cause “Ireland’s reputation [to] grow”. She was joined by Bell Labs president Jeong Kim, who dubbed Bell Labs Ireland, which was founded in 2005, “a success story” that would benefit the local knowledge economy. The expansion of Bell Labs Ireland has been supported by the Irish government through its Industrial Development Agency.

Past glory

Founded in 1925, Bell Labs was once considered to be one of the world’s leading industrial laboratories for fundamental physics research. Bell researchers were responsible for inventing the transistor, the laser, as well as the UNIX and C computer-programming languages. Indeed, only last year former Bell Labs researchers Willard Boyle and George Smith shared the Nobel Prize for Physics for inventing the charge-coupled device – a key component for most digital cameras – in 1969. They shared the prize with Charles Kao for his work on optical-fibre technology.

However, when Bell Labs’ parent company AT&T was forced to split up in 1996, the once-famous lab ended up inside the newly-formed equipment division – Lucent Technology. Lucent struggled to fund Bell labs and the number of Lucent employees fell from a peak of 160,000 to just 30,000 in 2006 before it merged with French telecoms company Alcatel in December of that year. The new firm, Alcatel-Lucent, announced in August 2008 that Bell Labs would not carry out any further basic physics research but focus entirely on research that is directly relevant to its telecoms business.

Irish home

Founded by Lucent in 2005, Bell Labs Ireland is involved in designing low-cost, high-power antennas, studying network optimization, as well as investigating novel methods to cool communications equipment. Staff at the centre have also been building devices to boost 3G mobile-phone signals in the home or in areas with low coverage. They have, for example, designed algorithms that allow a device to send a signal only to the inside of a home and not outside, preventing neighbours from hitching a ride on your signal booster.

Researchers are also investigating how they can program a network of devices to communicate with each other to manage power more efficiently, dubbed “genetic programming” by Lester Ho, a computer scientist at Bell Labs. The expansion of Bell Labs Ireland will lead to new work in areas such as allowing networks to self configure and optimize themselves as well as testing new systems that can recover dissipated heat in telecommunications devices.

“What I like is that there is still an academic feel here,” says Peter Cogan, one of a handful of physicists at the Dublin centre. “There are around 11 nationalities with 50% being international and 50% Irish.” Cogan, who did a PhD and a post-doc in gamma-ray astronomy before joining the lab last March, also points out that he is doing similar day-to-day tasks as to what he did as a researcher. “Then I was writing programmes and doing data analysis. That was to understand basic physics but now I am doing similar things to understand network optimization.”

London, the ‘polycentric’ city

How do commuters move around in big cities? Most people would assume that they all do pretty much the same thing: travel from the outskirts to the centre, and then back again. Yet according to a group of physicists in the UK and France, this is not the case.

“The popular conception of a city – that people work in the centre and live around the edge – is, to a certain extent, a gross simplification of what actually happens,” says Michael Batty, director of the Centre for Advanced Spatial Analysis at University College London (UCL). “The notion that one could simplify the sort of complexity that is evident is probably a non-starter.”

For decades town planners have analysed how people move in cities to figure out how to reduce congestion. However, data typically come from samples, such as household surveys, performed every five to ten years, and these only give a sketchy overview.

Popular journeys in London

Batty, together with colleagues at UCL and the School for Advanced Studies in Social Sciences in Paris, has investigated how people move around in London using data derived from subway travel cards – or “Oyster cards”, as they’re commonly called. Because such cards give the unique ability to track where people are going from and to for most journeys, the researchers were able to build up an accurate hierarchy of the most popular journeys taken in London.

Some of the results might surprise commuters and town planners alike. Commuters starting in different locations will often travel roughly the same distance, yet there is a huge variation – a “heterogeneity” – in where they travel to. For example, while Batty’s group found a strong travel link between the main financial district (the City) and Notting Hill, they found no similar link between the City and South Kensington, just a few miles south. Instead, South Kensington linked strongly with Westminster. The implication, therefore, is that those living in Notting Hill tend to work in the City, while those living in South Kensington are more likely to work in Westminster.

Overall, the researchers found that London contained no single centre, but instead has around 10 “polycentres” that interlink in complex patterns. “One of the conclusions is that city centres in big global cities like London really have to be unpacked and looked at in detail,” explains Batty. “But having said that, there’s an implicit conclusion that if you looked at any city centre, on whatever scale, you would find it to be considerably more heterogeneous than you had assumed it to be in the past.”

Extended to mobile phones

Indeed, the researchers’ study is a good example of how data deriving from everything from GPS trackers to banknotes can be used to analyse human mobility (see “The flu fighters). Marta González, a physicist who studies human mobility at the Massachusetts Institute of Technology, US, says that it could help develop strategies for reducing congestion. “I really benefited [by examining Batty and colleagues’ techniques], which could be extended to analyze flow from other data sources, such as mobile phones,” she adds.

Batty isn’t certain how the study will be used, but suggests that it might throw light on future travel projects in London, such as the underground “Crossrail” plan. He also believes that the analysis could be repeated in other places that have automated subway ticketing, including New York City, Singapore, Hong Kong and Tokyo.

The research can be found as a preprint at arXiv: 1001.4915.

Neural interactions point to post-traumatic stress disorder

Post-traumatic stress disorder (PTSD) is a difficult condition to diagnose because scientists have yet to identify biological markers associated with the disease. Instead, doctors must rely on a patient’s descriptions of flashbacks, worry and emotional numbness when making a diagnosis. Now, researchers at the University of Minnesota Medical School have shown that measurements of the tiny magnetic fields created by brain activity can be used to identify genuine PTSD sufferers with high confidence – and without the need for patients to relive painful past memories.

The measurements are made using magnetoencephalography (MEG) – an established non-invasive technique that provides detailed information on the brain in almost real-time. This is done using superconducting quantum interference device (SQUID) sensors to measure the magnetic fields generated by currents flowing in and around neurons. However, these magnetic field signals are extremely weak – typically between about 10–14 and 10–13 Tesla – and are therefore easily overwhelmed by background magnetic noise. Although various techniques exist to reduce this noise, none are entirely satisfactory because they can also reduce the size of the signals produced by the brain itself.

The work by Apostolos Georgopoulos and colleagues builds on earlier investigations by the same group that demonstrated the potential of MEG to diagnose certain brain diseases from patterns of neuronal interaction (see “MEG differentiates functional brain disease“).

Interactions between signals

“The key idea that we have been using is that the essence of brain function is communication,” explains Georgopoulos. “You have a clean signal, but when you look at the interactions between these different signals, this is where we find the big difference between people with the disorder and healthy controls.”

The conditions studied previously, which included multiple sclerosis, schizophrenia and Alzheimer’s disease, have a clear pathology, Georgopoulos said. PTSD, on the other hand, is a purely functional brain disorder, which makes it particularly difficult to tell whether someone has the condition or not. This is where the MEG and the “synchronous neural interactions test” come into play.

Acquiring the MEG data is extremely easy and very safe, Georgopoulos said. “The acquisition itself is trivial: it takes about one minute to acquire the data. It is incredible how efficient the method is,” he commented. The equipment is, however, expensive to run because it must be cooled by liquid helium. Properly trained personnel are also needed to carry out regular maintenance and quality-control checks.

Subtle take

This latest study involved 74 patients with a diagnosis of PTSD who were known to the US Department of Veterans Affairs Medical Center in Minneapolis, and 250 similarly aged healthy controls recruited from the general population. Most of the patients (56) were taking medication designed to combat their anxiety.

During the test, all subjects lay supine in an electromagnetically shielded chamber and focused for 60 seconds on a spot that was approximately 65 cm away from them. MEG data were acquired using a 248-channel axial gradiometer system lowered close to the head.

A “bootstrap-based” approach – in which the sample population being assessed was repeatedly altered at random – was used to classify subjects into two groups. The overall accuracy of the test came out at over 90% using this approach and all but two of the PTSD patients were identified correctly.

The method has “great clinical potential” as a diagnostic aid in cases of PTSD, according to Georgopoulos. Assessments of brain function are usually performed while subjects carry out a relevant task, so people claiming to have PTSD could be asked to view pictures or movies likely to trigger bad memories. With this MEG-based test, subjects merely stare straight ahead for one minute.

The benign nature of the test means that subjects are far more willing to return for repeat assessments, making it far easier to monitor the effects of therapy. Successive measurements could ultimately be used to predict the extent of remission and the likelihood of relapse in individual patients, Georgopoulos suggested.

The work is described in J. Neural Eng. 7 016011.

Peer reviewers accused of nepotism

lions.jpg
Are reviewers looking out for their own? Credit: David Dennis, Wikimedia Commons

By James Dacey

Every researcher understands the prestige and career opportunities that can present themselves if they can just get their work published in a major academic journal. If that paper contains a genuine “world first” then a young researcher can be set up for a glorious career. How would you feel then if this process was being abused by reviewers seeking to steal glory for themselves and their mates?

This is the accusation made by 14 stem cell researchers in a letter to several major journals in their field. The researchers believe that the peer review process is being corrupted by reviewers deliberately stalling, or even stopping, the publication of new results so that they or their associates can publish the breakthrough first. They also blame the journals for not doing enough to prevent this behaviour from happening.

“It’s hard to believe except you know it’s happened to you where papers are held up for months by reviewers asking for experiments that are not really fair or relevant,” says Austin Smith, director of the Wellcome Trust Centre for Stem Cell Research in Cambridge, UK.

Smith, who was speaking this morning on BBC Radio 4’s Today programme, is concerned that reviewers can no longer remain objective when there is so much at stake with these publications. “A paper in Nature or a paper in Cell is worth your next grant – it could be worth half a million pounds,” he says. Very serious allegations indeed…

You can hear the full broadcast here.

The flu fighters


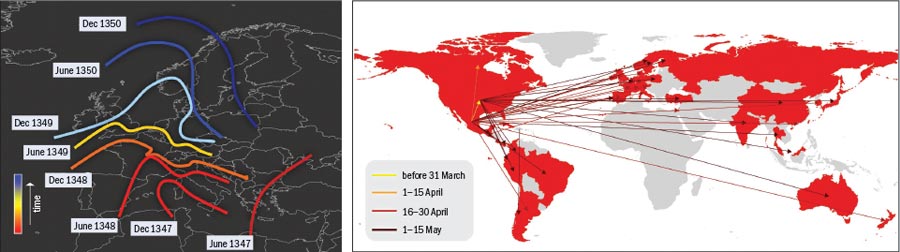
The Black Death was one of the most devastating pandemics in history. Beginning in 1347, the plague took just three years to spread from Constantinople in western Turkey to Italy and then on to the rest of Europe, leaving nearly a quarter of the continent’s population dead in its wake. Historical studies confirm that the disease diffused smoothly, generating an epidemic front that travelled through the continent as a continuous wave at a rate of about 200–400 miles per year.

In 14th-century Europe few means of transport were available and travellers could cover only relatively short distances in a day. The advent of modern transportation has dramatically altered this picture, speeding up disease transmission significantly. For example, the influenza pandemic of 1918 took just one year to spread from its US or European source to isolated Pacific islands, while the 1957 flu virus swept the globe in about six months.

On 11 June 2009 the World Health Organization (WHO) declared that a new virus, known as H1N1 influenza or “swine flu”, had become the first pandemic of the 21st century. This time, only two months passed between the first international alert and the WHO’s announcement. From a scientific and public-health perspective, such rapid transmission posed an unprecedented challenge: we and other groups working at the interface between physics, epidemiology and computational science needed to track the evolution of the pandemic in real time. Under these circumstances, there is a large degree of uncertainty in what will happen. How fast will the virus spread to new countries? What will be the impact on the population? How dangerous is it? And, most importantly, what weapons do we have to fight it?

As an interconnected, mobile society, we face a number of disadvantages in combating pandemics. Fortunately, we also have some advantages over our predecessors. These include not only significant progress in medical science, but also a powerful new epidemic-fighting weapon: computational models derived from network science, mathematical epidemiology and the statistical physics of reaction-diffusion processes. In the words of evolutionary biologist Andrew Dobson, models are now “as crucial in the study of infectious diseases as are microscopes, stethoscopes and the tools of molecular diagnosis”.

Models can be used to assess the impact of epidemics and pandemics on human health, and to predict the geographical spread of a disease, the expected number of cases and the timing of an epidemic’s peak. Numerical results from these models can help alert health officials, guide planning for social-distancing measures like school closures, and suggest strategies for the development, production and administration of vaccines. They can also allow public-health experts to assess the impact that all these interventions might have in mitigating the pandemic.

The role of physics

Physicists have long used computational approaches to solve problems involving a large number of degrees of freedom, and can now simulate material processes and physical phenomena on a wide range of scales. It is now almost routine to study, say, fracturing processes in materials by simulating over a billion atoms or to solve evolution equations for six billion finite elements in plasma fluids. Furthermore, the advent of ab initio, Monte Carlo and other simulation techniques in areas such as quantum chemistry, molecular dynamics and materials science has made it possible to calculate the behaviour of single atoms or aggregate states of matter from first principles.

Given these successes, it is natural to wonder why we are at a far more primitive stage in the quantitative forecasting of how newly detected emerging diseases (or even seasonal influenza) will evolve. The basic difference is that even though the simulation of six billion human beings is in principle computationally feasible, the models used in epidemic and contagion processes have to include social and behavioural factors, not just the (comparatively simple) physical laws governing fluids or atomic motion. So, while the theoretical foundation required to approach the spread of diseases computationally has been in place for a long time, progress has been hindered by a lack of data on how people interact, travel and behave – as well as on how communities are structured, and how they react to environmental, political, technological and cultural factors. All these layers – from the single individual to the global society and its surrounding environment – interact at multiple scales, thereby increasing the complexity of the phenomena to be modelled and creating formidable obstacles to the development of predictive computational approaches.

The last decade has, however, witnessed a sharp increase in our capacity to gather these data. This is mostly because the boundaries between real-world social behaviour and the cyberworld have started to disappear. Devices like mobile phones and personal digital assistants produce detailed traces of our daily activities. Websites have sprung up to record data, such as the dispersal of banknotes that can be used to infer human interactions and mobility, as shown by Dirk Brockmann and co-workers (see page 31, print edition only). This huge mass of data is changing our understanding of a wide range of phenomena by producing quantitative descriptions of large-scale social systems.

As a result of this data revolution and increased computer-processing power, researchers are now beginning to integrate large-scale datasets into models of mathematical epidemiology. This means that we are finally in a position to move from analysing the “social atom”, or small social groups, to analysing “social aggregate states” made up of millions of people. But in making this transition – which is equivalent to the shift from atomic and molecular physics to the physics of bulk matter – we must confront the complexity of the system that emerges from the collective behaviour of a large network of interacting units.

Networks that trace the activities of individuals, social patterns, transportation fluxes and population movements all exhibit large-scale non-uniformity that emerges spontaneously as the system evolves. The statistical distributions characterizing the fluctuations in these networks are generally “heavy-tailed”, meaning that their standard deviations are extremely large – there are no “typical” values for many of the quantities of interest. For example, the distribution that defines the probability that each node in the system (representing anything from an individual to a country, depending on the model) is connected to k neighbouring nodes is often approximated by a power-law decay. This indicates that there is an appreciable probability that some nodes may have orders of magnitude more connections than the “average” value of k for the system. A similar pattern is also observed for the intensity of the flow between connecting links, transport flows and other basic statistical quantities characterizing the network structure.

Our ability to deal with such systems – where the behaviour at any scale is the outcome of a complicated interplay among processes that occur on very different time and length scales – places an important constraint on efforts to model emerging infectious diseases. Fortunately, some of these same difficulties have already been addressed in physical systems that feature phenomena such as turbulence or critical behaviour (“tipping points”). Tools that were developed for these problems, including renormalization-group techniques, timescale-separation approaches and homogenization methods are therefore viable candidates for addressing the new challenge of pandemic modelling.

Network-based models

The network perspective itself is also creating new mathematical tools and approaches. Both physicists and epidemiologists have recognized the importance of network structure in the spreading of diseases in a globalized world and have developed models that explicitly integrate multiscale mobility networks into the description of emerging diseases. For example, although the spread of the Black Death can be adequately described mathematically using continuous differential equations with diffusive terms, in modern times the spread of epidemics is mainly determined by the human-mobility networks that allow infected people to travel across continents in less than a day (see “Speed of epidemic propagation”). The current swine-flu pandemic, therefore, cannot be simply described in terms of diffusive phenomena but must explicitly incorporate the spatial structure and deep interconnectedness of today’s modern society.

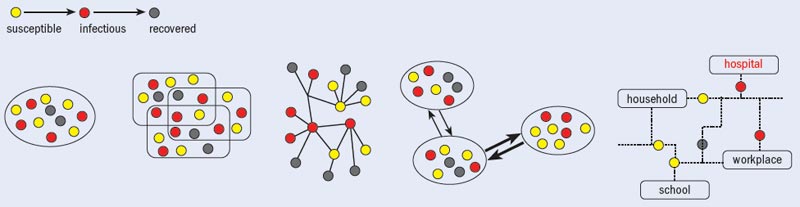
In recent years, two major classes of models have emerged that are particularly useful for simulating influenza-like illnesses (see “Model approaches”). The first, known as the agent-based approach, keeps track of each individual in a population in an extremely detailed way. Agent-based models typically take into account the fact that infection can spread among individuals by contacts between household members, school and workplace colleagues, and by random contacts in the general population. One key feature of such models is that they characterize the network of contacts among individuals based on the socio-demographic structure of the population.

The second scheme relies on meta-population models that consider the long-range mobility of people at an inter-population level, while using coarse-grained techniques at the level of individual interactions. In such models, the world is divided into geographical regions that define a sub-population network. Connections among each sub-population represent the fluxes of individual humans due to the transportation infrastructure. Infections evolve inside each urban area, and this process is described by schemes in which the discrete, stochastic dynamics of the individuals in different compartments depends on the specific causes and origins of the disease and any containment interventions.

Of these two techniques, agent-based models provide a large amount of data, but their computational cost and – most importantly – the need for very detailed input data has, to date, limited their use to a few country-level scenarios. The structured meta-population models, in contrast, are fairly scalable and can be conveniently used to provide worldwide scenarios and patterns. Although the level of information that can be extracted is less detailed than in agent-based models, the spatial and temporal ranges, and the number of realizations that can be computationally analysed, are all much larger.

Modelling a pandemic in progress

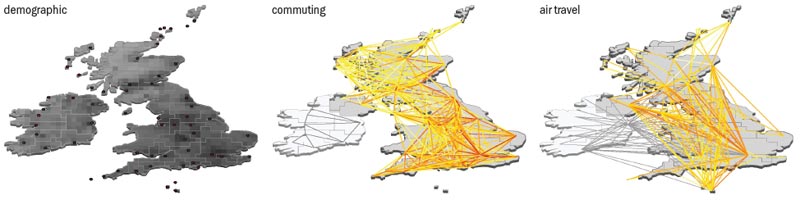
While the recent growth of computational epidemiology laid the foundations for a first-principles approach to modelling epidemics, the swine-flu pandemic represents the first time that such computational methods have been used to model the spread of an infectious disease in real time. So far, the results have been extremely encouraging: state-of-the-art, large-scale computational approaches have been able to capture the spatio-temporal pattern of the unfolding epidemic quite accurately, making projections up to three weeks in advance. In particular, it has proved possible to anticipate which urban areas or countries will observe the first local cases of the disease, and thus become “hotspots” of the epidemic. Remarkably, different methodologies – including the Northwestern University group’s proxy networks and our own approach, which is based on the integration of real transportation and mobility data (see “The GLEaM model”) – provide very similar patterns and results. This indicates that the basic elements considered in the models – population distribution and human-mobility networks – are able to capture the main features of the epidemic’s evolution.

The integration of large-scale mobility networks into epidemic models is also providing new ways to estimate the virus’ transmissibility and other basic parameters of the epidemic. Disease transmissibility, for example, is usually indicated by the mean number of secondary cases that a typical infected individual generates in a population with no immunity. This quantity is often estimated using temporal data on the number of cases detected in each country. However, the accuracy of these data depends on whether cases are spotted and properly reported to health authorities, and as a result they sometimes give a very misleading picture of an evolving epidemic. For example, several studies indicated that the official number of swine-flu cases reported by the authorities in Mexico, where the virus was first identified in April 2009, had underestimated the actual impact of the epidemic by a factor of 100–1000.

Using the mobility-network approach, we can instead calculate transmissibility using data on the first handful of cases detected in newly affected countries. These data tend to be more accurate. This new approach is possible because the chronology of the infection of new countries is determined by two factors: the number of cases generated by the epidemic in the originating country; and the mobility of people from this country to the rest of the world. The mobility-network data are defined from the outset with great accuracy, and we can therefore determine the parameters of the disease by calculating which values best fit the computational-model results for the chronology of infection in new countries. This strategy has already been used by the WHO Rapid Pandemic Assessment Collaboration, Harvard University epidemiologist Marc Lipsitch and co-workers, and by our own group to provide independent early estimates of the transmissibility of the swine-flu pandemic virus and the cumulative incidence in Mexico.

Another notable success for this strategy was that we were able to predict several months in advance that the swine-flu pandemic in the US and the northern hemisphere would peak between late October and late November 2009. Being able to anticipate such peaks is crucial for testing possible vaccination scenarios, since the effectiveness of mass-vaccination campaigns depends on having vaccines available at the right time and in the right place. In this context, data-driven computational models can shed light on the fuzzy pandemic future, and serve as in silico experiments on the effectiveness of mitigation strategies.

More to be done

The swine-flu pandemic has shown that computational tools can be used successfully and considered as a support tool in the complicated decision-making process of public-health policies. Yet even before the current pandemic started, simulation results had already fundamentally altered our understanding of the interplay between social behaviour, infrastructures and the biological processes of infectious diseases. Thanks to analysis performed by Deirdre Hollingsworth, Neil Ferguson and Roy Anderson at Imperial College London; the computational approaches of Ben Cooper and Joshua Epstein (based at the UK Health Protection Agency and the Brookings Institute, respectively); and our own analytical and simulation work, by 2006 researchers knew that travel restrictions alone would do little to contain or even slow down a global epidemic. Using reaction-diffusion techniques, we were able to show that the topology of the air-transportation network and the traffic flow through it meant that unless traffic restrictions were more than 90% effective, they would not delay the peak of a pandemic by more than two to three weeks. And, of course, such a drastic reduction in air travel would quickly lead to social and economic disruption.

The same interconnectedness that makes draconian travel restrictions impractical also reduces the effectiveness of any containment or mitigation strategies that are limited to a single country. A traditional strategy for epidemic control assumes that drugs will be used in the very few countries in the world capable of amassing stockpiles, but in a highly connected world such localized mitigation is not as effective as a coordinated global strategy. If wealthy countries are willing to share a very small fraction of their stockpiles of antiviral drugs with developing countries, in contrast, this would hugely mitigate the impact of a pandemic.

In some ways, computational approaches to the spread of epidemics are remarkably similar to the sophisticated simulation methods used in physics. In both cases the “social atoms” interact, move and react in constrained spaces. The final aggregate state (the social system and its epidemiology) is the outcome of the principles governing these microscopic processes. However, a major difference has to be factored in. Unlike a physical system, the unfolding of the epidemic is going to affect the individual’s behaviour. Indeed, even the model predictions themselves – along with news about the epidemic that is transmitted via a variety of media sources – could affect the choices people make, like deciding to travel less. This social adaptation to the available information is part of the dynamic of the system. Paradoxically, the model’s reliability produces, through its predictions, a feedback on the model itself.

This issue is still uncharted territory. Current models focus largely on situations where steady-state data are used to study the system under normal conditions, in which the social behaviour is not altered or disrupted. The next challenge is to develop formal models that can deal with the prediction–adaptation feedback loop and the possibility of their validation. This is something that goes beyond the physics of fluids, gases and particles, or the “physics” of non-adapting social atoms. And it is where a truly interdisciplinary collaboration among physicists, epidemiologists, computer and social scientists is inevitably needed.

At a glance: Modelling epidemics

  • Modern pandemics spread more quickly and less uniformly than in the past, thanks to the global air-transportation network and the complex and interconnected nature of our society
  • Modelling the spread of new infectious diseases requires theoretical and computational models that take into account physical and biological principles plus social and behavioural factors
  • A range of new tools for simulating influenza-like illnesses has been developed in recent years, allowing researchers to predict how events like the current H1N1 flu pandemic will evolve

References

R M Anderson and R M May 1992 Infectious Diseases of Humans: Dynamics and Control (Oxford University Press)
D Balcan et al. 2009 Multiscale mobility networks and the spatial spreading of infectious diseases Proc. Natl Acad. Sci. USA 106 21484–21489
D Balcan et al. 2009 Seasonal transmission potential and activity peaks of the new influenza A(H1N1): a Monte Carlo likelihood analysis based on human mobility BMC Medicine 7 45
D Brockmann, L Hufnagel and T Geisel 2006 The scaling laws of human travel Nature 439 462–465
V Colizza and A Vespignani 2007 Invasion threshold in heterogeneous metapopulation networks Phys. Rev. Lett. 99 148701
B S Cooper et al. 2006 Delaying the international spread of pandemic influenza PLoS Med. 3 e12
J M Epstein et al. 2007 Controlling pandemic flu: the value of international air travel restrictions PLoS ONE 2 e401
N M Ferguson et al. 2006 Strategies for mitigating an influenza pandemic Nature 442 448–452
C Fraser et al. 2009 Pandemic potential of a strain of influenza A(H1N1): early findings Science 324 1557–1561
T C Germann et al. 2006 Mitigation strategies for pandemic influenza in the United States Proc. Natl Acad. Sci. USA 103 5935–5940
M C Gonzalez, C A Hidalgo and A-L Barabási 2009 Understanding individual human mobility patterns Nature 453 779–782
M E Halloran et al. 2008 Modeling targeted layered containment of an influenza pandemic in the United States Proc. Natl Acad. Sci. USA 105 4639–4644
T D Hollingsworth, N M Ferguson and R M Anderson 2006 Will travel restrictions control the international spread of pandemic influenza? Natl Med. 12 497–499
M Lipsitch et al. 2009 Use of cumulative incidence of novel influenza A/H1N1 in foreign travelers to estimate lower bounds on cumulative incidence in Mexico PLoS ONE 4 e6895
S Riley 2007 Large-scale transmission models of infectious disease Science 316 1298–1301

Your favourite units

Units are among the most intriguing features of science. They are the “bridges” between the empirical world of physical phenomena and the non-empirical abstract world of mathematics, allowing us to traffic back and forth. Once upon a time, many bridges of different varieties existed independently of each other. Over the years, the International Bureau of Weights and Measures (BIPM) has consolidated them into a single network, the “International System of Units” (SI).

SI is an elaborate convention consisting of seven base units – the metre, kilogram, second, ampere, kelvin, candela and mole – and numerous derived units, such as the hertz, volt, newton, coulomb, tesla and ohm, with still other units “accepted for use” within it, such as the tonne (103 kg) and day (86,400 s). These are all fully ingrained in the scientific world, yet some pre- and non-SI units persist outside and even inside the scientific world. In September 2009, I asked you to submit your favourite examples, and I received hundreds of replies.

Pre-SI units

Many pre-SI units arose directly out of everyday life. Consider those mentioned in Eric Cross’s novel The Tailor and Ansty, a book that gave such precise voice to Irish wit and poetry that it was banned the year after it was published in 1942. The book concerns a country tailor who is fond of relating the wisdom of the old Irish, that is, before “the people got too bloodyful smart and educated, and let the government or anyone else do their thinking for them”. Some of this wisdom involved units.

Land, the tailor announces, used to be reckoned in “collops”. The collop, based on the “carrying power” of land, “told you the value of a farm, not the size of it. An acre might be an acre of rock, but you know where you are with a collop”. One collop, for example, was the area needed to graze “one sow or two yearling heifers or six sheep or twelve goats or six geese and a gander”, while three collops were needed to graze a horse. The tailor complains of a neighbour’s boast of owning 4000 acres – which sounds like a plantation, but the area only has “enough real land to graze four cows”. The tailor is surely exaggerating here (small surprise), for few people in his area own so much land, and it seems likely that 1000 acres in the west of Ireland, despite all its bogs and rocky hills, would be more than enough to serve the average cow. Nevertheless, his point is that a collop-measure cuts the neighbour’s boast down to size. “The devil be from me! But the people in the old days had sense.”

The old Irish also had a superior way of reckoning time, the basic unit of which was the lifespan of a rail, a type of small bird. The tailor then translates a list of units based on it: a hound outlives three rails; a horse outlives three hounds; a jock outlives three horses; a deer outlives three jocks; an eagle outlives three deer; a yew tree outlives three eagles; and an old ridge in the ground outlives three yew trees. There is no need to go further, for three times the age of the ridge is the age of the universe.

The tailor is wildly off (small surprise) in his estimate of the age of the universe, which is unlikely to be (lifetime of the rail) × 38. Still, his point is well made that the old Irish unit system may possess certain superiorities to ours in that it was “reckoned on the things a man could see about him, so that, wherever he was, he had an almanac”.

Physics World respondents gave numerous examples of similar pre-SI units derived from the world’s almanac. John Blake, a retired physicist and patent attorney living in Winchester in the UK, who spends several months a year in Spain, reported that the dia de buy (or “ox-day”) is still used in rural parts of Asturias in northern Spain. It refers to the amount of land a farmer can plough using an ox, which depends on soil and crop; a 50 ox-day plot of land (one day’s ploughing per week) is enough to give a farmer self-sufficiency for his family.

Other respondents liked the “chain”, that once-indispensable surveying tool invented in the 17th century. Equal to 22 yards, the chain has left its mark on everything from the cricket pitch (1 chain) and the definition of the acre (1 × 10 chains) to the length of countless city blocks. David Brandon from the Technion in Israel, meanwhile, was fond of the “firkin” – a wooden barrel that could hold nine imperial gallons, which just happened to be the quantity of beer needed to fuel parties back in his undergraduate days at Cambridge University. “Think about it: nine gallons or 72 pints [was] just about enough to keep 20 students happy until they were thrown out of college at midnight,” he explained.

SI and SI hybrids

Some readers, however, questioned the SI system itself. Indeed, as Jim Bogan, a retired physicist living near Eugene, Oregon, pointed out, units based on the CGS (centimetre–gram–second) system are still standard in astrophysics; stellar masses, for example, are often measured in grams. However, Bogan is no fan of CGS: it means that the Earth–Sun distance (1 astronomical unit or AU) is a ridiculous 15,000 giga-centimetres or 15 tera-centimetres, which requires two Greek prefixes. It would be more aesthetic, he proposed, to use the MGS (metre–gram–second) system, in which 1 AU is 150 giga-metres.

The MGS system would leave the Planck and gravitational constants unaffected – h = 6.625 x 10⁻³¹ g m2s–1, and G = 6.673 x 10⁻¹⁴ m3g–1s–2 – changing only in order of magnitude. Electromagnetic units would also be unaffected in the MGS system, although electrodynamic units, like the Planck length, mass and time, would have to be rescaled. The plus of the MGS system is that it would unite the CGS and the MKS (metre–kilogram–second) system, which “has been a headache for physicists and their students for over a century”. But Bogan is not holding out much hope for things changing any time soon, because of what he dubs a “rigid adherence” to the SI force standard of the newton. “Trying to change this is like battling city hall,” he complained.

I posed this to Richard Davis, head of the BIPM’s mass section and a man wise in the ways of SI (and whose favourite non-SI unit is the perch for sentimental reasons; the deed to his former home in Washington, DC, gave the dimensions of the property in those units). Davis’s two-part answer explains why nearly all suggested improvements to SI are never quite as good as they seem. Part one is historical: the SI system was built on the legacy of the decimal metric system in an attempt to maintain historical continuity as much as possible. Recognizing the formidable difficulty of changing measuring habits, SI took into account units that were in wide scientific use while tying up loose ends. This is the reason why one of the base units – the kilogram – contains a prefix, which otherwise does not seem to make much sense, though allowing this unit as an exception seems harmless.

The other part of the answer, Davis said, involves “coherence”, in the special meaning given this term by the “SI brochure”. “If you take any equation of physics, you can plug in SI values for all quantities and it automatically works as it should; that is, in a coherent system like SI, there is never a need to tack on additional constants that were not originally in the equation,” he said. The MGS system is not coherent, in Davis’s eyes. “Take everybody’s favourite equation: E = mc2,” he explained. “If, on the right-hand side, I plug in mass in kilograms and the speed of light in metres per second, my result automatically appears in joules. But in the MGS, the Einstein relation would become E = km mc2, where m is in grams, c is in metres per second, E is in joules and km is a conversion factor equal to 10–3 kg g–1. Many of the bright ideas for reforming SI would lead to incoherence in this way.” The requirement of coherence, Davis added, helped guide the way in which additional base units, such as the ampere and the kelvin, were introduced into SI. City hall has its reasons.

Thomas Yeung, from Suffolk in the UK, was one respondent who espoused the merits of the litre (10–3 m3) – another example of a non-SI unit that is “accepted for use”. (The coherent SI unit of volume is the m3, which has no special name. The litre is not a coherent SI unit because 1 l = 10–3 m3 – an equation containing an extra factor that does not equal one.) Indeed, Yeung measures his car’s petrol consumption in miles per litre, preferring it to the old miles per gallon because fuel in the UK is now usually priced by the litre. “I know it combines imperial and metric units,” Yeung explained, “but it’s easily understood (more miles per litre is better, fewer is worse). [It also] allows drivers to gauge how much fuel they need in litres to make a specific journey in miles, and has a sensible scale, with normal cars having a value between 5 and 10.” The European measure of litres per 100 km, in contrast, indicates better efficiency with a lower number.

But the Physics World community also includes several die-hard and principled SI enthusiasts. Peter Main, an emeritus professor of physics at the University of York in the UK, told me that his son Andrew is an absolute SI fundamentalist who refuses to observe normal birthdays and instead measures his age in megaseconds. Andrew (a software engineer) admits that although the second is an astronomical accident – originally related to the rotational behaviour of the Earth – at least it is SI and is now defined without reference to the solar system. His father has taken on the spirit, if not the letter, of his son’s position by informing students that the length of each lecture is a “microcentury”, which corresponds to 52 minutes and 36 seconds.

Off SI

Many non-SI units have, however, survived. Gary Harper, an engineer stationed with the US military in Okinawa, Japan, cites the mil – an angular measure used worldwide – as an example of a non-SI unit that persists due to sheer practicality. Artillery personnel find it useful because a mil at a thousand yards or metres is about a yard or metre, “which makes it easy to adjust artillery fire”. Gil Ross liked the “nebule” – a unit minted in 1938 to measure visibility at night. It is a unit of obscuring power “such that 100 units reduce the intensity of light to 1/1000th part of its incident value”.

John Hearle, an emeritus professor of textile technology at the University of Manchester, liked the N/tex, a unit for specific stress, and claims in an appendix to the fourth edition of his book Physical Properties of Textile Fibres that it deserves a special name apart from its strict SI sibling, N m kg–1, or its other names, psi/(gm/cc) and BTU/lb. Many physicists liked “the barn” (10–28 m2), which is used widely in nuclear and high-energy physics to express the likelihood of one particle scattering off another and with its amusing origin during the Second World War to apply to the cross-section of uranium nuclei (“as big as a barn!”) that is a well-known part of physics lore. Its cousin is “the shed” (10–24 barn). Bryan Lovitz pointed out that the yoctometre squared, the smallest SI area unit, is 10,000 sheds.

Another class of non-SI units names the “least amount”. Andy Taylor, a retired instrument engineer, said that a “midge” was “the smallest amount of linear or rotational movement achievable at the output of a given mechanical or electrical device, within the constraints of static friction, the adjustment mechanisms provided by the designer and the dexterity of the operator”. Paul Wilby, a teacher in the East Midlands, liked the “gnat’s whisker” – a subdivision of that somewhat larger, well-known unit that, because Physics World is a family magazine, I’ll call a “gnat’s testicle”. Kevin Meyer, a physicist and software engineer from South Africa, explained the technical terms used to capture signals: a “tweak” is a fine-tune, a “twiddle” a gross manipulation and a “frob” an aimless manipulation.

Off-off SI

Yet another category of unit is light-hearted and of no practical value except for satirizing, spoofing or symbolizing the process of unit-making itself. The classic example of a unit used ostensibly to measure an entirely subjective property, for instance, is the “helen”, named after the line in Christopher Marlowe’s Doctor Faustus referring to Helen of Troy’s face as having “launch’d a thousand ships”, implying the “millihelen” as the amount needed to launch one. Niki Walton insisted that the amount of breath needed to blow out candles on a child’s birthday cake is measured in “ant-farts”, while Tony Yule’s favourite units were the “cows” and “dogs” that his A-level physics teacher wrote on his graphs as axis titles when he had omitted them.

The classic example of an improvised unit named for a person is the “smoot”, after Oliver Smoot, a freshman at the Massachusetts Institute of Technology whose height was used to measure the length of the Massachusetts Avenue Bridge in 1958. But Physics World readers knew of others. At the annual sailing event of Bill Clay’s company, 0.01 knots is called a “rick” after an employee who is particularly adept at setting the sails to optimize the yacht’s performance. Alison Lees (née Procter) recalled an A-level biology class in which her classmates were using uncalibrated electronic sensors to measure some quantity. Her protest against marking outputs in “arbitrary units” provoked a discussion on the nature of units – and the recording of the outputs in “proctors”.

Matthew Evans, meanwhile, claimed that his brother, who, like him, has a degree in physics from the University of Southampton, concocted a set of units based entirely on cruelty to moles: a mole of gas is the amount that can fill a mole before it explodes, a mole of length is the distance a deflating fully-inflated mole propels itself, a mole of area is how thinly you can spread a single SI-standard mole, and so on. “Purely theoretical,” Evans insists, lest the animal-rights organization PETA adds unit determination to its agenda.

As for Nigel Branson, he recalled how his physics teacher used to use the “Sanders Theatre cushion” as a unit of absorption. The teacher had in mind the story of how the US physicist Wallace Sabine, a pioneer of architectural acoustics, came up with a formula relating reverberation time to absorption, volume and surface area by experimenting with the seat cushions from Harvard University’s Sanders Theatre. Imprecise, perhaps, but it worked. Other improvised units used for estimation include the “Nelson’s Column” (for height), the “Sydney Harbour” (for volume) and Physics World‘s own bête noir the “football field”, to describe the area of everything from solar power plants to telescope arrays, which last year drew criticism from certain readers.

The critical point

Given that SI was designed to serve the needs of the scientific community (and, as much as possible, those of ordinary life) why do so many non-SI units continue to be used? SI is, after all, carefully supervised, maintained and continually improved, which makes it somewhat odd that some non-SI units seem so actively to resist SI. The reason, as the above contributions demonstrate, is that units serve human needs, and the needs of everyday life are diverse and continually changing.

Even satirical and silly units have a valuable function, for they bring to light the conventional character of units without forcing us through the trauma of a breakdown or transition. All this seems to confirm Gary Harper’s suspicion that, after having witnessed decades of changes in SI and non-SI units, the strongest human instinct does not involve survival, procreation or protection of the young, but “the desire to modify the current measurement system”. No doubt Physics World readers will continue to want to make their own changes.


Law and the end of the world

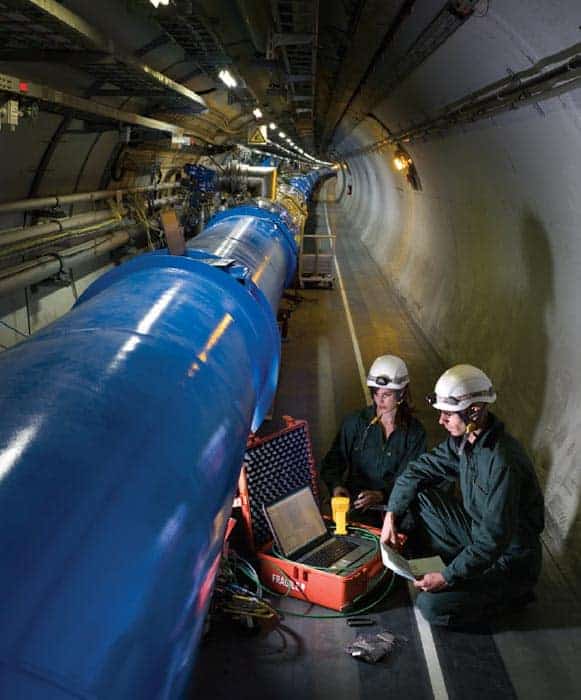
Large Hadron Collider tunnel

Before the Large Hadron Collider (LHC) was switched on at CERN in September 2008, stories abounded that the machine might destroy the planet. The fear was that the €6.3bn LHC, which will collide protons together at energies of up to 14 TeV, would be powerful enough to create mini black holes that could consume the Earth – or that it might produce hypothetical “strangelet” particles that could convert the planet into a lump of ultra-dense “strange” matter. These stories certainly left their mark, with people telephoning the Geneva lab in tears imploring researchers not to switch on the accelerator.

Those at CERN never had any doubts that the LHC was safe. Safety reviews published in 2003 and 2008 both concluded that there was no danger that the particle collisions would lead to devastation. These reviews ultimately rested on the simple observation that higher-energy versions of these collisions take place billions of times each second in nature when cosmic rays smash into every object in the universe – bombardments that leave the Earth and all else intact. Indeed, since the collider restarted last November, it has generated record-breaking proton–proton collisions of 2.36 TeV without incident.

Some people, however, remain unconvinced and have tried to halt the LHC through the courts. Plaintiffs have filed lawsuits in Switzerland, Germany, Hawaii and the European Court of Human Rights. However, to date, no action has resulted in a decision on the merits of the case. The Swiss lawsuit was dismissed because CERN straddles the Franco-Swiss border and the lab’s treaties with France and Switzerland guarantee it immunity from legal process in both countries. The Hawaii suit was thrown out because the judge handling the claim ruled that US funding and participation in the LHC did not provide the Hawaii court with sufficient jurisdiction under the environmental law invoked by the plaintiffs.

However, Eric E Johnson, a lawyer at the University of North Dakota in the US, believes that such jurisdictional problems should not prevent justice from being done. Johnson has published a 90-page paper in the Tennessee Law Review (2009 76 819) arguing that the courts must use their power to halt hypothetically cataclysmic experiments such as the LHC if they are called upon to do so, and he puts forward the criteria by which the courts could pass meaningful judgements in such cases (see also arXiv:0912.5480v2).

Johnson claims that he has no intent or desire to shut down the LHC – or to “engender fear” – but believes that there are grounds for questioning CERN’s safety case. He acknowledges that the courts risk being manipulated by “frivolous objectors” if they simply decide it is better to be safe than sorry when confronted with requests for injunctions against extremely complex experiments like the LHC. But he believes that the courts must not shirk responsibility. “If the judiciary refuses to involve itself in such disputes, then the rule of law is lost,” he writes.

Courting trouble

The LHC is not the first accelerator to spark fears about possible catastrophes. Similar concerns arose following an exchange of letters in the July 1999 issue of Scientific American between particle theorist Frank Wilczek, who was then at the Institute for Advanced Study in Princeton, and reader Walter Wagner about collisions of gold ions at the Relativistic Heavy Ion Collider (RHIC) at the Brookhaven National Laboratory in the US. Wagner feared that the collisions might produce the dreaded strange-quark containing strangelets.

Brookhaven’s then director John Marburger appointed a committee of scientists led by Robert Jaffe of the Massachusetts Institute of Technology (MIT) to examine the matter before RHIC started up in 2000. The committee, which included Wilczek, concluded that strangelets posed no threat, partly because stable strange matter has never been observed anywhere else in the universe. It also saw no risk of RHIC producing Earth-devouring microscopic black holes because the collider would not be powerful enough to generate the gravitational forces required.

Unconvinced, Wagner, who was one of the two plaintiffs in the Hawaiian case against the LHC, filed a lawsuit in California in May 1999 to have RHIC stopped. It was eventually dismissed because the Californian courts said they had no jurisdiction over what takes place in New York, where the Brookhaven lab is located. A separate suit, filed by Wagner in New York in 2000, was also thrown out, because the Californian case was being actively pursued at the time.

12-sided shape filled with particle tracks

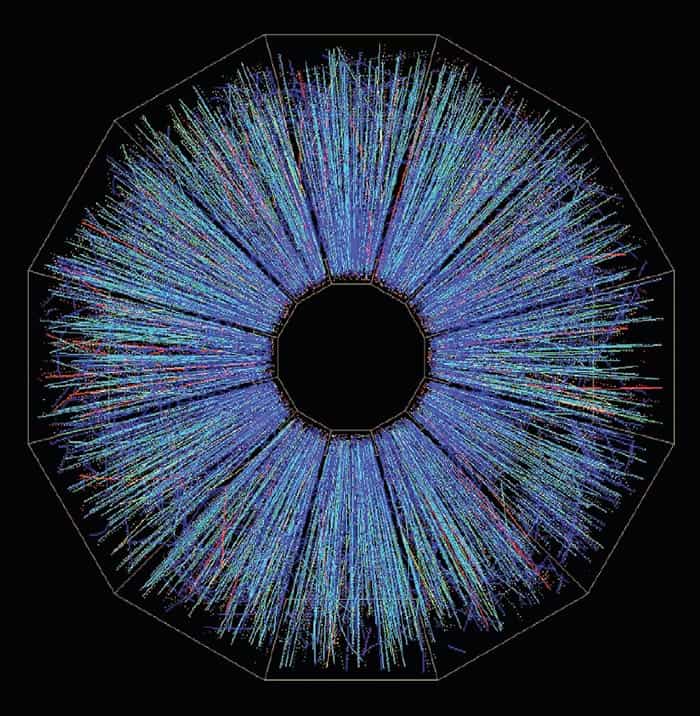
Although RHIC started up without incident, fears over the safety of colliders did not end there. In 2002 Steven Giddings, a string theorist at the University of California, Santa Barbara, suggested that the argument in the Jaffe report might not apply if space has more than the familiar three dimensions, just as string theory proposes (Phys. Rev. D 65 056010). The idea is that gravity appears much weaker than the other fundamental forces because it leaks into these tiny, extra dimensions. Accessing these tiny length scales, which would be within the reach of the LHC, might then provide the strength of gravity needed to produce microscopic black holes.

Seeking to head off similarly negative reaction to the LHC, the then director-general of CERN Luciano Maiani set up a committee to look into the new collider’s safety. Reporting in 2003, it acknowledged that black holes could potentially be produced by the collider, but that they would evaporate before doing any damage. However, some physicists continued to speculate that black holes might not necessarily evaporate and in 2007 CERN set up another safety panel – the LHC Safety Assessment Group (LSAG).

Its safety case was based on a refined version of the cosmic-ray argument contained in a detailed paper by Giddings and Michelangelo Mangano of CERN (Phys. Rev. D 78 035009). It had been suggested that the continued existence of the Earth might not prove the LHC was safe because the mini black holes created by cosmic rays would pass straight through the planet at high speed, whereas those made in the Geneva lab would linger inside the detectors (since the colliding protons meet each other head on). But Giddings and Mangano showed that certain kinds of white-dwarf star would be dense enough to trap mini black holes, if they existed. The fact that we observe these white dwarfs, the pair argued, proves that such black holes either do not exist or do no damage.

LSAG also concluded that the LHC, operating in heavy-ion mode, would be less likely to generate strangelets than RHIC, which – a decade after firing up – has still not produced any strangelets. “There is no basis for any conceivable threat from the LHC,” said the LSAG report, which was subsequently endorsed by CERN’s scientific-policy committee. “Indeed, experimental and theoretical developments since 2003 have reinforced this conclusion.”

Unearthing flaws

In his legal analysis, Johnson acknowledges that neither he nor any other non-physicist can hope to thoroughly evaluate the scientific substance of CERN’s safety case. But he believes there are plenty of “human factors” that would allow a court to sensibly pass judgement on this and other similar cases. Among these are the extent to which the theories underlying the safety case have become well established or are still the subject of debate between scientists. He regards the understanding of black holes to be in the latter category.

Even if such basic theory appears sound, Johnson also believes that courts could identify the potential for smaller-scale errors of modelling, calculation or observation. He points out that such errors have occurred before, such as when physicists at Los Alamos overlooked the effects of lithium-7 within the “Castle Bravo” H-bomb test of 1954, which led to the bomb’s explosive yield being underestimated by a factor of three. Johnson acknowledges that second guessing the assumptions of an incredibly detailed scientific analysis such as that carried out by Giddings and Mangano would be hard work; but he points out that Cambridge University quantum physicist Adrian Kent claims to have identified flaws in both the Jaffe report and in a separate report on the safety of heavy-ion collisions by Arnon Dar and two other colleagues at CERN.

In his paper, Johnson also discusses how psychology and sociology could be utilized in the courtroom. He points out that scientists may be predisposed not to believe that one of their experiments could wreak havoc, particularly when billions of dollars and years of work have been invested in it. Johnson also discusses the potential for “groupthink” – the idea, developed by psychologist Irving Janis, that striving for unanimity can override individual critical thinking. In addition, he believes that CERN’s safety reviews have been weakened by a significant conflict of interest: while all but one of the members of the 2003 LHC Safety Study Group were from outside CERN, there was only one outsider on the LSAG panel.

Rigorously reviewed

In response to Johnson, CERN communications chief James Gillies says that the lab’s safety analyses have undergone rigorous review. He points out that all of CERN’s operations must be endorsed by the lab’s governing council, which consists of representatives of the lab’s 20 member states. He also says that the scientific-policy committee is made up of non-CERN scientists and that the LSAG study underwent peer review.

One LSAG panel member – CERN theorist John Ellis – is highly critical of Johnson’s paper, saying it reads like “the prosecution in a Perry Mason trial, with every phrase unfriendly to the particle physicist”. Specifically, he points out that Johnson mistakenly states that the LHC is designed to “create particles that have not existed since the time of the Big Bang”, whereas the LHC will only produce particles already generated in cosmic-ray collisions. Moreover, as Fermilab particle physicist Don Lincoln points out, physicists have close control over these collisions. “The type of science we are doing is not nearly as unusual as you might think,” says Lincoln, who is also a member of the CMS collaboration at CERN.

Johnson believes that his formula for handling the black-hole case could also be applied to other potentially apocalyptic branches of science, such as nanotechnology, genetic engineering and artificial intelligence. Lincoln, however, remains cautious, arguing that the adversarial US legal system is not well suited to assessing scientific cases because it can give unjustified weight to arguments not supported by the science. He also believes that judges or jurors reviewing such cases would have to fully understand the science being reviewed. “I would hate to see the fate of any scientific project rest on a silver tongue instead of a scientific fact,” he adds.

Ellis, too, does not see how a court can avoid the question of whether the science is right, adding that “the job of the court is to get at the truth”. In any case, he believes the case against the LHC has been closed for some time. “Every time someone comes up with a new theoretical speculation about accelerator safety, it is interesting to see why that speculation does not constitute risk, but it always comes back to the cosmic-ray argument,” he says. So does that mean these safety reviews are nothing more than a curiosity? “Correct. There is no scientific motivation for these reviews. They are a foregone conclusion, even though the community has the right to expect CERN to demonstrate the validity of the safety arguments.”

Kent disagrees. He would prefer an experiment to be risk-assessed by independent experts before it is built – rather than by ad hoc panels set up in response to media interest – and to only go ahead if the risk is less than what scientists deem acceptable. But whether this approach is necessary – and indeed practicable – remains an open question.

Inside the complexity labyrinth

Although the world we live in is complex, complexity as a science does not have a long history. For generations, most physicists tried to understand everything in terms of interactions between pairs of idealized “test particles”. Then, about 100 years ago, Henri Poincaré pointed out that a fully interacting three-body system was not just the sum of its three component pairs. The famous “three-body problem” was born.

At the time, few took any notice of this small cloud in the sunny sky of reductionist simplification. Yet even before Poincaré – in fact, before the discovery of atoms – Maxwell and Boltzmann had in some ways anticipated the need for new approaches, following their success in modelling gases as disorganized swarms of elastic molecules. While this method was highly successful for gases, other systems – from galaxies to crystals to flocks of birds – all showed structure emerging from chaos. How, scientists began to wonder, do such diverse constituents “get it together” and organize themselves?

Maxwell himself worried about “demons” that could surreptitiously get to work among gas molecules. If endowed with some capacity for judgement, he reasoned, such demons would be able to make assemblies of molecules behave in very different ways. Talk of demons was anachronistic even in Maxwell’s time, but such new vocabulary often waits on developments in understanding. Until Newton adopted it, “gravity” was a synonym of “solemnity”. Later, other words had to be commandeered to convey precise new meanings – including “field” and, latterly, “inflation”.

One of the most recently rejigged words is “complexity”. In science, this word means a lot more than its dictionary definition, and a number of books have already attempted to define it for the general public. An early (and still popular) one is James Gleick’s magisterial Chaos, published in 1988, which tracks how scientists discovered and tried to make sense of complex effects. But while the anecdotal illustrations and case studies in Gleick’s book are intriguing, most readers emerge breathless with little appreciation of the science of complexity.

In Complexity, A Guided Tour, author and complexity scientist Melanie Mitchell sets out to remedy this. Along the way we meet some of the personalities from Gleick’s book, including Edward Lorenz, who in 1963 showed that initial conditions were the most influential factor in quantitative weather forecasts; and Mitchell Feigenbaum, who discovered new constants of nature relating to the transition from order to chaos. We come across some famous historical physics figures too, including the aforementioned Newton, Maxwell and Boltzmann, and some mathematicians like Hilbert, Gödel and Turing.

Mitchell is a deft guide, and there is plenty of fascinating stuff for readers to discover. In particular, she describes how new developments in genetics – especially evolutionary development biology, or “evo-devo” – indicate that evolution itself is complex. Fresh insights in this field have begun to assign a role to the puzzling “junk DNA” that previously appeared to serve no purpose other than burdening cells. Moreover, evo-devo can make organized structure “evolve” in the dictionary sense of “appear”, without evolution in the Darwinian sense of interplay between infinitesimal mutations and natural selection. This can be a dilemma for evo-devo proponents, who also feel obliged to defend classic Darwinian evolution from attack by creationists.

Yet while we are skilfully guided through the labyrinth of complexity, we only see a part of it. In particular, we are soon steered out of inanimate physics and into artificial intelligence, evolution and genetics. Readers expecting to learn about complex systems in general, and physical ones in particular, will be disappointed. A classic case that is omitted is turbulence, which caused even Wolfgang Pauli to give up and turn to something easier. In 1900, when David Hilbert produced his list of mathematical problems to be solved in the coming century, the Navier–Stokes equations, which describe fluid motion, were one of them. A Guided Tour mentions other challenges on Hilbert’s list, but not this one.

Mitchell sets out to show that science is done by people, but in her account those people are, apparently, mainly based in the US. Moreover, some of the major physics contributors to the science of complexity – for example Lev Landau (who is in Gleick’s book) and Roger Penrose – do not appear, while others like Per Bak, Andrei Kolmogorov and Ilya Prigogine get only passing mentions.

Still, any guide through complexity is welcome: a modern equivalent of Ariadne’s mythical ball of thread, which helped the mighty Theseus to find his way out of the Minotaur’s labyrinth. And, despite my few grumbles, this is an engaging book that deals with some compelling science. Indeed, it is particularly good at displaying how physics ideas are useful in biology (see also Physics World‘s special issue on physics and biology, July 2009). Perhaps it could have been subtitled “A Guided Tour for Biologists”.

Copyright © 2026 by IOP Publishing Ltd and individual contributors