A model approach to climate change

Four photos of weather

It is official: the Earth is getting hotter, and it is down to us. This month scientists from over 60 nations on the Intergovernmental Panel on Climate Change (IPCC) released the first part of their latest report on global warming. In the report the panel concludes that it is very likely that most of the 0.5 °C increase in global temperature over the last 50 years is due to man-made emissions of greenhouse gases. And the science suggests that much greater changes are in store: by 2100 anthropogenic global warming could be comparable to the warming of about 6 °C since the last ice age.

The consequences of global warming could be catastrophic. As the Earth continues to heat up, the frequency of floods and droughts is likely to increase, water supplies and ecosystems will be placed under threat, agricultural practices will have to be changed and millions of people may be displaced as the sea level rises. The global economy could also be severely affected. The recent Stern Review, which was commissioned by the UK government to assess the economic impact of climate change, warns that 5–20% of the world’s gross domestic product could be lost unless large cuts in greenhouse-gas emissions are made soon. But how do we make predictions of climate change, and why should we trust them?

The climate is an enormously complex system, fuelled by solar energy and involving interactions between the atmosphere, land and oceans. Our best hope of understanding how the climate changes over time and how we may be affecting it lies in computer climate models developed over the past 50 years. Climate models are probably the most complex in all of science and have already proved their worth with startling success in simulating the past climate of the Earth. Although very much a multidisciplinary field, climate modelling is rooted in the physics of fluid mechanics and thermodynamics, and physicists worldwide are collaborating to improve these models by better representing physical processes in the climate system.

Not a new idea

Long before fears of climate change arose, scientists were aware that naturally occurring gases in the atmosphere warm the Earth by trapping the infrared radiation that it emits. Indeed, without this natural “greenhouse effect” – which keeps the Earth about 30 °C warmer than it would otherwise be – life may never have evolved. Mathematician and physicist Joseph Fourier was the first to describe the greenhouse effect in the early 19th century, and a few decades later John Tyndall realized that gases like carbon dioxide and water vapour are the principal causes, rather than the more abundant atmospheric constituents such as nitrogen and oxygen.
Carbon dioxide (CO2) gas is released when we burn fossil fuels, and the first person to quantify the effect that CO2 could have in enhancing the greenhouse effect was 19th-century Swedish chemist Svante Arrhenius. He calculated by hand that a doubling of CO2 in the atmosphere would ultimately lead to a 5–6 °C increase in global temperature – a figure remarkably close to current predictions. More detailed calculations in the late 1930s by British engineer Guy Callendar suggested a less dramatic warming of 2 °C, with a greater effect in the polar regions.

Meanwhile, at the turn of the 20th century, Norwegian meteorologist Vilhelm Bjerknes founded the science of weather forecasting. He noted that given detailed initial conditions and the relevant physical laws it should be possible to predict future weather conditions mathematically. Lewis Fry Richardson took up this challenge in the 1920s by using numerical techniques to solve the differential equations for fluid flow. Richardson’s forecasts were highly inaccurate, but his methodology laid the foundations for the first computer models of the atmosphere developed in the 1950s. By the 1970s these models were more accurate than forecasters who relied on weather charts alone, and continued improvements since then mean that today three-day forecasts are as accurate as one-day forecasts were 20 years ago.
But given that weather forecasts are unreliable for more than a few days ahead, how can we hope to predict climate, say, tens or hundreds of years into the future? Part of the answer lies in climate being the average of weather conditions over time. We do not need to predict the exact sequence of weather in order to predict future climate, just as in thermodynamics we do not need to predict the path of every molecule to quantify the average properties of gases.

In the 1960s researchers based at the Geophysical Fluid Dynamics Laboratory in Princeton, US, built on weather-forecasting models to simulate the effect of anthropogenic CO2 emissions on the Earth’s climate. Measurements by Charles Keeling at Mauna Loa, Hawaii, starting in 1957 had shown clear evidence that the concentration of CO2 in the atmosphere was increasing. The Princeton model predicted that doubling the amount of CO2 in the atmosphere would warm the troposphere – the lowest level of the atmosphere – but also cool the much higher stratosphere, while producing the greatest warming towards the poles, in agreement with Callendar’s early calculations.

The nuts and bolts of a climate model

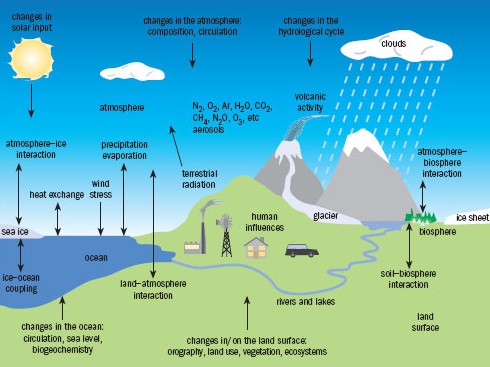
The climate system consists of five elements: the atmosphere; the ocean; the biosphere; the cryosphere (ice and snow) and the geosphere (rock and soil). These components interact on many different scales in both space and time, causing the climate to have a large natural variability; and human influences such as greenhouse-gas emissions add further complexity (figure 1). Predicting the climate at a certain time in the future thus depends on our ability to include as many of the key processes as possible in our climate models.

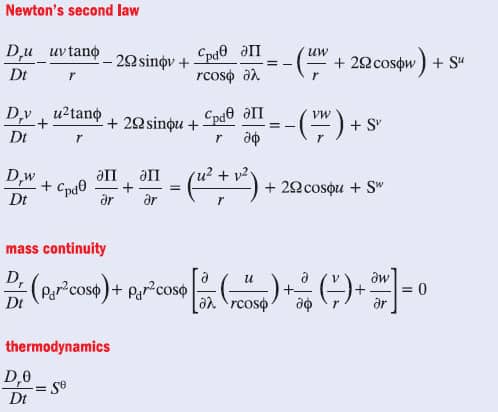
At the heart of climate models and weather forecasts lie the Navier–Stokes equations, a set of differential equations that allows us to model the dynamics of the atmosphere as a continuous, compressible fluid. By transforming the equations into a rotating frame of reference in spherical coordinates (the Earth), we arrive at the basic equations of motion for a “parcel” of air in each of the east– west, north–south and vertical directions. Additional equations describe the thermodynamic properties of the atmosphere (see figure 2).
Unfortunately, there is no known analytical solution to the Navier–Stokes equations; indeed, finding one is among the greatest challenges in mathematics. Instead, the equations are solved numerically on a 3D lattice of grid points that covers the globe. The spacing between these points dictates the resolution of the model, which is currently limited by available computing power to about 200 km in the horizontal direction and 1 km in the vertical, with finer vertical resolution near the Earth’s surface. Much greater vertical than horizontal resolution is needed because most atmospheric and oceanic structures are shallow compared with their width. The Navier–Stokes equations allow climate modellers to calculate the physical parameters – temperature, humidity, wind speed and so on – at each grid point at a single moment based on their values some time earlier. The time interval or “timestep” used must be short enough to give solutions that are accurate and numerically stable; but the shorter the timestep, the more computer time is needed to run the model. Current climate models use timesteps of about 30 min, while the same basic models but with shorter timesteps and higher spatial resolution are used for weather forecasting.

However, some processes that influence our climate occur on smaller spatial or shorter temporal scales than the resolution of these models. For example, clouds can heat the atmosphere by releasing latent heat, and they also interact strongly with infrared and visible radiation. But most clouds are hundreds of times smaller than the typical computer-model resolution. If clouds were modelled incorrectly, climate simulations would be seriously in error.

Climate modellers deal with such sub-resolution processes using a technique called parametrization, whereby small-scale processes are represented by average values over one grid box that have been worked out using observations, theory and case studies from high-resolution models. Examples of cloud parametrization include “convective” schemes that describe the heavy tropical rainfall that dries the atmosphere through condensation and warms it through the release of latent heat; and “cloud” schemes that use the winds, temperatures and humidity calculated by the model to simulate the formation and decay of the clouds and their effect on radiation.

Parametrizing interactions in the climate system is a major part of climate-modelling research. For instance, the main external input into the Earth’s climate is electromagnetic radiation from the Sun, so the way the radiation interacts with the atmosphere, ocean and land surface must be accurately described. Since this radiation is absorbed, emitted and scattered by non-uniform distributions of atmospheric gases such as water vapour, carbon dioxide and ozone, we need to work out the average concentration of different gases in a grid box and combine this with spectroscopic data for each gas. The overall heating rate calculated adds to the “source term” in the thermodynamic equation (see figure 2).

The topography of the Earth’s surface, its frictional properties and its reflectivity also vary on scales smaller than the resolution of the model. These are important because they control the exchange of momentum, heat and moisture between the atmosphere and the Earth’s surface. In order to calculate these exchanges and feed them into source terms in the momentum and thermodynamic equations, climate modellers have to parametrize atmospheric turbulence. Numerous other parametrization schemes are now being included and improved in state-of-the-art models, including sea ice, soil characteristics, atmospheric aerosols and atmospheric chemistry.

In addition to improving parametrizations, perhaps the biggest advance in climate modelling in the past 15 years has been to couple atmospheric models to dynamic models of the ocean. The ocean is crucial for climate because it controls the flux of water vapour and latent heat into the atmosphere, as well as storing large amounts of heat and CO2. In a coupled model, the ocean is fully simulated using the same equations that describe the motion of the atmosphere. This is in contrast to older “slab models” that represented the ocean as simply a stationary block of water that can exchange heat with the atmosphere. These models tended to overestimate how quickly the oceans warm as global temperature increases.

Forcings and feedbacks

The most urgent issue facing climate modellers today is the effect humans are having on the climate system. Parametrizing the interactions between the components of the climate system allows the models to simulate the large natural variability of the climate. But external factors or “radiative forcings” – which also include natural factors like the eruption of volcanoes or variations in solar activity – can have a dramatic effect on the radiation balance of the climate system.

The major anthropogenic forcing is the emission of CO2. The concentration of CO2 in the atmosphere has risen from 280 ppm to 380 ppm since the industrial revolution, and because it lasts for so long in the atmosphere (about a century) CO2 has a long-term effect on our climate.

While earlier models could tell us the eventual “equilibrium” warming due to, say, a doubling in CO2 concentration, they could not predict accurately how the temperature would change as a function of time. However, because coupled ocean–atmosphere models can simulate the slow warming of the oceans, they allow us to predict this “transient climate response”. Crucially, these state-of-the-art models also allow us to input changing emissions over time to predict how the climate will vary as the anthropogenic forcing increases.

Carbon dioxide is not the only anthropogenic forcing. For example, in 1988 Jim Hansen at the Goddard Institute for Space Studies in the US and colleagues used a climate model to demonstrate the importance of other greenhouse gases such as methane, nitrous oxide and chlorofluorocarbons (CFCs), which are also separately implicated in depleting the ozone layer. Furthermore, in the 1980s sulphate aerosol particles in the troposphere produced by sulphur in fossil-fuel emissions were found to scatter visible light back into space and thus significantly cool the climate. This important effect was first included in a climate model in 1995 by one of the authors (JM) and colleagues at the Hadley Centre. Aerosols also have an indirect effect on climate by causing cloud droplets to become smaller and thus increasing the reflectivity and prolonging the lifetime of clouds. The latest models include these indirect effects, as well as those of natural volcanic aerosols, mineral dust particles and non-sulphate aerosols produced by burning fossil-fuels and biomass.

To make matters more complex, the effect of climate forcings can be amplified or reduced by a variety of feedback mechanisms. For example, as the ice sheets melt, the cooling effect they produce by reflecting radiation away from the Earth is reduced – a positive-feedback process known as the ice–albedo effect. Another important feedback process that has been included in models in the past few years involves the absorption and emission of greenhouse gases by the biosphere. In 2000 Peter Cox, then at the Hadley Centre, showed that global warming could lead to the death of vegetation in regions such as the Amazonian rainforests through reduced rainfall; as well as increased respiration from bacteria in the soil. Both will release additional CO2 to the atmosphere, leading, in turn, to further warming.

Improvements in computing power since the 1970s have been crucial in allowing additional processes to be included. Although current models typically contain a million lines of code, we can still simulate years of model time per day, allowing us to run simulations many times over with slightly different values of physical parameters (see for example www.climateprediction.net). This allows us to assess how sensitive the predictions of climate models are to uncertainties in these values. As computing power and model resolution increase still further, we will be able to resolve more processes explicitly, reducing the need for parametrization.

The accuracy of climate models can be assessed in a number of ways. One important test of a climate model is to simulate a stable “current climate” for thousands of years in the absence of forcings. Indeed, models can now produce climates with tiny changes in surface temperature per century but with year-on-year, seasonal and regional changes that mimic those observed. These include jet streams, trade winds, depressions and anticyclones that would be difficult for even the most experienced forecaster to distinguish from real weather, and even major year-on-year variations like the El Niño–Southern Oscillation.

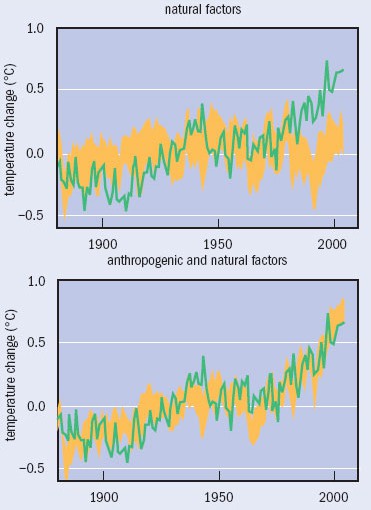
Another crucial test for climate models is that they are able reproduce observed climate change in the past. In the mid-1990s Ben Santer at the Lawrence Livermore National Laboratory in the US and colleagues strengthened the argument that humans are influencing climate by showing that climate models successfully simulate the spatial pattern of 20th-century climate change only if they include anthropogenic effects. More recently, Peter Stott and co-workers at the Hadley Centre showed that this is also true for the temporal evolution of global temperature (see figure 3). Such results demonstrate the power of climate models in allowing us to add or remove forcings one by one to distinguish the effects humans are having on the climate.

Climate models can also be tested against very different climatic conditions further in the past, such as the last ice age about 9000 years ago and the Holocene warm period that followed it. As no instrumental data are available from this time, the models are tested against “proxy” indicators of temperature change, such as tree rings or ice cores. These data are not as reliable as modern-day measurements, but climate models have successfully reproduced phenomena inferred from the data, such as the southward advance of the Sahara desert over the last 9000 years.

Predicting the future

Having made our models and tested them against current and past climate data, what do they tell us about how the climate might change in years to come? First, we need to input a scenario of future emissions of greenhouse gases. Many different scenarios are used, based on estimates of economic and social factors, and this is one of the major sources of uncertainty in climate prediction. But even if greenhouse-gas emissions are substantially reduced, the long atmospheric lifetime of CO2 means that we cannot avoid further climate change due to CO2 already in the atmosphere.

Predictions vary between the different climate models developed worldwide, and due to the precise details of parametrizations within those models. Cloud parametrizations in particular contribute to the uncertainty because clouds can both cool the atmosphere through reflection or warm it by reduced radiative emissions. Such uncertainties led to a best estimate given in the third IPCC report in 2001 of global warming in the range 1.4–5.8 °C by 2100 compared with 1990.

Despite the uncertainties, however, all models show that the Earth will warm in the next century, with a consistent geographical pattern (figure 4). For example, positive feedback from the ice–albedo effect produces greater warming near the poles, particularly in the Arctic. Oceans, on the other hand, will warm more slowly than the land due to their large thermal inertia. Average rainfall is expected to increase because warmer air can hold a greater amount of water before becoming saturated. However, this extra capacity for atmospheric moisture will also allow more evaporation, drying of the soil and soaring temperatures in continental areas in summer.

Sea levels are predicted to rise by about 40 cm (with considerable uncertainty) by 2100 due largely to thermal expansion of the oceans and melting of land ice. This may seem like a small rise, but much of the human population live in coastal zones where they are particularly at risk from enhanced storm flooding – in Bangladesh, for example, many millions of people could be displaced. In the longer term, there are serious concerns over melting of the Greenland and West Antarctic ice sheets that could lead to much greater increases in sea level.

We still urgently need to improve the modelling and observation of many processes to refine climate predictions, especially on seasonal and regional scales. For example, hurricanes and typhoons are still not represented in many models and other phenomena such as the Gulf Stream are poorly understood due to lack of observations. We are therefore not confident of how hurricanes and other storms may change as a result of global warming, if at all, or how close we might be to a major slowing of the Gulf Stream.

Though they will be further refined, there are many reasons to trust the predictions of current climate models. Above all, they are based on established laws of physics and embody our best knowledge about the interactions and feedback mechanisms in the climate system. Over a period of a few days, models can forecast the weather skilfully; they also do a remarkable job of reproducing the current worldwide climate as well as the global mean temperature over the last century. They also simulate the dramatically different climates of the last ice age and the Holocene warm period, which were the result of forcings comparable in size to the anthropogenic forcing expected by the end of the 21st century.

Although there may be a few positive aspects to global warming – for instance high-latitude regions may experience extended growing seasons and new shipping routes are likely to be opened up in the Arctic as sea ice retreats – the great majority of impacts are likely to be negative. Hotter conditions are likely to stress many tropical forests and crops; while outside the tropics, events like the 2003 heatwave that led to the deaths of tens of thousands of Europeans are likely to be commonplace by 2050. This year is already predicted to be the hottest on record.

We are at a critical point in history where not only are we having a discernible effect on the Earth’s climate, but we are also developing the capability to predict this effect. Climate prediction is one of the largest international programmes of scientific research ever undertaken and it led to the 1997 Kyoto Protocol set up by the United Nations to address greenhouse-gas emissions. Although the protocol has so far led to few changes in atmospheric greenhouse-gas concentrations, the landmark agreement paves the way for further emissions cuts. Better modelling of natural seasonal and regional climate variations are still needed to improve our estimates of the impacts of anthropogenic climate change. But we are already faced with a clear challenge: to use existing climate predictions wisely and develop responsible mitigation and adaptation policies to protect ourselves and the rest of the biosphere.

At a glance: Climate modelling

  • The scientific consensus is that the observed warming of the Earth during the past half-century is mostly due to human emissions of greenhouse gases
  • Predicting climate change depends on sophisticated computer models developed over the past 50 years
  • Climate models are based on the Navier–Stokes equations for fluid flow, which are solved numerically on a grid covering the globe
  • These models have been very successful in simulating the past climate, giving researchers confidence in their predictions
  • The most likely value for the global temperature increase by 2100 is in the range 1.4–5.8 °C, which could have catastrophic consequences

More about: Climate modelling

www.metoffice.gov.uk/research/hadleycentre
www.ipcc.ch
www.climateprediction.net
J T Houghton 2005 Climate Change: The Complete Briefing (Cambridge University Press)
K McGuffie and A Henderson-Sellers 2004 A Climate Modelling Primer (Wiley, New York)

Blog life: Cosmic Variance

Bloggers: Sean Carroll, JoAnne Hewett, Mark Trodden and Risa Wechsler
URL: cosmicvariance.com
First post: July 2005

Who is the blog written by?

Cosmic Variance is the group project of four theorists working in particle physics and cosmology. Sean Carroll is at Caltech, JoAnne Hewett and Risa Wechsler are at the Stanford Linear Accelerator Center, while Mark Trodden is the token non-Californian, based at Syracuse University, New York. A fifth blogger, University of Southern California string theorist Clifford Johnson, left Cosmic Variance late last year to set up his own blog, Asymptotia.

What topics does it cover?

In its first post, Carroll described Cosmic Variance as “a group blog constructed by some idiosyncratic human beings who also happen to be physicists”. So as well as reflecting the professional interests of the authors – and their surprisingly jet-setting lifestyle – there are posts on everything from religion to poker. There is also plenty of US politics, and campaigning posts about the position of women and minorities in physics. And, as usual in the “blogosphere”, a good chunk of space is given over to mentions of other blogs.

Who is it aimed at?

The level of physics knowledge assumed can vary quite a lot from post to post. In recent months, Carroll has provided an intelligible introduction for non-physicists to the Bullet Cluster results on dark matter (see p26, print version only), and Hewett a guide to the basics of particle detection. But some readers will be left behind by reports on conferences and the authors’ research, such as Trodden’s mention of “the challenges of constructing a consistent infrared modification of gravity yielding late-time cosmic acceleration”.

Can you give me a sample quote?

“Some people seem to think that the ability to do math is the quintessential expression of ‘intelligence’, from which all other reasoning skills flow,” says Carroll. “If that were true, scientists and mathematicians would make the best poets, statesmen, artists and conversationalists. And faculty meetings at top-ranked physics departments would be paradigms of reasonable discussion undistorted by petty jealousies and irrational commitments. Suffice it to say, the evidence is running strongly against. (It’s true that physicists are incredibly fashionable and make the best lovers, but that’s a different matter.)”

How often is it updated?

At least every couple of days, though the brunt of the work is carried by Carroll, who has posted more times than his other three collaborators combined. Still, he can’t complain too much – through the blog he met fellow physics blogger Jennifer Ouellette of Cocktail Party Physics, to whom he is now engaged to be married.

Why should I read it?

Cosmic Variance is undoubtedly the most popular blog written by physicists, and as such it is something of a hub for the physics blogosphere. Each post attracts a host of comments from physicists and non-physicists alike, leading to some lively debates.

Hot topic

Unseasonably warm weather in many parts of Europe and North America last month will probably have added to the impression in many people’s minds that climate change is a reality and that humans are guilty of warming our planet. The several hundred members of the United Nations’ Intergovernmental Panel on Climate Change (IPCC) certainly think that the evidence for anthropogenic climate change is solid. Although Physics World was unable to obtain a copy of the IPCC’s latest report on the science of climate change before its release date of 2 February – a clear sign of how sensitive its findings are – hints from those involved in writing the report suggest that the IPCC will have strengthened its conclusions, previously stated in 2001, that humans are heating up the Earth.

While most scientists probably share this view, there are some who think otherwise. Many of those are either scientifically ill-informed or have dubious links with the energy industry. But some have genuine doubts. One bona fide sceptic is Richard Lindzen, a climate physicist from the Massachusetts Institute of Technology in the US, who was involved in preparing the IPCC’s 2001 scientific report. While he does not dispute that the Earth is getting hotter, Lindzen thinks that, in all probability, the warming is largely the result of natural variations in the Earth’s climate (see “A climate of alarm”).

Lindzen believes that climate models, although rooted in physics, contain far too many uncertainties to provide accurate forecasts. Indeed, mainstream climate physicists admit their computer models are far from perfect. Writing in their feature, for example, the chief scientist of the UK’s Meteorological Office and colleagues describe how hard it is to incorporate the impact of clouds, which are much smaller than the resolution of the best models. They also warn that if clouds were modelled incorrectly, climate simulations “would be seriously in error”.

Nevertheless, the balance of evidence does suggest that carbon dioxide being pumped into the atmosphere is having a significant warming effect. It is therefore right and prudent to limit greenhouse-gas emissions as a way of dealing with the causes of climate change. There is even a small band of researchers proposing various outlandish schemes to deal with the effects of climate change – an approach known as “geoengineering” (see p10; print version only). Nobel-prize-winning chemist Paul Crutzen, for example, has suggested pumping vast quantities of sulphur into the atmosphere to act as a huge Sun block, while others are considering sending solar reflectors into space or even painting roads white. These ideas are hugely expensive and possibly unfeasible, and it is to be hoped that we will never have to put them into action.

One may ask if this magazine should give space to Lindzen or those involved in geoengineering to air their views. Given the uncertainties still present within climate models and the potential costs of dealing with global warming, it would be wrong for Physics World to ignore those outside the mainstream. After all, as Richard Feynman once wrote: “There is no harm in doubt and scepticism, for it is through these that new discoveries are made.” Physicists should never take anything at face value, not least a topic as important as climate change.

Once a physicist: Randall Munroe


What first sparked your interest in physics?

As a kid, my dad would do activities with me that taught me a lot about how things work – measuring how fast you can run by timing yourself over a measured distance, siphoning water up over the side of a fish tank, taking apart pieces of electronics and learning to use the capacitors inside to shock your siblings. I ate it all up. Later, after some unhappy science classes full of animal taxonomies and beakers of goo, I found a physics book and started flipping through it. Light, gyroscopes, waves, forces, levers – it was all the cool stuff from the games when I was a kid. So there was a definite moment when I realized that so much of what is interesting about the world fits under one label – physics.

Where did you study physics and how much did you enjoy it?

I was one of only four physics majors in a graduating class of about 1000 at Christopher Newport University in Virginia. I enjoyed it quite a bit, although I had trouble focusing on a particular area and so ended up with minors in both maths and computer science. Towards the end of the course a professor told me I needed to specialize – I couldn’t have all the candy in the store. The implication was that there weren’t really any jobs that let you flit from one subject to another, making a few contributions here or a smart-alec observation there. At the time, I reckoned he was right. I did my final year thesis on robotics at NASA’s nearby Langley Research Center, and during my last semester that developed into a full-time contract position. I continued to work there through graduation and most of the summer.

When did you start drawing comics?

At school I’d fill notebooks with diagrams, fractals, equations, creepy tables showing the hypothetical dating compatibility of every pair of people in the classroom, that sort of thing. When I was going back through them and scanning pages I started thinking about self-contained drawings that made a point, which led me to putting boxes around sketches and calling them comics. But it really goes back to early elementary school, where I drew literally hundreds of elaborate stick-figure battle murals, with the good guys laying traps and using crazy weapons, and the bad guys trying to storm through them.


Where do you get the ideas for your comic?

Every cartoonist gets this question, and the answers sound pretty trite: “I just think about stuff for a while, and then I’ll have an idea (usually while I’m in the shower) and write it down.” But to some extent that’s really how it works for me. Some of it is observational – you take the things that make you giggle in real life and sharpen them to a point. But the rest I really don’t understand. I’d like to spend some time studying how humour is generated. A rule of thumb is that if we can’t program a computer to do something, we don’t really understand how humans do it. And if there’s one thing we can’t do algorithmically yet, it’s make humans laugh.

How did xkcd.com develop into something that you could do full time?

The readership grew pretty steadily through word of mouth, and eventually one of my NASA contracts expired just as I started selling a lot of T-shirts based on comics from the website. So I decided not to seek another contract and suddenly I was a “professional cartoonist” – one of the weirder turns my life has taken.

How does your physics education help you in creating and running xkcd.com?

I think it helps in much the same way that it helps someone in any physics-related job. It’s a bag of tools – ways to think about situations – that supplies perspective. In my case, I use that perspective to look for funny stuff. There are a lot of people out there with a similar mindset, and it is fun to see my ideas connect with them. And from a more pragmatic standpoint, scientists tend to be big on precision and accuracy. I always know that if I leave out a minus sign in an equation or something, I’ll get a lot of e-mails. So I had better be sure I know what I’m talking about.

Physics legends II

In my column in November 2006 (see “Physics Legends”), I discussed stories from the history of science that we repeat even when we suspect that they are wrong. I then asked for your favourites and for ideas why such legends persist. Dozens of readers replied, mentioning legends involving oversimplifications or falsifications of science, of history or of the world. Some of you even protested that stories that I had claimed were true are in fact false, and vice versa.

The apple, the sink and the pendulum

Robert Matthews – a science writer and visiting reader in science at Aston University in the UK – found me too credulous regarding Newton’s apple. Yes, he granted, historians have traced the tale back to Newton himself, but that does not make it true. Why, he asked sensibly, was Newton – a notoriously secretive and paranoid person – suddenly so chatty about how he got an idea, unless to cement priority over his rival Hooke?

Several readers took up my discussion of whether the Coriolis effect really makes bath water swirl down the drain in opposite directions in different hemispheres. Chris Coffman, an investment banker from Australia whose father is a nuclear physicist, said he actually saw a demonstration of the Coriolis effect in a washbasin at the Equatorial Monument outside Quito in Peru.

When the sink was placed 1 m north of the line marking the equator, the water swirled down the drain in one direction and in the opposite direction when 1 m south. When the sink was placed directly over the line, the water “sputtered out” without swirling. “The effect was extraordinarily dramatic,” wrote Coffman, “like switching poles on a magnet, not gradual as one might assume.” Other readers had also seen the demonstration but commented that it collided with their physical intuitions; one reported that a hand-held GPS showed the equator line to be wrong by a hundred metres or so.

I asked my colleague Cliff Swartz – an expert in establishing relative magnitudes – if you can really see the Coriolis effect in a sink. “My son once asked me that,” Swartz replied, “and I told him to go see for himself.” The outcome? “He said it depended on which faucet you turn on first, which I think is right.” This inspired me to look for myself. The water in my kitchen sink almost always swirled away anticlockwise, while that in my bathroom sink always swirled clockwise. In his book Back-of-the-Envelope Physics, Swartz computes the Coriolis acceleration to be smaller than the gravitational acceleration by a factor of 105, and he showed me a precision measurement by researchers at the Massachusetts Institute of Technology (Nature 196 1080). The effect is strong enough to shape hurricanes, Swartz said, but not water in a basin, which is overwhelmed by other forces. Which makes me wonder: what is happening in that sink in Quito?

Several respondents mentioned Galileo’s discovery of the isochrony of pendulums from the swing of a chandelier, saying that the story is surely false because the famous chandelier hanging in Pisa’s Duomo dates from 1587, years after Galileo’s work. This argument does not impress me. The “new” chandelier replaced an earlier one, which may well have inspired Galileo and, of course, obeyed the same laws of physics.

Buoyancy, bees and Brownian motion

Archimedes’ “Eureka!” story sparked much interest. Paul Millington, a teacher in Birmingham, UK, gets younger students to re-enact the famous bath-time tale with puppets. Other respondents, however, cautioned that this episode is frequently mistaught as being about the discovery of density rather than of the principle of buoyancy. Archimedes, they say, did not have to discover that a body placed in water displaces its own volume. Rather his delight came from the realization that such a body is lighter, relating to the weight of the displaced water; in other words, if he weighed a crown in air and water he could obtain the object’s density.

Some respondents mentioned jests that became legends when taken too seriously. Ken Zetie, head of physics at St Paul’s School in London, offered an example: the tale that scientists used the laws of aerodynamics to prove that bumble-bees cannot fly. My colleague Elof Carlson mentioned another: that so-called preformationists believed that tiny figures existed inside sperm.

Matthews also pointed out that the microscopic observations of “Brownian motion” by Robert Brown did not have anything to do with battered pollen grains, as is often claimed, but with particles inside the pollen. Meanwhile, Malcolm Hayes from the University of Southern Maine says he likes to ask people who repeat the familiar story that glass flows to explain why no aberration has been seen on the 200 inch glass mirror on Mount Palomar’s telescope.

The critical point

While legends are educationally useful, they are a trade-off between the value of illustrating scientific principles on the one hand and the value of historical accuracy on the other. Legends may also, I think, illustrate aspects of science that are not included in traditional accounts of its methodology, help clarify the meaning of a principle, and have social value. For scientists, like other people, enjoy telling and hearing good stories.

But legends have dangers too: those that oversimplify science can make us feel smugly superior to supposedly solid science and make us think that the world works differently from the way science says. As Zetie notes, “they allow us to think ‘science proved bees can’t fly so I’ll happily ignore warnings about global warming'”. Legends that oversimplify science history can lead to illegitimate charges of fraud. Brown, for instance, has been accused of fraud by some who pointed out that he could not have seen what he is (incorrectly) said to have seen – that atomic motions move pollen. And legends that oversimplify the world, such as that the Coriolis effect is seen in sinks, are potentially harmful by encouraging a distrust of science teaching and science itself.

Sensing a challenge

While studying for my undergraduate degree at the University of Nottingham in the UK, I developed a strong interest in condensed matter physics. This led me to undertake a PhD in semiconductor physics and then, almost before I knew it, I was starting my final year and contemplating what to do next. Although the PhD was a great experience, after many years following an academic path I felt it was time for a change. I started looking for industrial jobs with a focus on engineering and physics, and quickly discovered e2v – a leading design firm of electronic components and subsystems. I applied for the company’s annual graduate scheme in 2005 and was delighted to be offered a job working with charge-coupled devices (CCDs).

e2v manufactures electronic tubes, sensors and semiconductors for the medical, scientific, aerospace, defence, industrial and commercial sectors. The company employs about 1800 people across three manufacturing sites in the UK (Chelmsford, Lincoln and High Wycombe) and a fourth in Grenoble, which was recently acquired from a French electronics company. Although the name e2v is only a few years old, the firm was started 60 years ago as the English Electric Valve Company.

Sensors in space

CCDs are arrays of capacitors made from semiconductor materials that are used in a variety of digital-imaging applications, from mobile-phone cameras to telescopes. The CCDs designed and manufactured by e2v have historically been closely associated with the space industry. For example, its CCDs have been chosen by NASA and the European Space Agency for major research missions including the Hubble Space Telescope and the Mars Reconnaissance Orbiter. For such missions e2v has developed sensors not just for imaging but also for spectroscopy and guidance systems.

In addition to space projects, e2v makes CCDs for several other market sectors. In medical imaging, for example, its sensors are used in X-ray and biopsy analysis. Scientific applications include spectroscopy, microscopy, fluoroscopy and crystallography. And its patented “L3Vision” system allows CCDs to be used in very low light conditions, leading to industrial applications such as night-time surveillance cameras.

Since starting at e2v, I have mainly worked as a device development engineer. Initially, this involved some simple testing and experimental work, but I soon began a project in which I modelled the circuits that are used in CCDs to detect electric charge. Recently, I have taken on some investigative projects associated with the wafer fabrication process of the CCDs. My aim here is to improve the manufacturing yield and ensure that the firm will be able to cope with the next generation of device designs. In addition, I have started a secondment in e2v’s product-engineering group. Product engineers are responsible for testing and evaluating devices, and ensuring that the product is delivered to customers on time. This role requires a good understanding of the devices, as the engineer must interpret test data, solve problems and respond to customer queries.

Solving problems

My work at e2v has been varied and interesting, with a mix of hands-on practical experience together with analytical and investigative research. From a technical perspective, there is always something new to learn about the devices, be it in the operation, application or manufacture. There are certainly similarities between the experimental work I undertook during my PhD and the practical problem solving that is involved in the job of an engineer at e2v. In both cases, the challenge is to get a result from your equipment in the best possible way. Other skills that I developed at university, such as the ability to communicate clearly and write concise reports, have also proved invaluable in the work place.

I have found the main difference between industry and academia to be the level of support available to me. As a PhD student you often struggle to find resources and so have to be creative in finding solutions to your problems. In contrast, in industry, the commercial pressure of satisfying the customer means the support available is much greater. The implementation of milestones and targets at the company also makes the pace of the work faster than while doing a PhD.

Most new starters working on CCDs are physics graduates who join the product-engineering group. There is a healthy balance of people with undergraduate and postgraduate qualifications from a wide variety of universities. In this role, new starters can make use of their physics degree while they get up to speed with the CCD aspects of the business and learn the importance of their work to the customer.

Physicists who have started in the product-engineering group have moved on to a wide range of roles. Some have stayed within the group to become senior engineers who are experts in their chosen technology. Others have moved into applications engineering, where they work closely with the customer to bid for contracts for new business. Alternatively, some engineers have progressed to managerial roles such as team leader or project manager, with a host of new challenges and responsibilities. Whichever path you choose to follow, in a company such as e2v with a broad product portfolio and a vision to expand, the prospects are bright.

Stringing physics along

“Hypotheses non fingo,” wrote Isaac Newton 300 years ago in the second edition of his Principia Mathematica. It has been variously translated as “I do not make hypotheses” or “I do not feign hypotheses”. Instead, Newton established laws of nature such as his theory of universal gravitation – simple, economical equations of broad explanatory power able to account for diverse phenomena both known and yet to be observed. His natural philosophy became the dominant paradigm of the mechanical world-view and, more generally, what we call the scientific method.

In the last few decades, however, physical theory has drifted away from the professional norms advocated by Newton and other enlightenment philosophers. A vast outpouring of hypotheses has occurred under the umbrella of what is widely called string theory. But string theory is not really a “theory” at all – at least not in the strict sense that scientists generally use the term. It is instead a dense, weedy thicket of hypotheses and conjectures badly in need of pruning.

That pruning, however, can come only from observation and experiment, to which string theory (a phrase I will grudgingly continue using) is largely inaccessible. String theory was invented in the 1970s in the wake of the Standard Model of particle physics. Encouraged by the success of gauge theories of the strong, weak and electromagnetic forces, theorists tried to extend similar ideas to energy and distance scales that are orders of magnitude beyond what can be readily observed or measured. The normal, healthy intercourse between theory and experiment – which had led to the Standard Model – has broken down, and fundamental physics now finds itself in a state of crisis.

Lee Smolin, a theorist at the Perimeter Institute, Waterloo, Canada, has written a thoughtful, provocative book that squarely addresses these problems and advocates a solution in bold new approaches to physics. A principal aim of The Trouble with Physics is to re-engage theory with what actually occurs, or may occur, in the realm of observable phenomena. The book also addresses such core questions as: Why do quarks, leptons and gauge bosons have the diverse masses they possess? What are dark matter and dark energy? How can quantum mechanics and general relativity be combined into a single theory?

String theory originally shared most of these goals, but it got caught up in its own mathematical beauty. Like Narcissus, it increasingly began to contemplate its own reflection, to the exclusion of observable phenomena. To evade comparisons with dross reality, for instance, string theorists have invoked an unseen “metaverse” of parallel universes corresponding to the “landscape” of 10500 possible solutions that might exist. The fact that our universe has spawned galaxies, stars, planets and intelligent life is explained away by the anthropic principle. Of late, a few leading theorists have even begun to suggest a radical new philosophy of science, rejecting Newton, in which hypotheses no longer require observable evidence in order to be accepted as valid theories. To a hardened experimenter like me, this is blasphemy.

So it is refreshing to hear from a theorist – one who was deeply involved with string theory and championed it in his previous book, Three Roads to Quantum Gravity – that all is not well in this closeted realm. Smolin argues from the outset that viable hypotheses must lead to observable consequences by which they can be tested and judged. That is, they have to be falsifiable. Newton’s theory of gravitation, for example, could later account for the orbit of Halley’s Comet – not just those of the Moon and planets for which it was originally formulated. But string theory by its very nature does not allow for such probing, according to Smolin, and therefore it must be considered as an unprovable conjecture.

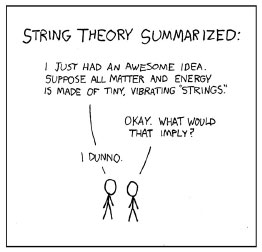
Pencil drawn comic

A worrisome problem is that the general public that follows modern physics does not understand these distinctions and regards string theory as valid science – especially because it gets such broad play in the major media. Recently the US science television programme Nova featured a three-part series on string theory, The Elegant Universe, based on the best-selling book by Brian Greene. Three hours of prime-time television on what is only a hypothesis! And in response to criticism from Smolin and others, Greene recently defended string theory in a prominent essay in the opinion pages of the New York Times.

If we accept string theory as valid while it evades observational tests, how can we legitimately rebut arguments about the “intelligent design” of the universe? The honest answer is that we cannot. For these arguments, too, are not falsifiable; they do not allow testing by measurements. To me, string theory and intelligent design belong in the same speculative, unproveable category, and Smolin apparently agrees. “The scenario of many unobserved universes plays the same logical role as the scenario of an intelligent designer,” he argues. “Each provides an untestable hypothesis that, if true, makes something improbable seem quite probable.”

Towards the end of his book, Smolin suggests other directions fundamental physics can take, particularly in the realm of quantum gravity, to resolve its crisis and reconnect with the observable world. From my perspective, he leans a bit too heavily towards highly speculative ideas such as doubly special relativity, modified Newtonian dynamics and loop quantum gravity. But at least these ideas lead to firm, testable predictions by which they can be judged and – if found lacking – rejected. This is science.

As Smolin recognizes in his concluding chapters, physicists are involved in a struggle for the very definition of what it means to do physics. Is it merely the practice of the men and women who call themselves physicists at any given time? Or are there lasting professional ethics, such as the use of rational argument based on observable evidence accessible to any practitioner? To his credit, Smolin argues forcefully in favour of the latter option. The Trouble with Physics deserves a wide, careful reading by all physicists concerned about the future of our discipline.

Maxwell’s demon tamed

Nature uses molecular machines to drive chemical systems away from thermodynamic equilibrium in virtually every major biological process. But while scientists have been eager to create similar machines to perform nanoscale tasks, they have so far only had success with simple switches that proceed towards equilibrium.

David Leigh and fellow researchers at the University of Edinburgh, however, have proved that particles can be driven away from equilibrium using a molecular “information ratchet”. To perform the feat, they use “rotaxane”, an assembly of molecules comprising a dumbbell-shaped axle on which a ring can slide, hindered only by a gate located part way along. By shining light on rotaxane, the ring absorbs photons and transfers energy to the gate, which then temporarily changes shape to let the ring pass. Once the ring has passed, however, it cannot transmit energy back to the gate, and is therefore stuck – or ratcheted – in place.

A comparable ratcheting process was famously conjured 140 years ago by James Clerk Maxwell in a thought experiment that was later nicknamed “Maxwell’s demon”. Maxwell supposed that some kind of entity (a “demon”) could be invented to act as a gatekeeper between two isolated chambers of gas, letting only fast molecules into one chamber and only slow molecules into the other. In doing so, he proposed, the difference in temperature between the two chambers would progressively increase, thus violating the second law of thermodynamics.

The flaw in Maxwell’s thinking, however, was that the demon itself would expend energy when controlling the gate. In the Edinburgh team’s system, the demon’s appetite is satisfied by light energy, and hence the second law remains undisputed. According to Leigh, the two gas chambers are analogous to the opposing sides of the rotaxane molecule, and the demon – perhaps less tangibly – is analogous to a double bond within the gate that receives energy from the ring.

Nevertheless, the researchers have still proved it is possible to force an ensemble of rotaxane particles away from equilibrium, which Leigh says could result in molecular machines that are as functional as the ones seen in biology. For example, ions could be attached to the rings and pumped against a concentration gradient. “Because we understand exactly how this molecule behaves from a chemical standpoint, it allows us to appreciate exactly why the information ratchet requires an input of energy to work,” he said.

Ultrafast probe uses femtosecond electron pulses

Electron beams are easily focused and have wavelengths much shorter than visible light – making them a powerful tool for studying matter down to atomic length scales. However, electrons are charged particles and their mutual repulsion means that they avoid bunching together in very short pulses.

In the past few years, physicists have tried to create very short electron pulses by irradiating metal surfaces with powerful femtosecond laser pulses. However, each laser pulse creates a pulse containing a large number of electrons, which broaden to a few hundred femtoseconds’ duration thanks to mutual repulsion. While physicists have tried to limit the number of electrons in a pulse by focusing the laser onto a very fine metal tip, they have so far struggled to understand and ultimately control the emission process.

Now, Christoph Lienau and colleagues Max Born Institute for Nonlinear Optics and Short Pulse Spectroscopy (MBI) in Berlin have found a way to avoid repulsive broadening by designing a tip that emits about one electron per pulse. In their source they use a 80 MHz Ti:sapphire laser to irradiate the tip of an extremely fine gold needle with light pulses that are 7 femtoseconds long, producing electron pulses less than 20 femtoseconds’ duration.

The tip is extremely sharp – it has a curvature radius of less than 20 nm – which means that the intensity of electromagnetic field associated with the laser pulse is enhanced by about a factor of ten. As a result, the electron pulses leave the tip without the need for large bias voltages. This is an important breakthrough because high bias voltages had previously prevented such tips from being used in imaging systems. Bias-free operation also makes the electrons a very sensitive probe of matter.

Although the needle emits about one electron per pulse, Lienau told Physics Web that the high pulse rate of the laser ensures that there are enough electrons to perform electron-diffraction experiments.

The researchers also demonstrated the practicality of their technique by creating a tip-enhanced electron emission microscope (TEEM) based on a tungsten (rather than gold) tip that is illuminated by the same laser pulses. The TEEM was able to image a 100 nm-wide groove in a metallic surface with a spatial resolution of tens of nanometres.

Computer chips cut energy consumption

Computer chips are one of the fastest developing technologies, currently packing up to 2,000 transistors across the width of a human hair and switching them on and off 300 billion times a second. But in past years the industry has been facing a growing problem of energy loss through current “leakage”, prompting researchers to develop chips that consume far less.

Now two leading chip manufacturers, Intel and IBM, have announced independently breakthrough materials based on the element hafnium that can dramatically reduce the amount of energy loss. While IBM has not yet disclosed details their material, Intel say that the material will be integral to the 45-nanometre transistors in their forthcoming range of processors.

As the demand for fast clock speeds has increased, the electrodes in computer chips have been forced to steadily reduce in size. Unfortunately this has allowed for the prevalence of quantum effects, whereby electrons tunnel through insulating barriers and cause current to leak. To combat this, manufacturers have been using dielectrics – materials that tend to concentrate electric fields within themselves – as the insulating layers, which can be made thick enough to combat tunnelling while maintaining the fast clock speeds.

Intel’s new alloy of hafnium has a higher dielectric constant (the measure of a material’s dielectric ability) than silicon dioxide, which is currently the industry’s standard insulator, and can reduce current leakage more than five times over. However, a more reassuring consequence for some will be the ensured continuation of “Moore’s law”, a long-established axiom predicting that, on average, transistor counts double every two years.

Copyright © 2026 by IOP Publishing Ltd and individual contributors