
Ultrathin implantable microLED array illuminates the brain

Flexible microLED array

Optogenetics – the use of light to manipulate neurons in the brain – could help scientists better understand the mechanisms underlying brain function, and how neural activity and brain disorders are linked. To fully exploit the potential of this technique, however, requires a way to optically stimulate specific regions throughout the entire brain.

With this aim, a research team headed up in Japan has developed a flexible microLED array film that can adhere to the brain surface and illuminate individual or multiple brain regions for optogenetic stimulation. The researchers describe the device in Applied Physics Express.

To create the bioimplantable stimulation device, first author Hiroto Sekiguchi from Toyohashi University of Technology developed a way to precisely pattern a layer of microLEDs on an ultrathin flexible film. Sekiguchi and colleagues selected the biocompatible polymer parylene C as the base film, due to its robustness and flexibility. Their first task was to determine the optimal film thickness to balance bendability against fragility. Wrapping experiments investigating the effect of the radius of curvature on film adhesion revealed that a parylene thickness of 11 µm provided sufficient adhesion and robustness.

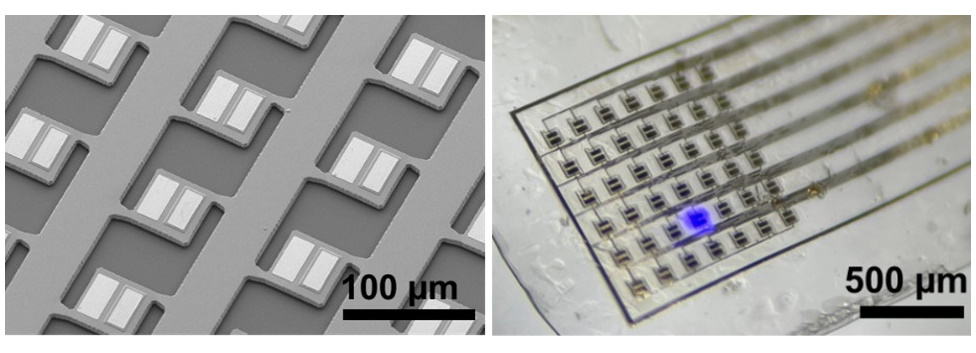
Next, the researchers established a method for fabricating a high-density, hollow-structured array of indium gallium nitride (InGaN)-based microLEDs. They arranged the 80 x 80 µm microLEDs, which emit 450 nm light, in a 7 × 6 array on a 1 mm square. The hollow structure separates the LED layer from its substrate, enabling the use of a thermal release sheet to transfer a layer of microLEDs onto a parylene film, without rotation or misalignment.

MicroLED fabrication

The film-mounted microLEDs generated bright blue emission, which was maintained even when the film was bent. Comparisons of the current–voltage characteristics before and after the transfer process showed that the process had not affected the microLED performance.

Optogenetic investigations require light output values in the range 0.1–1 mW/mm2  to activate channelrhodopsin-2 (ChR2, the first widely adopted optogenetics tool). The researchers note that driving a single microLED at 0.5 mA generated blue light with an output of 22 mW/mm2.

To determine the safety of the optical stimulation with regard to tissue heating, the researchers calculated the temperature increase for a light output of roughly 10 mW/mm2. They observed an increase of 1.6 °C in air – less than the maximum value specified in guidelines for embedded devices (2 °C), suggesting that the device would be safe to use in vivo.

Finally, to test the functionality of the flexible microLED array film, the team placed a film on the surface of the cerebral cortex in an anaesthetized mouse. The 11 μm thick film adhered well to the surface of the brain. Simultaneously driving three microLEDs generated three bright blue emission spots.

Examining the extent of light penetration into the animal’s brain, using electroluminescence measurements and Monte Carlo simulations, revealed that the brain region 100–250 μm away from the surface could be stimulated with 10 mW/cm2 of blue light. This indicates that the flexible microLED film should be effective for optogenetic stimulation.

Sekiguchi tells Physics World that the team now plans to develop technology for integrating microLEDs and neural electrodes, which can measure brain waves via electroencephalography. “Also, we think that the next challenge is to integrate microLEDs with different emission colours,” he adds.

“The development of flexible microLED films can significantly contribute to the field of neuroscience research, particularly optogenetic research for the purpose of functional dissection of sub-regions on the brain surface,” the researchers conclude.

Why quantum sensors are the ‘stepchild’ of quantum technologies

If you want to look savvy and intelligent during a discussion about commercializing quantum technologies, here’s a tip: mention quantum sensors.

This advice isn’t as pithy as “plastics” or “wear sunscreen”. Even so, if you follow it, chances are you’ll be greeted with sage nods and murmurs of agreement. Devices that use quantum effects to sense magnetic fields, gravity and other physical phenomena are far easier to build than fault-tolerant quantum computers or large-scale quantum networks. It stands to reason that they should be easier to turn into commercial products. After all, a noisy qubit is just a good quantum sensor in disguise, and prototype sensors are already proving their usefulness in field trials. What could possibly stand in their way?

Plenty, says Henning Soller, a partner at the consulting firm McKinsey & Company and the leader of the firm’s Technology Institute. “It [quantum sensing] is always a bit of the stepchild,” he told an audience at last week’s Quantum Business Europe conference. In Soller’s view, there are several reasons for this. First, the market for quantum sensors is still nascent. Whereas quantum computing attracts multibillion-dollar investments from major corporations like Google, Honeywell and Microsoft, and spawns new start-ups practically every week, quantum sensing firms are relatively small and few in number.

Second, the possible applications for quantum sensing are incredibly varied. In another session at the same conference, Gabriel Puebla-Hellmann, chief executive officer of the quantum sensing firm QZabre, gave audience members a whistle-stop tour of industries where quantum sensors could have a transformative effect. Puebla-Hellmann’s examples included semiconductor manufacturing, where quantum sensors could bring fresh capabilities to failure analysis and quality control by monitoring the flow of current through nanoscale devices. Another possibility is geophysics, where devices that use free-falling atoms to measure the local acceleration due to gravity could be used to detect subsurface voids, aquifers or buried infrastructure. A further example is the life sciences, where quantum sensors based on nitrogen vacancy centres in diamond could bring magnetometry, thermometry and nuclear magnetic resonance (NMR) imaging capabilities down to the cellular scale.

Bug or feature?

For scientists, this huge variety is exciting. For investors and entrepreneurs, though, Soller argues that it’s a problem, since it makes it harder to identify which applications have the greatest commercial potential. That’s important because McKinsey estimates that the entire quantum sensing market, in all its glorious diversity, is only 1/5 of the size of the market for quantum computing – meaning that each possible application represents a slender slice of an already smaller pie.

A further challenge Soller mentioned in his talk is that some quantum sensing applications have very good classical competitors. As an example, he cited the use of gravity sensors for geolocation. Some experts have touted such sensors as a possible antenna-free, jamming-resistant replacement for GPS technologies, especially in autonomous vehicles. But with GPS so ubiquitous, and gravity sensors so new, it’s far from clear when – and if – the quantum solution might become better than the classical one.

Soller concluded that all of these factors make quantum sensing “a more difficult market to explain and to enter”. So the next time someone brings up quantum sensors in a discussion about commercializing quantum technologies, don’t just nod and murmur your agreement. Ask them how they’re going to overcome these challenges. The future success of the field may depend on it.

Mystery of comet 67P’s abundant oxygen is solved

In 2015, the European Space Agency’s Rosetta spacecraft made a shocking discovery, detecting a large amount of molecular oxygen in the coma of gas surrounding the comet 67P/Churyumov-Gerasimenko. Oxygen was not expected in a cometary environment because the gas is reactive and the sheer quantity detected suggested that current theories of the chemistry of the early solar system could be wrong. Now, however, a new analysis of the Rosetta data suggests that the 2015 observations are not that surprising after all.

In this latest work, a team led by Adrienn Luspay-Kuti at the Johns Hopkins University Applied Physics Laboratory in the US conclude that the oxygen detected around 67P comes from two internal reservoirs in the comet – and is not indicative of overly large amounts of the molecule in the object.

“We discovered that the oxygen concentration in the comet, which everyone thought was super high, isn’t quite as high after all,” Luspay-Kuti told Physics World. “We are still not sure how exactly the oxygen got into the comet, but we made a huge leap forward in figuring it out,” she adds.

Tied up with water

Previous attempts at explaining the high oxygen measurement had focused on the observation that oxygen and water were present together in the coma. The conclusion reached by some scientists was that oxygen got tied up with water at the birth of the solar system and was then incorporated into 67P. Another possibility is that the oxygen was derived from water within the comet. However, these scenarios have significant conceptual problems, including why such high levels of oxygen were present when the comet was forming or how large amounts of oxygen can be produced in a comet.

To understand the relationship with water, Luspay-Kuti and her colleagues studied seasonal variations in oxygen levels around 67P. Like Earth, the comet spins on an axis that is tilted with respect to its orbit around the Sun. This means that the surface of 67P experiences distinct seasons as it orbits the Sun once every 6.5 years. The team looked at parts of the comet at key time intervals when the seasons changed from winter to spring and then from summer to autumn. This allowed them to study outgassing, which occurs when the icy body of a comet is warmed and releases gases into the coma.

The team found that oxygen and water were emitted when the surface of the comet was warm, but that the association between water and oxygen went away as the surface cooled. Instead, oxygen is linked with carbon dioxide and carbon monoxide during the cold season.

Staggered emission

The team concluded that they were observing the staggered emission of oxygen from two different reservoirs. They reckon that one reservoir is deep within the comet and contains oxygen that has been there since the comet was formed. The second reservoir is near the surface and is made of porous frozen water. The idea is that some of the oxygen escaping from the core becomes trapped temporarily in the frozen water reservoir. But then in the summer, some of this oxygen is released along with water as the ice heats up – creating the observed high oxygen levels in the coma.

“Only one of these reservoirs, the one that’s deep down the comet, is a window to the times before planet formation, whereas the other one is a secondary reservoir closer to the surface that temporarily withholds, traps and accumulates the oxygen,” she adds. “This latter reservoir is responsible for the apparent close link between oxygen and water and for the very high oxygen concentrations.” She adds that their analysis suggests that the oxygen deep within the comet has been there since the comet formed.

Luspay-Kuti says the team’s results highlight the success of the Rosetta, which is the first mission to orbit – rather than flyby – a comet. “Our measurements for 67P have unprecedented spatial and temporal coverage, which is a huge step ahead from the previous flyby-only missions.” She adds, “This level of coverage and ability to watch how the comet changes in real time allow us to learn and understand things about this comet, and comets in general, that we had not been able to before.”

How unique 67P is among comets remains to be seen, but its importance to science as the first comet visited by a mission is clear to Luspay-Kuti. “Comets were essentially the building blocks of the planets and other planetary bodies, and as such, they carry key information about the conditions in our solar system from before and after planet formation. So, if we want to understand the origins of our solar system, we must first understand how comets formed and how they evolved over time.”

The research is described in Nature Astronomy

Deep learning can decrease radiation dose in paediatric CT scans

Deep learning-based reconstruction (DLR), an emerging technique for reconstructing CT images, uses a convolutional neural network to produce low-noise, high-quality images in short times. Researchers in Japan have now demonstrated that DLR can enable substantial dose reduction in paediatric CT exams with the same, or even improved, image quality compared with the use of iterative reconstruction algorithms.

Writing in the American Journal of Roentgenology, the team reports that using DLR for low-tube-voltage exams reduced the image noise without degrading noise texture and image sharpness relative to hybrid iterative reconstruction (HIR) and model-based iterative reconstruction (MBIR).

Because children are more sensitive to ionizing radiation than adults, using the lowest possible radiation dose to obtain diagnostic quality images is the goal of every radiology professional performing paediatric CT. One effective technique for dose reduction in paediatric contrast-enhanced CT combines decreased tube voltage (80 kVp, for example, as opposed to the standard 120 kVp) with iterative reconstruction.

Decreasing the tube voltage, however, increases image noise and can impair detection of low-contrast objects, especially when using reduced slice thicknesses to evaluate small anatomic structures in children, explains principal investigator Yasunori Nagayama of Kumamoto University. And although HIR and MBIR can reduce noise and artefacts, they have limited ability to preserve noise texture, low-contrast spatial resolution and low-contrast object detectability at considerably reduced doses.

To assess and compare the image quality achieved by HIR, MBIR and DLR, the researchers retrospectively analysed the scans of 65 children aged six years and under who underwent contrast-enhanced abdominal CT, 31 with a standard protocol and 34 with a lower-dose protocol. All CT exams were performed using a tube voltage of 80 kVp and automated tube current modulation of mild and standard dose reduction strength, for the standard and lower-dose protocols, respectively.

The team used the AiCE (Advanced intelligent Clear-IQ Engine) Body-sharp algorithm for DLR. All image reconstructions used a noise reduction level of “standard” as well as 1-mm slice thickness and increment.

Two radiologists independently evaluated the noise magnitude, noise texture, streak artefact, edge sharpness and overall quality of each reconstructed image, using a subjective four-point scale. The research team also quantified the image noise, signal-to-noise ratio and contrast-to-noise ratio for all scans. Calculating the size-specific dose estimate (SSDE) for both protocols revealed that SSDE was 54% lower in the lower-dose group than the standard group (1.9±0.4 versus 4.0±1.0 mGy).

The researchers also performed a phantom experiment, using a 20-cm cylindrical phantom, to assess image quality at a wider range of dose settings. They employed the same CT scanner and image parameters as for the clinical patients, using eight fixed tube currents to achieve doses relevant to clinical paediatric CT. Again, they reconstructed the data using HIR, MBIR and DLR with a standard noise reduction level and 1-mm slice thickness.

The team reports that low-dose DLR images had significantly higher subjective scores for noise magnitude, noise texture, edge sharpness and overall quality than standard HIR, low-dose HIR and low-dose MBIR images. DLR also outperformed HIR and MBIR in the phantom analysis.

“This clinical and phantom investigation indicated that, compared with iterative reconstruction algorithms, DLR reduced radiation dose by approximately 50% while preserving or even improving image quality and task-based object detectability for contrast-enhanced 80-kVp CT in young children,” the researchers conclude. “The findings may be applied to achieve substantial radiation dose reductions in paediatric CT in comparison with current IR techniques.”

Biological physics should be recognized as a major discipline within physics, claims report

Biological physics is a thriving area of physics that should be held in the same regard as traditional fields such as condensed-matter and nuclear physics. That is according to a major new report by the US National Academies of Science Engineering and Medicine, which concludes that the field can only reach its full potential with increased funding and improved education in the area.

As a broad and rapidly growing field, biological physics tackles issues such as the folding of proteins, the dynamics of the SARS-COV-2 virus and the organized movement in flocks of birds. The report, which is the first “decadal” survey into the field, highlights four key questions that should act as “foci” for researchers. What are the physics problems that organisms need to solve? How do living systems represent and process information? How do macroscopic functions of life emerge from interaction among many microscopic constituents? And how do living systems navigate parameter space?

The report warns, however, that the field’s rapid growth has brought many challenges. One is that the level of funding for biological physics in the US is barely enough to keep the field going and much of that money is fragmented among multiple funding agencies. To address this, the report calls on the American government to provide the National Science Foundation with resources to increase grant sizes while maintaining the “breadth and coherence” of the field.

The report also says that the National Institute if Health should form sections devoted to biological physics and the Department of Energy should construct user facilities to meet the demands of scientists working in the field. Yet the report is also realistic that establishing a new scientific field within funding agencies will be a “multi-generational” challenge.

Nurturing diversity

As well as boosting the amount of money in biological physics, the report says progress in the field will only be made if it can recruit and nurture a flow of “new and diverse talent”. The 13-member committee that wrote the report found that biological physics is poorly represented in the core US undergraduate physics curriculum and that few students at this level have opportunities to take specialized courses. However, at graduate level, they say they have seen a “rapid growth” in the number of PhD students taking biological physics that has put it on par with other fields of physics.

The emergence of biological physics as a field of physics has been a decades-long process

William Bialek

The report also recommends federal agencies support core undergraduate physics education for under-represented and historically excluded groups. It also calls on faculty from minority-serving institutions to “play a central role” in shaping new federal programmes in this area. In addition, it recommends that “special attention” is given to the experience of female students who are often a minority in physics and a large percentage of which – estimated to be 75% – have reported experiencing harassment.

“The emergence of biological physics as a field of physics has been a decades-long process, and the work of biological physicists already has had an enormous impact on the world,” says William Bialek from Princeton University, who chaired the committee that wrote the report. “Biological physics will continue developing and influencing our understanding of the phenomena of life, and realizing the full potential of the field requires that we rethink how to teach physics, biology, and science in general, revise fragmented funding structures, and welcome and nurture diverse aspiring scientists.”

Otger Campàs, director of the physics of life excellence cluster at the Technical University in Dresden, Germany, who has spent over 15 years working in the US, says that the report will hopefully encourage physics departments “to strengthen their efforts” towards integrating biological physics as an integral part of the subject. “It is also important that the report defines clear roles for physics in the study of living systems as this will guide physics departments and funding agencies in their efforts to help the field,” Campàs told Physics World.

Campàs adds that one of the major challenges of interdisciplinary fields such as biological physics is countering the “rigidity of existing academic structures”. This means that creating specific funding programmes, as is recommended in the report, will be important when helping to further establish the field. “Nature does not care about disciplines, and most scientific problems require expertise from different areas of knowledge, so we should adapt our academic structures to properly address modern scientific problems,” he says.

Developmental cell biophysicist Jean-Léon Maître from the Curie Institute in Paris, France, says that some of the issues in the report will also likely apply beyond the US where biological physics has also been accelerating. When Maître was an undergraduate student in France in the early 2000s, for example, he says that biological physics was not even on the curriculum but in the past five years he has taught three different physical biology Master’s degree programmes.

Maître adds that boosting biological physics as a discipline could also help to attract more women into physics given that they typically make up around 60% of undergraduate students in biology compared to 25% in physics. “Biology certainly seems like a new exciting playground to a growing number of physicists and so far biologists have also benefited from this interest,” he told Physics World.

Friction does the heavy lifting in ropes and yarns

This article has been updated to include comments from Raymond Goldstein and Patrick Warren.

It is a mathematical puzzle that stumped Galileo, but researchers in France think they have discovered how rope and yarn fibres held together by nothing more than friction are able to carry heavy loads without breaking. Jérôme Crassous of the Institute of Physics of Rennes and Antoine Seguin of the Université Paris-Saclay have shown that small twists in a rope multiply into massive frictional forces that lock the fibres together.

Their approach, which combined experiments and simulations, has sparked a discourse about whether yarn fibres undergo a second order phase transition when they are spun together.

Crassous illustrates the yarn twisting problem with a simple demonstration. He holds two brushes (tassels) of cotton fibres, one in each hand. When the brushes are interleaved, they can be pulled apart easily. But, as soon as he starts to twist the interleaved brushes to create a yarn, they become almost impossible to separate. Since Galileo’s time, our interpretation of this experiment has evolved with our understanding of forces and friction, but a complete model remains surprisingly elusive.

The yarn twisting problem

To understand why twisting fibres makes a yarn stronger, imagine trying to push a box along by pushing diagonally downwards rather than parallel to the floor. Because you are pushing into the ground, you create an additional frictional force, and the harder you push, the harder the box is to move.

When you twist two fibres and try to pull them apart, you are trying to move the strands by pushing them into each other as well as pulling them. This tiny frictional force, multiplying rapidly as thousands of fibres are spun together, gives yarn a strength that is far greater than the sum of the individual strands.

Measuring maximum tension in a yarn

Developing a working mathematical model of how this happens has proved difficult. In 2018, UK-based scientists at the Universities of Warwick and Cambridge and Unilever proposed that the locking of the fibres at some critical twist angle is a second order phase transition. Their theory says that at this angle, the maximum tension (stretching force) that the yarn can endure diverges, meaning that if the fibres are strong enough, there is no limit to the load that it can hold.

Crassous and Seguin wanted to test this theory experimentally. This involved clamping the interleaved cotton brushes at one end and applying a fixed angular twist to create a yarn. A stretching force was then applied to the finished yarn and the duo measured the maximum tension in the yarn before it broke.

Does yarn have a second order phase transition?

As they approached the maximum twist the yarn could sustain, Crassous and Seguin watched the maximum load suddenly shoot up. But Crassous does not think their experiments support the 2018 theory from Unilever and Warwick and Cambridge Universities. When they analysed their data, they found that yarn strength scaled with the exponential of the square of the twist angle. Although the yarn eventually breaks, Crassous does not believe that it was heading for a second order phase transition. Instead, he likens the process to the formation of a glass, where viscosity increases rapidly but the material still has a liquid structure.

However, Raymond Goldstein and Patrick Warren, two of the authors of the 2018 paper, argue that the two systems are not comparable and maintain the possibility of a second order phase transition. In 2018 Goldstein, Warren and Robin Ball modelled the fibres as hooking around their neighbours as well as twisting into a rope. They hypothesize that this was not present in Crassous and Seguin’s experiment, but would be enough to lock the fibres together in systems like yarns and sewing threads. The experimental proof or disproof of a second order yarn transition, they conclude, remains undecided.

The researchers also performed numerical simulations and found that they could predict the amount of twisting that would turn the tangle of fibres into a strong yarn. The ratio of the fibre dimensions and the friction coefficient, which they call the “Hercules number” determines whether a yarn forms, and Crassous is confident that this bolsters their results, saying “we have identified all the physics in the system if there is only one number”.

More research is needed to prove or disprove the existence of a yarn phase transition, but intriguingly, these latest results echo another, seemingly vastly different problem. It is nearly impossible to pull two interleaved phone books apart, the force pulling them together is strong enough to lift a car. Interleaving the pages creates normal forces, which amplifies the friction, much like the yarn experiment. This frictional force scales with the exponential of the square of the number of pages, a similar law to the yarn problem, indicating that the physics driving these two phenomena are related.  The research is described in Physical Review Letters.


Frequency multiplication of spin waves to gigahertz frequencies achieved in simple material

A simple method for multiplying the frequencies of spin waves in magnetic materials from the megahertz range all the way into the gigahertz has been serendipitously discovered by researchers in Germany. The research opens new avenues in the study of spin waves and provides laboratory researchers with a simple means to generate a wide variety of spin wave frequencies. Moreover, it could also prove to be a step towards the use of spintronics in commercial devices.

Frequency multiplication using technologies such as non-linear circuitry is a crucial element of everyday electronics. Mobile phones and satellite communication devices, for example, have internal circuitry that operates at megahertz frequencies but they receive and transmit signals at gigahertz frequencies.

However, one problem with today’s electronics devices is the resistive heat that must be dissipated when information-carrying electrical currents flow through circuits. This makes cooling ever-more tightly packed computer processors difficult and means that, as electronics becomes more pervasive, its energy footprint grows remorselessly. At present 10% of the world’s electricity is consumed by digital technology.

Low-energy solution

One potential solution to this energy problem is spintronics in which signals could be carried by spin waves – which are fluctuations in the intrinsic magnetic moments of an ensemble of electrons. In this scenario the electrons themselves do not move, so there is no resistive heating.

“In principle, you can translate spin, and in principle, you can transport spin currents with much lower dissipation than you can with charge currents,” explains Georg Woltersdorf of Martin Luther University Halle-Wittenberg in Germany. Spintronics could also be used in other useful applications such as non-volatile memory. Among the many challenges, however, is that no technologies currently available can multiply spin wave frequencies.

While studying a different problem, Woltersdorf and colleagues pumped a nickel-iron magnet using the radiofrequency magnetic field from a coplanar waveguide. When they analysed the resulting oscillations with diamond nitrogen-vacancy centres, they noticed something bizarre: “There were some lines in the photoluminescence spectra of these diamond NV centres that we just couldn’t explain,” says Woltersdorf, “At first we thought there was something wrong with our frequency source.”  In fact, some of these lines have been seen in previous experiments from other groups, which have concluded exactly this.

Multiple harmonics

After testing their source thoroughly, however, the researchers concluded the lines could only be coming from the material itself. The researchers investigated the effect further using an alternative technique called time-resolved magneto-optic Kerr microscopy. They found that the material was behaving like an extremely large frequency comb, generating up to the 50th harmonic of the fundamental frequency and thereby producing frequencies into the gigahertz range when pumped at megahertz frequencies.

“We have a sinusoidal excitation, but the magnetization responds almost in a digital fashion,” says Woltersdorf; “It will just snap periodically, and if you look at the Fourier transform, it gives you a frequency comb.”

Theoretical analysis led the researchers to conclude that the phenomenon results from switching magnetic domains exchanging spin waves and thereby becoming synchronized. Woltersdorf compares this to the tidal locking of moons orbiting a planet or Belousov–Zhabotinsky reactions in chemistry, which oscillate back and forth. “It tends to happen when you have a non-linear means of communication between different elements of a system. In the case of moons, it’s gravitational force; in oscillating chemical reactions in a beaker, it’s the quantity of reactants you have. It’s like that with spin waves.”

Source of spin waves

The researchers are now investigating the underlying physics behind the phenomenon more deeply. They hope to measure the ultimate limits of the effect in nickel-iron and see if even higher harmonics can be generated in other materials. Beyond this, they would like to develop the phenomenon as a useful source of high-frequency spin waves for laboratory experiments. As for spintronics, “Whether or not one can then come up with spin-based electronics that has significant-enough advantages over conventional electronics…That’s beyond my abilities,” concludes Woltersdorf.

Chris Hammel of Ohio State University describes the results as “quite remarkable”, adding, “Spin textures are of very intense interest and importance right now, and this is a form of spin texture that I’ve not really seen – a dynamical spin texture that only exists in this very deeply non-linear regime of intense spin waves. There will be a lot of things people will want to do with this.”

Gregory Fuchs of Cornell University in New York is equally surprised: “The first part of the paper I thought ‘This is probably bogus’,” he says; “Then they did some follow-up experiments that I don’t have a good way of disputing, and they have a micromagnetic model that explains the phenomena, so I think it’s actually correct. That makes it very interesting. Whether it’s important is defined by what happens next.”

The research is described in Science.

New technique makes directional measurements of low-energy solar neutrinos

Until now, physicists measuring the properties of solar neutrinos have had to make a compromise – either measure the particles’ energy with high precision and sacrifice directional information or pin down direction and settle for inferior energy resolution. But now physicists working on the Borexino neutrino detector in Italy have shown it is possible to make both measurements simultaneously by exploiting the known position of the Sun at any time to work out the trajectory of electrons scattered by incoming low-energy neutrinos. The team says their new technique paves the way for hybrid measurements that could yield fresh insights into the workings of the Sun and nuclear physics more broadly.

Solar neutrinos are produced during the fusion reactions that generate the Sun’s immense heat. Their detection on Earth provides information about the different stages of those reactions, revealing the relative importance of different fusion pathways for forging heavier elements from hydrogen. Such observations can also help to better understand the basic physics of nuclear decay and of neutrinos themselves.

Borexino has been at the forefront of solar neutrino research over the last 15 years. It has measured neutrino fluxes from the different branches of the proton-proton chain and more recently from the previously elusive carbon–nitrogen–oxygen cycle – both of which convert hydrogen into helium in the Sun. It has done so using a detector housed in the Gran Sasso National Laboratory, located 1400 m beneath a mountain in central Italy. Currently being dismantled, that detector consisted of 280 tonne of an extremely radio-pure liquid scintillator shielded by a layer of water inside a large cylindrical tank.

The detection scheme relied on picking up the tiny signals generated when incoming solar neutrinos scatter off electrons within the scintillator. More specifically, it detected the light given off by the scintillator molecules when excited by the recoiling electrons.

No trajectory information

This scintillation light is emitted in all directions, which made it easy to pick up via the hundreds of photomultiplier tubes (PMTs) that lined the inside of the detector. As such, Borexino was able to measure neutrino energies at high resolution and down to quite low energy thresholds. However, this isotropic emission provides no clue about the scattered electrons’ trajectories – which is vital information for suppressing (isotropic) background interference as well as distinguishing between different types of recoil particle.

Such directional information is instead the forte of Cherenkov detectors, such as the Super-Kamiokande facility in Japan. These use vast quantities of extremely pure water as their detecting medium, and measure the Cherenkov radiation given off when a recoiling electron travels faster than the speed of light in water. That light is emitted in a cone around the electron’s direction of travel and can therefore be used to work out the particle’s trajectory. However, Cherenkov emission only occurs for electrons above a minimum kinetic energy, which is dictated by the medium’s refractive index. For water, the required energy is 0.25 MeV. In practice, however, the finite coverage and efficiency of the PMTs, combined with the distorting effects of background radiation, lead to a neutrino detection threshold of around 3.5 MeV.

Borexino physicists have now shown it is possible to lower this threshold by correlating the Cherenkov photons with the Sun’s known position at any point. This relies on the fact that incoming solar neutrinos tend to scatter electrons along a very similar path to their own. As such, the ensuing radiation is picked up by PMTs fairly close to the solar-detector axis. This implies that the Cherenkov photons can in principle be distinguished from background radiation, which, like the scintillation photons, is not correlated with the Sun’s position.

Few and far between

The problem is that these Cherenkov photons are too few and far between to generate any measurable signal above the noise. But the Borexino researchers reckoned it might be possible to pick them out by associating them with the far more numerous scintillation photons generated several nanoseconds later. The low signal-to-noise ratio means that individual Cherenkov events cannot be picked up, so multiple data points need to be collected and used to plot a graph showing the angle that early arriving photons make with the solar axis. The signature of Cherenkov photons would then be a peak in the angular distribution close to the forward direction.

That is what Borexino researchers found when re-analysing old Borexino data, whose calibration allowed for an accurate analysis of the expected Cherenkov light. Restricting their analysis to the energy range 0.54–0.74 MeV, they found a peak among the 19,904 data points. They then used a computer simulation to separate the solar-neutrino events from background, and concluded that real events numbered 10,887. This, they say, implies a statistical confidence just above the 5σ discovery threshold that they have detected Cherenkov photons.

The team says that having directional information at low energies should in principle allow for detailed scrutiny of the Sun’s carbon–nitrogen–oxygen cycle. It should also improve searches for a very rare nuclear process in the detector known as neutrinoless double beta decay because solar neutrinos constitute a source of background in the search. They describe their result as a “proof of principle” demonstration of hybrid Cherenkov-scintillation event detection, noting that their measurement contains quite large statistical and systematic uncertainties. But they reckon it should be possible to achieve greater sensitivities by using better adapted PMTs and electronics, as well as maybe a different scintillator material.

Gabriel Orebi Gann of the University of California, Berkeley, who was not involved with the research, argues that the latest work represents “a critical development” in neutrino detection technology. She agrees that more needs to be done to reap the full benefits of such hybrid detection – for example, being able to establish recoil direction on an event-by-event basis rather than through statistical reconstruction. If that can be done, she says, then a broad range of applications stand to gain – from solar physics to nuclear non-proliferation monitoring.

The research is described in two papers published in Physical Review Letters and Physical Review D.

Smart bra can detect breast cancer early, physics jokes on T-shirts

This week’s Red Folder looks at items of clothing – one that could save lives and others that are just a bit of fun.

First up is a smart bra developed in Nigeria that could detect breast cancer early. Invented by the Abuja-based robotics engineer Kemisola Bolarinwa, the garment uses ultrasound imaging technology to locate potential tumours. The battery-operated rechargeable system comes with mobile and web apps, and it can transmit its findings to a doctor.

The bra has to be worn for at least 30 minutes to complete a scan, which Bolarinwa says can determine whether a tumour is benign or malignant. A local trial of the device suggests that it has an accuracy of about 70% and she is working on boosting this to 95–97%

Bolarinwa is founder of Nextwear Technology – a wearable technology company – and developed the bra after watching her aunt die of breast cancer after a late diagnosis. She says that the smart bra could allow testing to be done at home, eliminating the the need for many African women to make long journeys to access screening services.

Here are a few dodgy physics jokes for you.

“Never trust an atom, they make up everything.”

“You matter…Unless you multiply yourself by the speed of light squared…Then you energy.”

“Think like a proton and stay positive”

Had enough? If not, you can get all those slogans on a T-shirt, plus lots more from Tangoscience. So, if you are keen to get your Christmas shopping done very early this year, have a look.

Nanoparticle labelling enables accurate visualization of therapeutic T cells

Osteosarcoma is the most common form of bone cancer, but it has a poor prognosis, with only 15–20% of patients remaining cancer-free for two years. Currently, the main form of treatment for osteosarcoma is immunotherapy, which involves modifying a patient’s T cells to target antigens expressed on tumour cells. Researchers have found that using chimeric antigen receptor (CAR) T cells targeted to tumour-specific antigens can significantly improve treatment efficacy.

Clinical techniques used to monitor the activity and distribution of CAR T cells in tumours include flow cytometry and analysis of blood samples, or biopsies of sites with CAR T cell activity. Although these existing approaches are useful, flow cytometry measurements from circulating T cells do not accurately represent the response at the tumour site, while repeated invasive biopsies are not practical for patients.

As an alternative method for visualizing the CAR T cell distribution, a research team headed up at Stanford University proposes labelling CAR T cells with nanoparticles, which can then be monitored with several imaging modalities. The researchers investigated the use of ferumoxytol, an approved iron supplement made of iron oxide nanoparticles, which can be detected with magnetic resonance imaging (MRI), photoacoustic imaging and magnetic particle imaging. The researchers believe that monitoring the distribution of ferumoxytol-labelled CAR T cells could help optimize and personalize treatment regimes.

In vivo imaging of nanoparticle-labelled CAR T cells

Lead author Louise Kiru and colleagues, also from Georgia Institute of Technology and the University of Pennsylvania, have developed a clinically-translatable technique to label CAR T cells with ferumoxytol. To evaluate this method, they assessed the viability and functionality of ferumoxytol-labelled CAR T cells, reporting their findings in the Proceedings of the National Academy of Sciences. They also investigated the optimal multimodal imaging technique to monitor the accumulation of the labelled cells in the tumour.

The researchers used a microfluidics device to label the CAR T cells with ferumoxytol via mechanoporation, a technique that involves imparting physical force onto the cell membrane to create nanopores for the delivery of nanoparticles. This approach significantly improved the uptake of iron per cell in comparison with traditional co-incubation techniques. Using bioluminescence imaging, the researchers found that mechanoporation had minimal impact on the viability of ferumoxytol-labelled CAR T cells. They also demonstrated that the function of CAR T cells in vitro was not impacted by the labelling process.

Next, the researchers used T2*-weighted MRI to monitor the accumulation of ferumoxytol-labelled CAR T cells in osteosarcoma-bearing mice, before the infusion of cells and for three consecutive weeks afterwards. They identified iron enhancement in the tumour one week after administration, as a result of nanoparticle labelling. Additionally, they observed that the iron signal in the tumour vasculature slowly dissipated. This indicates that ferumoxytol-labelling can enhance the infiltration of T cells in the tumour whilst diluting the iron level in CAR T cells.

The researchers also identified a correlation between the accumulation of ferumoxytol-labelled CAR T cells at week 1, as determined with MRI, and the decrease in tumour size at week 3. Following an initial increase in tumour size due to pseudo-progression, three weeks after administration of the ferumoxytol-labelled CAR T cells they noted a 13-fold reduction in tumour size compared with pre-treatment images. This indicates that labelling with ferumoxytol does not affect the CAR T cells’ ability to treat tumour cells. “Our data suggest that ferumoxytol MRI could serve as a predictive biomarker for tumour response to CAR T cell therapy,” says Kiru.

Finally, monitoring the accumulation of ferumoxytol-labelled CAR T cells using photoacoustic imaging confirmed the findings from MRI. Similarly, the team utilized magnetic particle imaging for direct quantification of iron oxide nanoparticles and observed a greater concentration of iron in the tumour at week 1 compared with unlabelled-CAR T cells.

The future of CAR T cell imaging

In addition to successful labelling of CAR T cells with iron oxide nanoparticles, Kiru and colleagues have demonstrated the ability to monitor the accumulation of these labelled cells for osteosarcoma treatment, using a variety of imaging techniques. “The imaging approach can be used to monitor the localization of the therapeutic cells in a dose-dependent manner and contribute to elucidating the factors that give rise to responders and non-responders of T cell therapy for solid tumours,” they say.

In future, the researchers envision wider implementation of this technique. “While an osteosarcoma model is used here, it is possible to use this imaging strategy for tracking other therapeutic cells, including CAR T cells targeted to glioblastoma, where strategies for tracking therapeutic cells in the brain are limited,” they write.

Copyright © 2026 by IOP Publishing Ltd and individual contributors