Iron has been an important metal to humans for thousands of years, but it has a serious flaw: when exposed to moisture, it rusts easily. Understanding this corrosion process, and ultimately finding ways to slow or stop it, is therefore hugely important. Thanks to atomic-scale first-principles molecular dynamics simulations , researchers at Rice University in the US have now found that the material’s surface plays a crucial role in corrosion, forming reactive species even when immersed in a non-corrosive fluid.
Iron does not only rust in water. It also, somewhat counterintuitively, rusts in supercritical carbon dioxide (sCO2) – an inert substance often used in industrial applications because it is non-toxic, non-flammable, non-explosive and relatively cheap. In the new work, a team led by Boris Yakobson and Evgeni Penev found that when iron is exposed to sCO2, the surface of the iron acts like a catalyst, activating the inert fluid and lowering the energy barrier for the formation of reactive molecules like *HCO3– and *CO32- at the interface between the iron and the sCO2.
Water and nitrogen dioxide (NO2) are the two common impurities in sCO2. Any trace water molecules present in the sCO2 also react with the activated sCO2 and form active corrosive species in turn, including oxygen, hydroxide, carboxylic acid and nitrous acid. The water reacts with other impurity molecules such as NOx and SOx too, forming corrosive acids such as H2CO3, HNO3 and H2SO4. Finally, water provides a hydrogen bond network that triggers interfacial reactions with the activated CO2 and impurities, again forming active, corrosive species, such as *OH, *O, *COOH.
The power of theoretical modelling
The researchers obtained these results by performing ab initio molecular dynamics simulation at the atomic level. Their findings shed fresh light on the mechanisms behind metal corrosion in aqueous and supercritical fluids and may even point to possible remedies. Writing in the journal Matter, the researchers suggest that thin hydrophobic layers of two-dimensional materials such as graphene or hexagonal boron nitride could be employed as a barrier between the iron atoms and the reactive elements of sCO2.
The study also illustrates the power of theoretical modelling to solve complicate chemistry problems, they say – in this case, enabling them to predict the thermodynamics of the reactions occurring and so estimate corrosion rates between iron and sCO2.
The team says it now plans to understand more about the chemistry at the interface. “We also want to find the electronic descriptor of the metal surface controlling the CO2 and H2O adsorption, hence preventing the metal from corrosion,” Yakobson tells Physics World.
Molecules that act like paddlewheels can help propel sodium ions through a solid-state electrolyte. This finding, by researchers at Duke University in the US, could aid the development of next-generation batteries with a wide range of applications, including data storage centres, thin smart phones and light electric vehicles.
Lithium-ion batteries are today’s energy source of choice in portable electronics and electric vehicles. However, the flammable and toxic organic electrolytes they contain are a cause for concern. Lithium is also rare and expensive relative to some other, more common metals, and the global supply is subject to various uncertainties.
Sodium’s energy density is lower than lithium’s, but it is nonetheless a promising alternative for battery applications thanks to its relative abundance and lower cost. The difficulty is that only a few materials conduct sodium ions well enough to make good electrolytes. Researchers are thus keen to identify new solid electrolytes in which the ions diffuse quickly and understanding the mechanisms responsible for this diffusion is a key step in that process.
Strongly anharmonic phonon modes
Led by Olivier Delaire, the Duke researchers used neutron scattering experiments at the Oak Ridge National Laboratory to study one possible electrolyte, sodium thiophosphate (Na3PS4). The crystal structure of this material was known to create a one-dimensional tunnel for sodium ions, but the new work showed that the pyramid-shaped phosphorus-sulphur PS4 units that frame the tunnels also twist and turn. This motion gives rise to strongly anharmonic phonon modes that act like paddlewheels, helping the sodium ions move through the material by allowing them to “hop” along minimum energy pathways.
While this process had been predicted by theory, the results of Delaire and colleagues show that it is much more complex than previously thought – something that they confirmed using ab initio molecular dynamics and extended molecular dynamics calculations at the National Energy Research Scientific Computing Center. In the new calculations, the Duke team used a machine learning algorithm to analyse the potential energy surface in which the atoms vibrate and move.
The researchers say their results, which they describe in Energy & Environmental Science, provide a microscopic understanding of how atomic vibrations facilitate the diffusion of sodium ions through the material. They are now studying a slightly different version of their material that contains antimony instead of phosphorus.
Patient safety, patient throughput and patient experience: these are the clinical reference points informing the development roadmap for the APOLLO laser system from LAP, the German laser and radiotherapy QA specialist. With around 3000 units shipped annually to radiation oncology clinics worldwide, APOLLO lasers are nothing if not pervasive, ensuring accurate, repeatable positioning of the patient versus the linac isocentre to enhance the safety of radiation delivery while streamlining the radiotherapy workflow. Equally significant, APOLLO lasers represent a core enabling technology for manufacturer-independent quality assurance (QA), ensuring precise orientation of the phantom and its ancillaries in a range of testing set-ups for patient, machine and end-to-end radiotherapy QA checks.
Raphael Schmidt: “Efficient patient positioning delivers sustained time savings for the treatment team.” (Courtesy: LAP)
“After treatment planning via CT or MRI simulation, the patient is positioned on the linac treatment couch,” explains Raphael Schmidt, LAP’s product manager for CT, MR and linac laser systems. “The APOLLO source’s ultranarrow laser lines then project the linac isocentre coordinates onto the patient’s skin, allowing for alignment with millimetre accuracy against the planning CT/MR image, while also ensuring reproducibility throughout successive fractions of a high-precision radiotherapy programme.”
Operational flexibility, it seems, underpins the APOLLO product design versus key clinical pain points, including: enhanced and ergonomic patient accessibility for the radiation therapist; efficient positioning and rotation of the patient in bore-type linacs; improved interaction (with more eye contact) between patient and therapist; as well as clear demarcation between the patient positioning and treatment steps.
That flexibility extends to the in-room installation, with various possibilities for combining wall-, ceiling- or floor-mounted APOLLO laser units. Different attachment systems and adjustable retainers allow LAP to adapt the laser system to the specifics of the customer’s treatment room and linac set-up. Further, the APOLLO system has three lasers for the coronal, sagittal and transversal body planes, while an optional fourth laser prevents possible shadowing from the linac gantry.
For the medical physics team, the principal motivation for deploying APOLLO lasers is to optimize the machine and workflow ergonomics in the treatment room – in effect, creating the conditions for streamlined patient positioning at scale. A case in point is the alignment of larger patients on the treatment couch prior to irradiation in a bore-type linac – for example, Varian’s Halcyon and Ethos treatment systems. “With the help of APOLLO lasers,” notes Schmidt, “the therapist can lift and rotate the patient in an ergonomically friendly position before the treatment couch enters the bore – after which any repositioning becomes cumbersome and time-consuming. Our clinical customers tell us that lifting the patient in this way makes it easier to go for the last millimetre in terms of positioning accuracy.”
On a day-to-day basis, meanwhile, APOLLO lasers enhance the radiotherapy workflow and minimize the requirement to reposition the patient after the cone-beam CT (for image guidance). “Efficient and accurate patient positioning helps to maximize patient safety and minimize the need for reimaging, delivering sustained time savings for the treatment team,” claims Schmidt. “It’s a win-win, with patients receiving high-quality radiotherapy fractions on schedule and clinics hitting or exceeding their throughput targets.”
The clinical upside
If that’s the vendor perspective, what of the view from the clinical sharp-end? Stéphane Muraro, a senior medical physicist at the Centre de Cancérologie du Grand Montpellier (CCGM), France, is an enthusiastic advocate of LAP lasers for patient positioning, having installed APOLLO laser units alongside the clinic’s Varian Halcyon treatment machine as well as its Accuray CyberKnife robotic radiotherapy system.
Stéphane Muraro: “The APOLLO lasers help us to position the patient correctly first time, every time.” (Courtesy: CCGM)
For Muraro and colleagues, the APOLLO lasers have yielded significant – and sustained – efficiency gains when setting up patients for treatment in the Halcyon system. “We use APOLLO lasers to ‘pre-install’ the patient outside the linac bore, enhancing both patient safety and patient throughput,” he explains. “After all, if you get the patient positioning right on the treatment couch outside the bore, you can be very sure of their positioning inside the bore of the machine.”
All of which translates into a “friction-free” radiotherapy workflow at CCGM, with typically 15-minute slots allocated for the positioning and treatment of each patient on the Halcyon system. “The APOLLO lasers help us to position the patient correctly first time, every time,” says Muraro. “This also improves the patient’s experience in the treatment suite by minimizing the stress resulting from delays and repeat positioning. Ultimately, the more relaxed the patient, the better they are able to hold their position and the better the treatment outcome.”
APOLLO’s broader benefits
Those APOLLO gains also extend to the daily QA on the Halcyon machine, including the use of an imaging phantom to verify the system’s image-guided radiotherapy (IGRT) functionality – specifically, the alignment between treatment and imaging geometries as well as the accuracy of the couch adjustments. “Regarding the daily QA, the first task with Halcyon is to install the phantom at the start of each day,” notes Muraro. “The physicists can then make a ‘double verification’ of positioning with the APOLLO laser and Halcyon’s internal laser. It’s easier to position the phantom and QA devices using the external lasers, aligning the phantom exactly as you would align the patient.”
Looking ahead, Muraro and the CCGM medical physics team are keen to scale their deployment of APOLLO lasers. “The APOLLO lasers are extremely reliable, resistant to scattered radiation and easy to adjust via remote controller as needed,” he concludes. “We plan to install the APOLLO lasers on our two Varian C-arm linacs in the next couple of years.”
Following the full product launch in the spring of last year, LAP has been encouraged by the clinical response and early uptake of its THALES 3D MR SCANNER, billed as a “gold-standard dose accuracy check” for medical physics teams tasked with overseeing the acceptance and ongoing verification of the new generation of MR-guided radiotherapy (MR/RT) systems.
Now, diversifying beyond those initial QA applications for MR/RT systems, LAP has released a dedicated version of the automated water phantom (the THALES 3D SCANNER) for the commissioning and QA of traditional bore-type linacs – specifically targeting clinical users of Varian’s Halcyon and Ethos radiotherapy machines.
Worth noting that the imminent software upgrade (expected in April) of the THALES 3D SCANNER will provide clinical users with dedicated functionalities to simplify the beam-model validation of the Halcyon machine, including the release of “continuous mode” operation. The latter will ensure “an outstanding level of data quality and accuracy”, says LAP, “while reducing the occupancy time of the treatment machine by a factor of four versus current commercially available step-by-step scanning modes”.
Simon Portegies Zwart, an astrophysicist at Leiden University in the Netherlands, is ecologically conscious. He hardly ever flies for professional reasons anymore, preferring to travel by train instead. “I like to be environmentally friendly by being a vegetarian, trying to reduce my carbon footprint, telling my children not to shower too long, switching to renewable resources.” But once Portegies Zwart had decided to make those changes, he started considering other aspects of his carbon footprint too.
“I’m a heavy user of large machines and these computers consume as much energy as a small city,” he explains. “I think I am probably the most polluting person on my street. If I run a supercomputer that takes as much energy as 10,000 households then who am I to tell my children, or other people, they shouldn’t shower for 20 minutes?”
As the world grapples with the consequences of climate change, many scientists have begun to face up to the realities of their carbon emissions. Much of the focus is on air travel for academic purposes, where researchers are facing uncomfortable revelations. It turns out, for example, that climate-change researchers fly more frequently than scientists in other fields. According to a 2020 study (Glob. Environ. Change65 102184), climate scientists jet off two to three times a year on average, whereas other researchers get on planes just twice during that time. But other scientists also fly a lot. A 2019 study (Environ. Res. Lett.14 095001) found that professors at the University of Montreal in Canada had twice the annual carbon footprint of the average Canadian, with most of the difference linked to professional travel.
Trips to academic conferences in particular are a huge part of the problem. When the Fall Meeting of the American Geophysical Union took place in California in 2019 the 28,000 delegates emitted around 80,000 tonnes of CO2 equivalent (tCO2e) travelling there and back home afterward. This was almost three tonnes per scientist, or the average weekly emissions of the city of Edinburgh (Nature583 356).
Furthermore, another recent Canadian study, done at the University of British Columbia, showed that air travel for academia has little to no positive impact on productivity or professional success (J. Cleaner Prod. 226 959). And of course, in light of the global COVID-19 pandemic, most academics have been forced to adopt and embrace online conferences and workshops. Online events have allowed a more diverse range of delegates to attend, but there have been environmental benefits too. A 2021 study found that 7000 virtual delegates at three large scientific meetings, held online in 2020, had the same carbon footprint as a single in-person attendee to the same events in 2019 (Nat. Sustain. 10.1038/s41893-021-00823-2).
Researchers working in physics have found that their computer usage can make up a huge part of their carbon footprint – sometimes even more than air travel
Cosmic computing costs
While the impact of academic travel on climate change is indisputable, over the last few years a number of physicists have found that their computer usage can make up a huge part of their carbon footprint – sometimes even more than air travel.
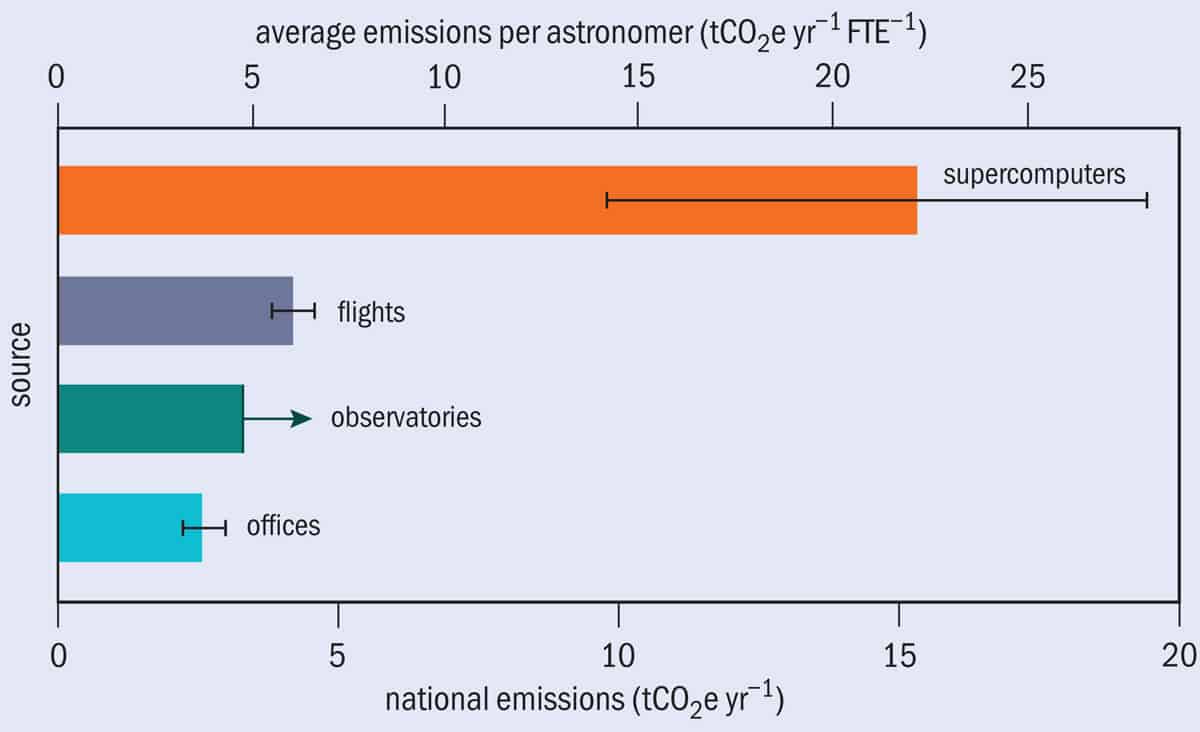
Just ask Adam Stevens, an astrophysicist at the University of Western Australia. Together with colleagues, he has analysed Australian astronomers’ total greenhouse-gas emissions over 2018–2019 from “regular activities” such as travelling, using supercomputers and working at large observatories. The study found that the average Australian astronomer produces around 37 tCO2e per year (Nat. Astron. 4 843). That’s 40% more than the average Australian and five times the global average. The biggest contribution to this was the use of supercomputers to process the enormous amounts of data collected by telescopes and carry out cosmological simulations. At around 15 tonnes per astronomer, it ran to almost four times their annual emissions from flights (figure 1).
In another example, the upcoming Giant Array for Neutrino Detection (GRAND) project will use 200,000 antennas spread across mountainous regions around the world to detect ultrahigh-energy neutrinos originating from deep space. Last year, the team behind the project estimated the greenhouse gas emissions for the three different stages of experiment: the prototype, the mid-scale stage and the full-scale experiment, which will start in the 2030s. What they call “digital technologies” – simulations and data analysis, data transfer and storage, and computers and other electronic devices – will account for a huge proportion of the project’s carbon footprint (Astroparticle Physics131 102587).
In the prototype stage 69% of emissions are expected to be from digital technologies, compared with 27% from travel and 4% from “hardware equipment”, such as manufacturing the radio antennas. In the mid-stage, digital technologies will account for 40% of emissions, with the rest split equally between travel and hardware. Once the full experiment is up and running most of the emissions will be shared between hardware (48%) and digital technologies (45%).
What’s interesting is that the environmental cost of supercomputing can depend hugely on where the energy to power the devices comes from. In 2020 the Dutch Astronomy Council asked Portegies Zwart and a group of other researchers to analyse the carbon footprint of its six member institutes (Nat. Astron. 5 1195). They estimated that in 2019, the average astronomer in the Netherlands emitted 4.7 tCO2e – far less than in Australia – with just 4% of that coming from supercomputing.
Floris van der Tak, an astrophysicist from the Netherlands Institute for Space Research who led the study, sees no reason why Dutch astronomers would be using supercomputers less than their Australian colleagues. The differences are therefore likely due to differences in energy supply. In particular, the Dutch national supercomputing facility SURF does not produce any carbon emissions because it uses 100% renewable power produced by wind or solar in the Netherlands. The few emissions that are released come from using international facilities and smaller Dutch supercomputers. In fact, Portegies Zwart now always checks to see whether a supercomputer he uses runs on green energy and, if it not, he considers using a different facility. Similarly, van der Tak’s advice is “before you ask for time on a facility, first check what kind of power they are using”.
Source of the problem
Greenhouse-gas emissions at the Max Planck Institute for Astronomy in Heidelberg, Germany, highlight similar intercountry differences. In 2018 each researcher at the institute emitted around 18 tCO2e (Nat. Astron. 4 812) – more than astronomers in the Netherlands, but half that of their Australian counterparts (figure 2). These emissions were also 60% higher than the average German resident and three times the German target for 2030, which is in line with the Paris Climate Accords.
Around 29% of the Max Planck Institute’s emissions in 2018 were from electricity consumption, with computing, particularly supercomputing, accounting for 75–90% of that. The key difference between Germany and Australia was where the power came from. In 2018 around half of Germany’s electricity was from solar and wind, whereas in Australia the vast majority was produced from fossil fuels, mainly coal. This meant that in Australia, electricity for computing produced 0.905 kg of CO2 per kilowatt hour, while the Max Planck Institute emitted 0.23 kg of CO2 per kilowatt hour.
Van der Tak does point out that much of this work was conducted a few years ago, and that the world has moved on. More offices now use renewable power, for example. As the Dutch study found, just under a third (29%) of Dutch astronomy’s carbon footprint in 2019 came from its use of electricity, including powering local computing at the six research institutes. Back then, half of the institutes were running on green electricity. But since then, two more have moved to 100% renewable power and van der Tak expects the sixth to make the switch in the next two years.
Indeed, things have also changed in Australia. Since July 2020 one of the country’s three national high-performance computing facilities, the OzSTAR supercomputer, has switched to 100% renewable energy purchased from a nearby wind farm. Swinburne University of Technology, which hosts the supercomputer, claims this will dramatically cut its carbon footprint, as electricity represented more than 70% of emissions.
Location, location, location
But how can you work out the emissions from the supercomputer you happen to be using? When mathematician and physicist Loïc Lannelongue found there was no easy answer, he developed Green Algorithms. It’s an online tool that enables researchers to estimate the carbon footprint of their computing.
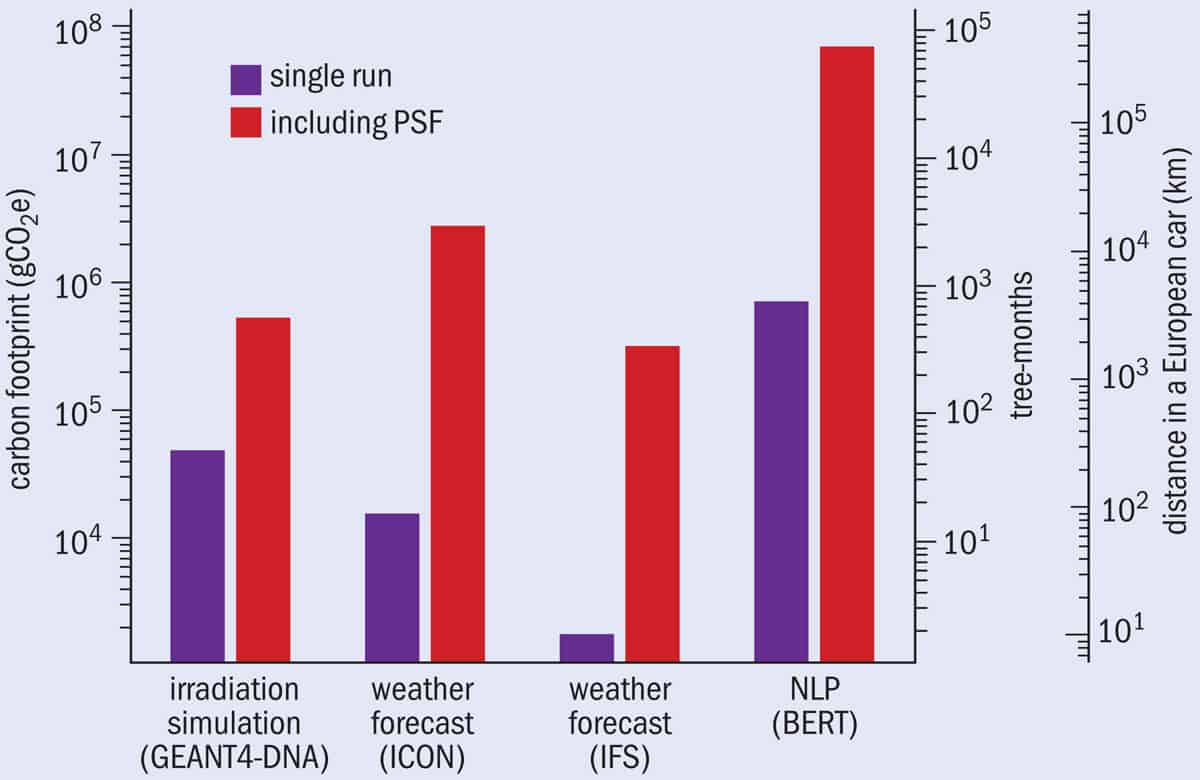
Lannelongue, who is based at the University of Cambridge, UK, reiterates that location is key. Running the same task on the same hardware in Australia, for example, would emit around 70 times more carbon than in Switzerland, which gets much of its electricity from hydropower. The research behind the algorithm (Adv. Sci. 8 2100707) shows that a more efficient computing centre can quickly lose its green advantage if it uses less renewable energy than an alternative less efficient supercomputer. While estimating the carbon footprint of any algorithm is based on key factors such as hardware, how long the task takes and the location of the data centre or supercomputer, Green Algorithms also has a “pragmatic scaling factor” (PSF) that estimates the number of times a computation is performed in practice – which has a direct impact on emissions.
3 Quantifying computing’s carbon footprint Green Algorithms is a free tool to estimate the carbon footprint of an algorithm. It uses a number of factors, including the hardware requirements of the tool, the runtime and the location of the data centre. Users can evaluate their computations or estimate the carbon savings or costs of redeploying them on other architectures. This graph compares the carbon footprints of a number of algorithms from a variety of scientific fields – from particle physics simulations and DNA irradiation to atmospheric sciences and machine learning – and compares each algorithm being run only once, to repeated computations for the same task (PSF). The result in grams (g) of carbon dioxide (CO2) equivalent (e) is compared to the amount of carbon sequestered by trees and the emissions of common activities, such as driving a car. Taken from Adv. Sci.8 2100707.
Indeed, most algorithms are run multiple times – sometimes even many hundreds of times with different parameters – and the number can vary greatly depending on the task and the research field (figure 3). The research also found that the emissions of computing in South Africa, as well as some states in the US, are similar to Australia. On the other hand, the carbon intensity of electricity in Iceland, Norway and Sweden is particularly low.
With cloud computing it is now much easier for researchers to choose which supercomputer they use. But if they are unable to switch to a different machine, there are still other ways they can reduce their emissions. Lannelongue says that simply using the latest version of your software can make a massive difference. “Updating versions and using optimized software is maybe the next big step if you can’t act on location because it will impact everything, as it will reduce the computing requirements,” he explains.
Better coding
Efficient coding is also vital for making computing greener. “I see a lot of people around me coding extremely inefficiently,” says Portegies Zwart. But as he explains, if you take a bit more time and optimize your code, it will run faster, and so produce fewer emissions. Switching coding languages could also be a good idea.
To test this, Portegies Zwart conducted an experiment where he took an algorithm and ran it using about a dozen different coding languages (Nat. Astron. 4 819). He says that none of the codes were particularly optimized, and each took a similar amount of time to write. But Python, the most popular coding language among physicists, takes a lot longer to run and so produces more emissions than other languages, such as C++ or Fortran. The issue, according to Portegies Zwart, is that Python is extremely easy to use, but hard to optimize, while other languages are harder to code, but easier to optimize.
Simply shifting away from Python, however, is not necessarily the answer. In response to Portegies Zwart’s paper, CNRS researcher Pierre Augier argued that better education and the use of Python compilers could be just as effective. Augier, an expert in fluid dynamics and turbulence at the University of Grenoble Alpes in France, used better optimized code and five different implementations of Python to run a similar experiment. He found that four of the implementations were faster and produced fewer emissions than C++ and Fortran, adding that they are also simpler to understand and use (Nat. Astron. 5 334).
“I don’t think it is easier to move to a different language, because it is not very difficult to learn how to correctly use Python,” Augier explains. Instead of focusing on what coding language to use, he argues that computing and programming should be a bigger part of physics education. “We should learn it when we are students, as soon as we specialize in physics.” Portegies Zwart agrees that Python can be efficient, but he says that does not reflect reality. “I’m not bashing Python, I’m using Python the way most astronomers do, and that is not very highly optimized,” he explains. He thinks that instead of teaching physicists more computing, perhaps physics research institutes should employ more computer experts. “We are great at physics, but a computer scientist spent all the time we learned about physics learning how to communicate with a computer,” he says. “There is no doubt that [they] will be better at programming.”
Hidden emissions
But it is not just simulations on supercomputers that can be carbon intensive. Kumiko Kotera, from Sorbonne University in France, who co-founded the GRAND neutrino project, says that when you look at the experiment’s predicted emissions “you can see that what is really costly is data storage and data transfer”. Kotera and her colleagues found that data storage and transfer will account for roughly half of total annual emissions in the prototype stage of the experiment, a quarter in the mid-stage and more than a third during the full-scale experiment (Astroparticle Phys. 131 102587). By comparison, data analysis and simulations will produce around 16%, 13% and 7% of emissions, during the three stages, respectively.
The carbon footprint of data storage and transfer comes from the energy demands of data centres. As with supercomputers, data storage can be tackled to an extent by using data centres with lower emissions. Kotera says that the GRAND project will also be looking at strategies to reduce the volume of data. She explains that this will probably involve being mindful about what is archived – “we don’t need to keep everything” – and finding ways to efficiently clean data.
“If we can clean up the data quite quickly, we can probably reduce a lot of the volume and emissions,” she explains. “For data transfer it is tricky because it is a global network.” But cleaning and reducing data volumes can still help, and scientists can also be careful about what they transfer. Multiple people repeatedly transferring the same pieces of data around the world can quickly add up.
The team calculated that data transfer during GRAND’s five-year prototype stage will emit 470 tCO2e – similar to around 270 flights from Paris to Dunhuang airport, near the prototype’s experimental site in China. In fact, the researchers found that sending hard drives by plane four times a year would be many orders of magnitude less carbon-emitting than transferring the data online.
An accelerator’s footprint As part of reducing its overall carbon emissions, CERN brought in an environmental engineer to oversee the civil engineering of future construction projects. (Courtesy: CERN)
Due to the distributed, global nature of data centres, calculating emissions from data storage and transfer can be tricky. Kotera cautions that their figures are not precise as there are many unknowns, while van der Tak is unsure how much data storage and transfer is covered by the carbon footprint analysis of Dutch astronomy, adding that it might be something they need to look at.
Particle physicists need to do their bit too. CERN, for example, produces around 100 petabytes of data every year. This is stored, distributed and analysed using the Worldwide LHC Computing Grid (WLCG), a global collaboration of around 170 computing centres in more than 40 countries. CERN now publishes environment reports, with the second – published last year – describing the energy-efficiency improvements implemented at the LHC, specifically its ability to gather more data per unit of energy used. Over the 20-year lifespan of the upgraded machine, it will be 10 times more energy efficient than when CERN’s flagship facility was originally switched on. But the report also acknowledges that it doesn’t really cover the emissions of the WLCG. Energy consumption is only detailed for WLCG facilities owned or operated by CERN.
Change your mindset
Lannelongue would like it if researchers just started thinking more about the emissions of their computing, factoring it into their decisions. A good example is running inefficient code and software overnight because you have the computer resources and you are going to be at home in bed, so it does not matter if it takes ages. “That is fine until you say if I make it more efficient, I will save greenhouse-gas emissions and I will reduce my carbon footprint – so suddenly there is an incentive to do so,” he explains.
When it comes to the GRAND project, Kotera says the plan is for the experiment to have simulation libraries that allow people to reuse commonly run simulations instead of producing their own, thereby preventing the same data from being reproduced again and again. According to Kotera this is common practice, even on large collaborations: different people repeatedly running identical simulations, because there is no central store. “It is so easy nowadays to just push a button and run a one-week simulation, get the result and then say ‘oh, I didn’t really need it’,” she says. “Our goal is to really encourage people to think ahead of running simulations whether this is something that they really need.”
Chemical synthesis is responsible for the significant emission of carbon dioxide worldwide. These emissions arise not only due to the energy requirements of chemical synthesis, but because hydrocarbon feedstocks can be overoxidized or used as hydrogen sources.
Using renewable electricity to drive chemical synthesis may provide a route to overcoming these challenges, enabling synthetic routes that operate at benign conditions and utilize sustainable inputs. We are developing an electrosynthetic toolkit in which distributed feedstocks, including carbon dioxide, dinitrogen, water and renewable electricity can be converted into diverse fuels, chemicals and materials.
In this presentation, we first share recent advances made in our laboratory on nitrogen fixation to synthesize ammonia at ambient conditions. Specifically, our lab has investigated a continuous lithium-mediated approach to ammonia synthesis and understood the reaction network that controls selectivity. We developed non-aqueous gas-diffusion electrodes, which lead to high rates of ammonia synthesis at ambient conditions. Then, we discuss how water can be used as a sustainable oxygen-atom source and how carbon dioxide can be used to achieve carbon chain extension.
These findings are discussed in the context of a broader range of electrosynthetic transformations that could lead to local and on-demand production of critical chemicals and materials.
Karthish Manthiram is a professor of chemistry and chemical engineering at the California Institute of Technology (Caltech). The Manthiram Lab focuses on the molecular engineering of electrocatalysts for the synthesis of organic molecules, including pharmaceuticals, fuels and commodity chemicals, using renewable feedstocks. Prof. Manthiram received his BS in chemical engineering from Stanford University in 2010 and his PhD in chemical engineering from the University of California, Berkeley, in 2015. After a one-year postdoc at Caltech, he joined the Massachusetts Institute of Technology (MIT) as assistant professor in 2017. In 2021, he joined Caltech as full professor of chemistry and chemical engineering. His research has been recognized with awards including the DOE Early Career Award; NSF CAREER Award; Sloan Research Fellowship; 3M Non-Tenured Faculty Award; American Institute of Chemical Engineers 35 Under 35; American Chemical Society PRF New Investigator Award; ECS San Francisco Section Daniel Cubicciotti Student Award; and Forbes 30 Under 30 in Science. Prof. Manthiram’s teaching has been recognized with the Camille Dreyfus Teacher-Scholar Award; C Michael Mohr Outstanding Undergraduate Teaching Award; MIT Chemical Engineering Outstanding Graduate Teaching Award; and MIT Teaching with Digital Technology Award. He serves on the Early Career Advisory Board for ACS Catalysis and on the Advisory Board for Trends in Chemistry.
Injecting aerosols into the stratosphere at 25 km altitude to mitigate global warming is not as cost efficient as injection at 20 km. That is the conclusion of scientists in the US, who have looked at five possible ways that the aerosols could be delivered to the stratosphere – including modifying a supersonic reconnaissance aircraft and firing “mortar shells” of material from a modified passenger jet aircraft.
Solar geoengineering offers a way of mitigating the effects of global warming by reflecting incoming sunlight back into space – thereby cooling the Earth. One way of doing this is to inject aerosols into the atmosphere. We know that this works because of the historical cooling that occurred after major volcanic eruptions, which injected vast amounts of material into the atmosphere.
The lower portion of the atmosphere (the troposphere) is turbulent with air moving up and down, so scientists believe that aerosols should be injected into the much calmer stratosphere at about 20 km or above. There, aerosols are expected to persist for a much longer time than they would in the troposphere.
In 2018 Wake Smith at Yale University and Gernot Wagner at Harvard University proposed the SAIL-1 system, which would use special large-winged aircraft to disperse aerosols at 20 km. To maintain a 1 °C cooling effect, this would cost about $43bn per year to operate.
Longer lasting
Studies have suggested that aerosols injected at about 25 km would persist for significantly longer – and therefore this could be a better strategy for solar geoengineering. This altitude, however, is right at the limit of advanced reconnaissance aircraft so getting the material up there in a safe and cost-effective way would be a major technological challenge.
Now, a team led by Smith has looked at five different ways of injecting aerosols at 25 km to see if the increased costs could be offset by higher performance. The first option is a rocket assisted version of SAIL-1; the second is a supersonic ballistic climber derived from the F-15C fighter jet; and the third is a two-stage mothership and rocket-powered drone that are modelled on Virgin Galactic technology. The fourth option is based on the Lockheed SR-71 Blackbird supersonic reconnaissance aircraft and the fifth involves using a Boeing 747–400 cruising at 12 km as a platform to hurl aerosol-containing mortar shells to 25 km.
For all five of these options, Smith and colleagues concluded that the cost of lofting a tonne of material to 25 km would be least three times that of SAIL-1 operating at 20 km. After considering the extra cooling that would be gained by reaching 25 km, the team found that none of the options is more cost effective than SAIL-1 at 20 km. The rocket-assisted SAIL-1 option was the cheapest, costing about $71bn per year to achieve a 1 °C cooling effect. The Boeing 474 mortar platform proved to be the most expensive option, costing nearly 20 times more than SAIL-1 at 20 km.
All the options would require fleets of aircraft numbering in the thousands, and each aircraft would fly one or more sorties per day. Given that the aircraft would be flying under extreme conditions, the safety of pilots and people on the ground is another important factor that was investigated by the researchers. They found that the two-stage mothership and rocket-powered drone had the lowest operational safety concerns of the 25 km options. They also point out that working prototypes of both the stages are already operational. As a result, the team describes this option as the “winning concept”, but only marginally.
Magnetic resonance imaging (MRI) is a central tool in the diagnosis and management of neurological conditions. The growing demand for head MRI exams, however, combined with a global shortage of radiologists, has produced year-on-year increases in the time taken to report scan findings. Delays in reporting can cause delays in treatment, resulting in poorer patient outcomes and increased healthcare costs. Backlogs arising from the global COVID-19 pandemic are likely to exacerbate the problem further.
A team headed up at King’s College London hopes that deep learning models could address this bottleneck. The researchers have developed a deep learning framework, based on convolutional neural networks (CNNs), that can identify abnormalities in MRI scans. They describe their approach in Medical Image Analysis.
“Our model can reduce reporting times for abnormal examinations by accurately flagging abnormalities at the time of imaging, thereby allowing radiology departments to prioritize limited resources into reporting these scans first,” says lead author David Wood in a press statement. “This would expedite intervention by the referring clinical team.”
Generating the training data
Deep learning methods, and CNNs in particular, show considerable promise for analysis of medical images. But such models require large and relevant datasets for training. To date, the development of a model for assessing head MRIs has been limited by the difficulty in obtaining large, clinically representative, accurately labelled datasets for model training.
In this latest study, the researchers used their transformer-based neuroradiology report classifier to categorize more than 70,000 head MRI exams from two large UK hospital networks as normal or abnormal, generating a labelled dataset for model training. This large dataset allowed the deep learning models to be trained on the full range of likely clinical abnormalities (such as vascular abnormalities, tumours, haemorrhage or stroke, for example), as well as different scanner vendors, imaging protocols and patient populations.
It’s also important that models are optimized for the types of head MRI scans routinely used in clinical examinations. As such, the researchers focused on abnormality detection using axial T2-weighted scans, which are the most commonly acquired sequence for detecting pathology in clinical settings worldwide.
The team trained and tested a number of CNN-based computer vision models on different subsets of the NLP-labelled data. In each case, the data were split into training (85%) and validation (15%) sets, with final model evaluation always performed on a test set of images with reference-standard labels assigned by neuroradiologists.
The models achieved fast (less than 5 s) and accurate classification from axial T2-weighted scans in all training and testing combinations. Noise-correction led to a small but statistically significant improvement in all cases. Importantly, models trained on scans from one hospital and tested on scans from the other showed minimal reduction in classification performance, suggesting that they are suitable for neuroradiology departments in general.
As a secondary goal, the team investigated the added value of using axial diffusion-weighted scans, which are also performed in many head MRI exams. A model trained and tested using all available scans achieved accurate classification using diffusion-weighted scans alone (although it performed worse than an axial T2-weighted model trained and tested on the same scans). However, an ensemble model that averaged the predictions of the two models provided a small improvement in classification.
Clinical impact
To quantify the impact that the classification model could have in a real clinical setting, the group performed a simulation study using out-patient MRI exams performed at the hospitals in 2018. They showed that the best model would reduce the mean wait times for reports for patients with abnormalities from 28 to 14 days, and from nine to five days, at the two hospital networks. This demonstrates the potential for using the model as an effective clinical triage tool.
Further easing clinical translation, the models are optimized for use with raw, clinical-grade scans. Avoiding image pre-processing enables faster classification and allows detection of abnormalities in other areas captured by the head MRI – such as diseases in the skull, and around the eyes and nose. The models also automatically provide slice-wise and voxel-wise visualization of the image regions that most influenced predictions, providing interpretability and enabling real-time review of triage decisions.
“Having previously built and validated a labelled head MRI dataset using cutting edge machine learning methodology through a team of data scientists and hospital radiologists, the same team has now built and validated a new machine learning model that can triage head MRI scans so the abnormal scans can be at the front of the queue for reporting,” says senior author Thomas Booth. “The potential benefit to patients and healthcare systems is enormous.”
The team is now running a UK-wide prospective clinical study to evaluate the efficacy of the tool in other institutions arounds the country. “This is an important step before we can consider applying this model in a real hospital setting,” Wood tells Physics World.
Last year, experimentalists at Harvard University in the US made an unexpected discovery: three layers of graphene are better than two at conducting electricity without resistance. At the time, the reasons for this unusual superconducting behaviour were unclear. Now, however, theorists in Austria and Israel have come up with an explanation that sheds more light on the origins of superconductivity in trilayer graphene, while also helping to explain other anomalies in recent experiments on this 2D carbon material.
Graphene is an atomically-thin sheet of carbon atoms arranged in a 2D hexagonal lattice. When two sheets of graphene are placed on top of each other and slightly misaligned, the positions of the atoms form a moiré pattern or “stretched” superlattice that dramatically changes the interactions between their electrons. The degree of misalignment is very important: in 2018, researchers at the Massachusetts Institute of Technology (MIT) discovered that at a “magic” angle of 1.1°, the material switches from being an insulator to a superconductor. The explanation for this is behaviour is that, as is the case for conventional superconductors, electrons with opposite spins pair up to form “Cooper pairs” that then move though the material without any resistance below a certain critical transition temperature Tc (in this case, 1.7 K).
Three years later, the Harvard experimentalists observed something similar happening in (rhombohedral) trilayer graphene, which they made by stacking three sheets of the material at small twist angles with opposite signs. In their work, the twist angle between the top and middle layer was 1.5° while that between the middle and bottom layer was -1.5°. By measuring the current that circulated through the layers when a voltage was applied to them, the researchers found that trilayer graphene remains superconducting at higher temperatures than is the case in two-layer graphene. Indeed, the measured Tc was about 40% higher, at 2.3 K. They also found evidence of something even more surprising: superconductivity in the trilayer system seemed to involve strong interactions between electrons, rather than weak ones as is the case in most conventional superconductors.
Natural allotrope of carbon
The bilayer and trilayer graphene materials in these studies must be constructed layer by layer, and their mechanical instability introduces certain complications for scientists seeking to explain their properties. For this reason, theorists led by Maksym Serbyn and Areg Ghazaryan from the Institute of Science and Technology (IST) Austria and Erez Berg and Tobias Holder from Israel’s Weizmann Institute of Science chose instead to study superconductivity in crystalline rhombohedral trilayer graphene. Although rare, this allotrope of carbon does occur naturally, and is mechanically stable.
In this material, the researchers identified two further phenomena that they say are difficult to reconcile with conventional superconductivity. The first, Ghazaryan explains, is that above a threshold temperature of about 13 K, the electrical resistance of the material should increase linearly with increasing temperature. However, previous experimental work found that the rate of increase remained constant up to 23 K.
The second phenomenon is that pairing between electrons of opposite spin implies a coupling that contradicts another experimentally observed feature: the presence of a nearby configuration in which the spins are fully aligned – that is, magnetism. “In our work, we show that both these observations can be explained if one assumes that an interaction between electrons provides the ‘glue’ that holds electrons together,” Serbyn adds. “This leads to unconventional superconductivity.”
The theorists also found that the material has two so-called Fermi surfaces (the boundary between occupied and unoccupied electron energy states that defines many of properties of metals and semiconductors) with a circular shape. According to a theory from the 1960s, such circular surfaces favour a mechanism for superconductivity based only on electron interactions.
Air pollution in India is reducing the energy output of some solar panels by as much as 52%. That is the conclusion of researchers who have modelled the effects of particulate pollution on solar irradiance from 2001–2018. Sagnik Dey, Dilip Ganguly and colleagues at the Centre for Atmospheric Sciences at the Indian Institute of Technology–Delhi calculate that the successful implementation of India’s National Clean Air Programme would allow the country to generate an extra 6–16 TWh of solar electricity every year.
Solar energy is playing a crucial role in India’s transition to renewable energy. Having abundant insolation, the country was ranked fifth in the world for solar energy capacity in 2020. However, parts of India suffer from high and growing levels of particulate air pollution, which reduces the capacity of solar panels in two ways. First, particulates in the air block sunlight, reducing the amount that reaches panels in a process called atmospheric attenuation. Second, particulates build up on the surfaces of panels, blocking sunlight in what is called the soiling effect.
In their latest research, Dey, Ganguly and colleagues modelled how atmospheric attenuation and soiling affected India’s solar-energy output between 2001 and 2018. Their analysis of soiling considered both particulate deposition on panels and how this dirt is washed away by rain.
Satellite data
The team used data from NASA’s satellite-borne Clouds and the Earth’s Radiant Energy System (CERES) instruments to work out the solar irradiance of India and the country’s five power grids. This was verified by using ground-based observations and other relevant data sets.
The effect of aerosols on light reaching the ground was calculated using data from NASA’s Moderate Resolution Imaging Spectroradiometer (MODIS). This was used to work out the concentrations of fine particulate matter smaller than 2.5 microns in the air over India.
The team found that the impact of attenuation and soiling was greatest in the region of India’s eastern power grid, with 16% less sunlight reaching horizontal solar panels during the period 2001–2018. The northern and western grids suffered 12% losses each on horizontal panels, while sunlight falling on the southern and north-eastern grids was reduced by 10% and 11% respectively. The impact was much higher on panels that are tilted or track the position of the Sun. Indeed, the team calculated that dual-axis tracking panels in the eastern grid suffered a 52% reduction in sunlight from pollution.
Dual-axis losses
In terms of overall loss of electricity generation for all of India, there was a reduction of 12% for horizontal panels and 41% for dual-axis panels. The team calculated that this loss of capacity translates into hundreds of millions of dollars annually.
The team concludes that there would be significant benefits to solar energy generation with the successful implementation of India’s National Clean Air Programme. This aims to reduce aerosol pollution by 20–30% (compared to 2017 levels) by 2024. They also point out that aerosol pollution is linked to increased cloud cover, so the gains from clean air could be even bigger.
The fundamental conundrum for junior scientists after graduating is whether to move into industry or continue in academia. I have worked on both sides of this divide. After completing my Master’s degree in physics at Southampton University, I went to Cardiff University to do a PhD on novel types of vertical-cavity surface-emitting lasers. I then did a postdoc at Heriot-Watt University in Edinburgh, and at the University of St Andrews, where I worked on single-photon laser diodes and how they can be applied to quantum information technologies.
In 2017 I switched to industry and became a quantitative analyst at Moody’s Analytics, a financial-services and risk-assessment company that does research and creates tools for corporate clients. While there, I used my strong mathematical and programming skills to do research in applied finance. After working in industry for three years, I then went back to fundamental science, becoming a senior researcher in quantum computing at the University of Oxford. Last year I moved to Brookhaven National Laboratory in the US, where I currently work as a quantum scientist.
So what are the main differences between academia and industry? In my experience they centre on four major aspects of working life: preferred working style, management, balance between work and family life, and the actual tasks involved in a job. Any career decision is ultimately your own, but I hope my perspective helps you to make a well-informed choice for your career.
The main differences between academia and industry include preferred working style, management, balance between work and family, and the actual tasks involved in the job
Preferred style of work: individual or teamwork
If you are more team-oriented, industry might be a better choice for you. It depends on the company culture, but in industry you are likely to be part of a team collaborating on a project. If you are involved in interdisciplinary projects, as I was, you will be working with colleagues who have expertise in a broad range of areas.
During my time in finance, it was a bare-minimum requirement to have an economist, a physicist and programmers on a team when tackling complex problems in modelling financial markets. A huge benefit for me was that I learned from all these professionals with different backgrounds, who each brought unique skills to the table. For instance, I learned how to do risk modelling while working in teams like this.
In academia, in contrast, group dynamics vary depending on the principal investigator, but in physics and maths there is usually a strong emphasis on individual work. This means you are driving your own research, hopefully given the space and resources you need to grow. I did my PhD and postdoc very much independently and my achievements reflect my determination and hard work. However, this emphasis on individual work creates a highly competitive environment, which I do not think is beneficial for the development of young researchers.
I feel that close collaborations and interactions with colleagues are hugely beneficial, especially during the early stages of your career. That’s when it’s important to learn not only practical knowledge but also soft skills like communication and management. Consequently, the higher level of guidance and feedback that you get in industry makes it easier for you to learn and improve on the job.
Management
Another feature of industry is that there is more structure and risk mitigation, with product managers ensuring that solutions are delivered to clients on schedule. In my case, I was responsible for developing and implementing financial modelling tools, among other tasks. My projects had specific resources assigned to them and concrete deadlines that needed to be met. Although the work was clearly structured, it was not always easy, and there were times when extended team efforts were required.
(Courtesy: iStock/cagkansayin)
Working in academia tends to be much more ad-hoc, with flexibility to choose what you work on and when. This arrangement can be great, especially for people with strong focus and time-management skills, and it suits me. However, it might not be ideal for everyone, and it takes time to adapt. You might find yourself overwhelmed by passing time with scarce results.
Although some risks are considered and mitigation measures taken in academic research, this is not done as rigorously as in industry. The chances of bottlenecks, especially for collaborative projects, are therefore higher in academia.
Balance of work and family life
One big benefit of industry is that the working environment is more accommodating for employees with families than it is in academia. With companies offering generous benefits to attract top talent, it is easier to find the stability and resources required to support family life. There also tends to be more social interaction with colleagues from various backgrounds who often happily share their own experiences and advice. More generally, there is usually much more going on outside of work too, such as charity events or after-work get-togethers, all of which contribute to a healthy work environment.
Academia lags behind when it comes to supporting employees with families. There are various initiatives aiming to address this. Athena Swan, for example, is a charter and accreditation scheme that makes recommendations on how academic departments can improve gender equality and gives awards to recognize and encourage efforts in this area.
I was a member of the Athena Swan committee at both Heriot-Watt and Oxford, and our efforts were aimed at introducing more benefits for working parents, such as adopting shared parental leave. However, in my opinion, these initiatives do not reach far enough and are slow to keep up with evolving needs.
This is especially visible in science, technology, engineering and maths (STEM) departments where it is very rare to hear of a colleague taking maternity leave. I believe that the limited support available for parents and the prevalence of short-term contracts in academia contribute to the low retention rate of female academics in STEM fields.
Tasks involved
The final major point to consider when deciding whether to move into industry or stay in academia is the actual work you will be doing. Industry is product-oriented, so you will see your idea develop from the whiteboard through to implementation, and even receive feedback from users. While working at Moody’s Analytics, for example, I was involved in projects developing client-oriented software solutions for use by financial institutions. My colleagues and I did write reports and papers about our research, just as we would in academia, but these documents were for internal purposes only to protect the company’s intellectual property.
This product-development cycle is rarely present in academia, where the projects are usually on prototype-stage ideas or even completely blue-skies research. The focus on very detailed tasks can certainly be intellectually stimulating, but it can also leave you longing to work on something more applied and immediately useful. Having said that, current graduates have much broader career options compared with what was available to me and my peers when I graduated almost 15 years ago. This is because quantum research has become much more mature and product-driven in recent years.
In the end, the choice of which path to take depends on what type of work and professional environment you will personally find satisfying. What is most important is that you make yourself aware of these differences, so you can find a job and workplace that is right for you.