
Imaging innovation sharpens the view for radiotherapy clinics

Rapid advances in imaging techniques based on computed tomography (CT) have underpinned a revolution in treating cancer patients using radiotherapy. An X-ray scan lasting just a few seconds yields an accurate 3D visualization of the patient’s internal anatomy, and delivers the critical information needed by medical physicists to calculate the optimal dose distribution for treating the tumour. Ongoing advances in CT technologies have enabled clinical teams to access higher quality images that have enabled more precise targeting of the tumour while minimizing the damage to healthy organs and tissues.

However, conventional CT images can sometimes lack the contrast needed to clearly distinguish between different types of soft tissue. That makes it difficult for radiation oncologists to precisely define the size and shape of the tumour, and to contour the nearby organs, tissues and blood vessels that need to be protected from ionizing radiation. Another notable limitation of the standard CT scans conventionally used in radiotherapy departments is that they only provide anatomical information, and so are unable to reveal functional processes that might provide some additional insight for treatment planning.

For cases that require enhanced soft-tissue contrast or functional information, CT is often combined with other imaging modalities such as magnetic resonance imaging (MRI) or positron emission tomography (PET). While Siemens Healthineers offers MRI and PET solutions that have been optimized for radiotherapy and for imaging patients in the intended treatment position, in some situations such complementary imaging methods may not be available. For making clinical decisions, particularly when critical organs are at risk – such as in the head-and-neck region, chest or the abdomen – improved soft-tissue contrast is crucial.

Now, however, a novel method that can improve the quality of CT images is starting to make a difference in radiotherapy clinics. Called dual-energy CT, or DECT, the technique acquires CT images from two different X-ray spectra rather than one. Conventional CT captures images using a single X-ray beam, which has a spectrum of photon energies with an average of around 70 keV and a typical peak energy of 120 keV. The image contrast of each material depends on how well it attenuates X-rays, which in turn depends on energy.

“At standard CT energies, most of the soft tissue we’re trying to image has very similar attenuation coefficients,” explains Jainil Shah, a research professional and R&D collaboration scientist at Siemens Healthineers. “That means that most of the organs look very similar when they are visualized on a CT image.”

Routes to dual-energy CT in radiotherapy 

DECT mitigates this problem by generating images from X-ray scans taken over two different energy ranges. Since the first experiments that showed the potential of dual-energy CT in the 1970s, several different approaches have emerged for acquiring DECT images – and each one has its advantages and disadvantages. The simplest way is to scan the patient twice at two different energies, a technique known as “Dual Spiral” or “Twin Spiral”. Such consecutive scanning can offer excellent image contrast, since it allows for a wide separation between the two spectra. Because any movements of the patient between the two scans can introduce errors, a non-rigid image registration between the two images is performed automatically during post-processing to account for and compensate for any changes in position. “That makes Dual Spiral DECT most suitable for non-moving regions such as the brain and the head and-neck,” comments Shah.

Other techniques capture the two spectra simultaneously, recording all the information in a single scan and limiting the patient’s exposure to X-ray radiation. One option offered by Siemens Healthineers is to split the X-ray beam using a filter in the scan direction, creating two separate beams with different average energies. Such TwinBeam technology offers a wide field-of-view, but the use of a filter limits the spectral separation and therefore the image contrast that can be achieved.

The third option available from Siemens Healthineers is a CT scanner that exploits two X-ray sources operating at different energies, each one coupled to its own detector. This Dual Source approach offers better spectral separation than TwinBeam technology, and therefore sharper images for treatment planning, as well as more X-ray power in each of the separate beams. The field-of-view is slightly smaller because the equipment needs to accommodate two separate X-ray tubes, which needs to be considered when imaging larger regions of the body.

These DECT systems are already routinely used in radiology clinics for diagnostic imaging, while ongoing improvements to the scanners and the software have made it much easier for radiotherapy centres to integrate the technique into their clinical workflow. “The scan can be acquired by any technician in the clinic, and all the information needed by the radiation oncologist is generated automatically,” explains Shah. “Clinical workflows can be set up in the software to automatically perform additional post-processing and image reconstruction from a single scan.”

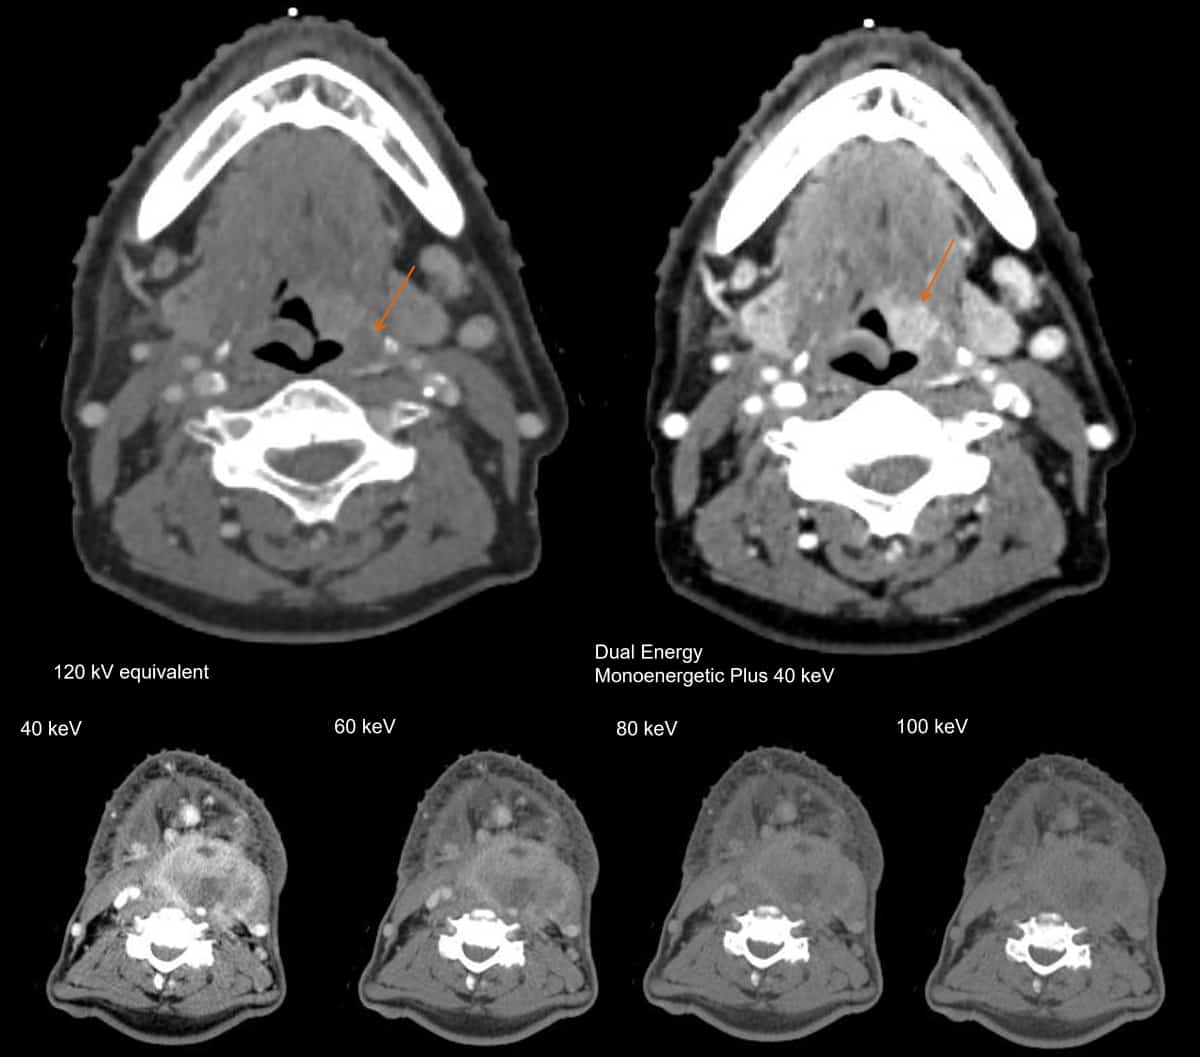
Capturing X-ray spectra with two different energy distributions makes it possible to reconstruct an image at any single energy. This yields a series of virtual monoenergetic images (VMIs), also called Monoenergetic Plus – at energies ranging from around 40 keV up to 190 keV – that can be used to optimize the soft-tissue contrast. “The energy can be easily changed with a slider bar in the software,” explains Shah. “The radiation oncologist can decide which energy provides the best contrast for contouring organs.”

Virtual monoenergetic images

Shah says that dual-energy CT is also able to provide some functional information about dynamic processes inside the body, such as perfusion within the lungs or the uptake of iodine in different organs and blood vessels. As an example, capturing X-ray spectra over two different energy ranges makes it possible to determine the material composition, since the attenuation of X-rays in each material is dependent on energy.

“That means you can do things like remove bone from the image, or distinguish between fat and liver tissue,” says Shah. “From the material composition you can predict the electron density of the material (Rho image), which is the key information that is used for dose calculations in radiation therapy.” For proton therapy, meanwhile, Siemens Healthineers offers a specific reconstruction called “DirectSPR” that calculates the stopping-power ratio from dual-energy CT.

Into the clinic 

Ongoing advances in technology and software are now enabling medical teams to integrate dual-energy CT into their clinical practice.

Beth Bradshaw Ghavidel, Emory University, USA – DECT for head-and-neck patients 

Beth Bradshaw Ghavidel, one of the lead medical physicists at Emory University, says that TwinBeam DECT is primarily used for head-and-neck patients, in which VMIs at higher energies can help to remove the artefacts that arise from metal objects inside the body, such as dental fillings (DECT is compatible with iterative metal artefact reconstruction, iMAR). “It is easy to set up the desired dual-energy CT workflows on the scanner and allow automatic post processing,” says Bradshaw Ghavidel. “Depending on what CT scans are needed, the dosimetrist can select specific studies for import. At this time, we have not needed to alter our clinical workflow for additional imaging studies.”

Lili Chen, Fox Chase Cancer Center, USA – DECT for intracranial target delineation and rectal tumours 

Lili Chen at Fox Chase Cancer Center has also been exploring the potential of dual-energy CT to boost the image quality for different disease sites. When imaging the head and neck, she found – like Bradshaw Ghavidel – that a VMI at 190 keV offers an effective way to reduce the artefacts caused by dental fillings and iodine uptake in the soft palate. Chen has also compared DECT images of brain tumours in 34 different patients with those taken with MRI. When an iodine contrast agent was used, she found that a VMI at 40 keV can reveal metastases in the brain that are not detected by conventional CT, or by VMIs at higher energies. What’s more, in this research study the brain tumour volume derived from the 40 keV DECT image was comparable to that obtained from MRI.

Brain image comparisons

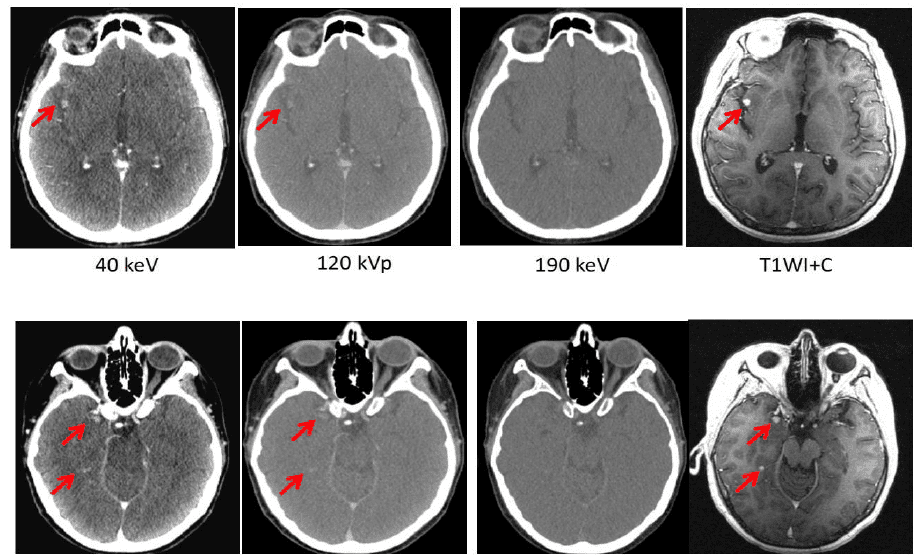
“Meaningful clinical differences were found on CT images with contrast, with the 40 keV image delineating the tumour much more clearly than images taken at other energies,” Chen comments. “Our results suggest that dual-energy CT with contrast may be used for intracranial target delineation in radiotherapy treatment planning.” Analysis of a rectal tumour also revealed obvious differences between images taken at different energies, with the one taken at 40 keV clearly showing the necrotic area of the tumour and indicating that cancerous cells had spread to the adjacent seminal vessels.

Xiaofeng Yang, Emory University Hospital – DECT image contrast for contouring head-and-neck cases

Also at Emory University, Xiaofeng Yang has been working with Bradshaw Ghavidel and other colleagues to investigate whether dual-energy CT can improve the precision of a deep-learning model they have developed for automatic organ segmentation. In a recent research study, they designed a neural network that exploits DECT data to automatically segment 19 organs-at-risk in the head and neck, and trained the model using manual contours produced for 66 patients with carcinomas in different disease sites. Automatic contours generated with the DECT-based model were then compared to manual contours produced by a physician, as well as to those obtained using the same model developed at Emory University Hospital with conventional CT data. “DECT-based segmentation of organs-at-risk has the potential to facilitate the current head-and-neck cancer radiation therapy workflow in treatment planning,” concludes Yang.

George Noid, Medical College Wisconsin (MCW), USA – DECT in clinical routine and for tracking the effect of treatment 

George Noid, a medical physicist at MCW, says that dual-energy CT is now in routine clinical use for almost all cancer patients, particularly those needing treatment in the abdomen or chest. “We use the VMI reconstructions to enhance the image contrast,” he says. “As well as abdominal and thoracic patients, we’ve found it really useful for pre-operative breast cancer and other rare disease sites in the abdomen, such as the adrenal glands.”

One particularly gnarly problem that Noid hopes to address in the future is to improve the images used to plan the treatment of pancreatic cancer. “We want to deliver as much radiation as possible to the pancreatic head, but the major limiting factor is the amount of radiation that we can deliver to the adjacent duodenum,” he explains. “That makes it clinically important to accurately define the edge between the pancreatic head and the duodenum.” In a recent research study, Noid and colleagues compared conventional CT data with dual-energy CT scans of 10 patients being treated for pancreatic cancer, and in each case the image contrast was enhanced by injecting iodine-based contrast media into the patient before the scan. They found that the image contrast was boosted by a factor of 2.8 for the VMI at the lowest possible energy of 40 keV, while another important indicator of image quality, the contrast-to-noise ratio, was also maximized at this energy. Images from other treatment sites, including the liver, breast and thymus, also showed that the tumours were more clearly visible at 40 keV than at higher energies.

Noid is also investigating whether quantitative data extracted from dual-energy CT images could be used as an indicator of how well a patient is responding to treatment. “It has been shown that the aggressiveness of pancreatic cancer is correlated to the extracellular volume (ECV) fraction, which can be calculated from a DECT scan,” he explains. In a recent research study, which won the Best in Physics award at AAPM 2021, Noid and colleagues used DECT images acquired at weekly treatment sessions to calculate the ECV fraction. For 12 pancreatic cancer patients, the study revealed a correlation between the ECV fraction and the concentration of a cancer antigen found in the blood, suggesting that regular DECT scanning could be used to track the effect of treatment. “That offers the potential of stratifying your patient’s risks based on calculations of the ECV fraction,” Noid explains. “That information could help to drive your clinical decisions, such as giving a higher dose to a patient who has a more aggressive disease. We are not yet using that in our clinical workflow, but that’s the idea.”

Noid is confident that DECT has the potential to deliver more quantitative data that in the future could be used to analyse the properties of the tumour. “Unlocking that information would be clinically very useful,” he says. “We’re starting to see that DECT has the power to access that functional information, and I think there’s much more we can do.”

Note that the results by Siemens Healthineers’ customers described herein are based on results that were achieved in the customers’ unique setting. Since there is no “typical” hospital and many variables exist (eg. hospital size, case mix, level of IT adoption) there can be no guarantee that other customers will achieve the same results.

End-to-end patient specific QA with RadCalc – why it is important to stay up to date

Want to learn more on this subject?

In this webinar, we will be covering the new features released in the latest version of RadCalc (7.2.2). These include new workflow features for intelligent automation with Eclipse Scripting and RadCalcAIR that delivers your report in Aria with a single click of the script within the Eclipse TPS. We will also be introducing LAP Academy.

Learn how you can evaluate the treatment performance of your patient’s full course of treatment automatically with the implementation of our Treatment Performance Profiles. This TPP provides a single click method for computing your EPID dosimetry plan dose. We will also give a sneak preview on what we are working on for the next release.

Also, we would like to address a valuable topic: the importance of reviewing change logs and upgrading as new versions are released to ensure the highest safety and quality in the intended patient plans. We will discuss a recent example and our ability to quickly fix our unique plan comparison tool.

Want to learn more on this subject?

Carlos Bohorquez

Carlos Bohorquez, MS, DABR, is the product manager for RadCalc at LifeLine Software, Inc, part of the LAP Group. An experienced board-certified clinical physicist with a proven history of working in the clinic and medical device industry, Carlos’ passion for clinical quality assurance is demonstrated in the research and development of RadCalc into the future.

Liquid metal, ruby and sapphire could rain down on huge exoplanet

Liquid metal, ruby and sapphire could rain down on one hemisphere of a blisteringly hot giant exoplanet that is tidally locked in a tight orbit around its star. That is the conclusion of astronomers who have developed a detailed 3D model of the atmosphere of WASP-121b, which is a “hot Jupiter” that is about 850 light-years from Earth. Their study also reveals how water and metal is transported between the exoplanet’s hot and cold sides.

The team from the Massachusetts Institute of Technology observed WASP-121b using a spectroscopic camera aboard NASA’s Hubble Space Telescope. The exoplanet is slightly more massive than Jupiter and it is so close to its host star that it completes an orbit in just 30 h, one of the shortest orbits ever detected by astronomers.

The team studied both the night side of the exoplanet – which always faces away from the star – and its blistering hot day side, which always faces the star. Their observations allowed them to model the atmosphere of the gas giant exoplanet. What is more, the team is the first to track the water cycle on a planet outside of the solar system.  The study reveals conditions so extreme that the hot Jupiter’s night side could experience rains of liquid metal, ruby and sapphire.

“Just measuring the day side temperature of an exoplanet yields an incomplete picture of the global climate on the planet. Understanding the night side fills in this knowledge gap,” team member Tansu Daylan tells Physics World. He adds that the team measured the spectrum of the exoplanet at all viewing angles, not just its dark side, and then inferred a temperature map.

Raining metal

The exoplanet’s proximity to its star and the fact that it is tidally locked results in extreme conditions, with temperatures as high as 3500 K on the day side. This is hot enough to vapourize metals. Daylan adds that previous studies have indicated the presence of metals in the day side atmosphere. This means that metal clouds would be blown across the night-side hemisphere by winds on the planet in excess of 18,000 km/h.

“Our new data gave us direct evidence for these winds because the hottest region of the day side atmosphere was slightly to the east of the ‘noon’ point right underneath the star,” says Thomas Mikal-Evans, who led the research. “This means that the gas must be getting heated up at noon but then getting blown eastwards before it has a chance to re-emit thermal radiation to space.”

Now based at the Max Planck Institute for Astronomy, Mikal-Evans, says that before the team’s study, astronomers had made unusual observations of the transition line between the day and night sides of WASP-121b – a region known as the day-night terminator of the atmosphere.

“Previous observations showed that titanium was missing from the atmosphere, but its chemical cousin vanadium was present in the atmosphere, Mikal-Evans adds. “Since these two atoms are chemically similar, it seemed odd that we’d observe one but not the other.”

Mikal-Evans adds, “Our new data reveal for the first time that the temperatures on the night side hemisphere drop low enough for titanium and aluminium gas to precipitate and rain down to deeper layers of the atmosphere, whereas vanadium precipitates at lower temperatures making it harder for it to rain out.”

The fact that the temperature drops low enough for titanium and aluminium rain on the night side, combined with the absence of these metals in the gas phase at the day-night terminator, allows the team to conclude that titanium and aluminium are indeed raining down on the night side.

Droplets of ruby and sapphire

He adds that aluminium would probably condense in the form of corundum, which is an aluminium oxide. When traces of elements like chromium, iron, and titanium are included in corundum, it becomes the gems ruby and sapphire. “So, it could be raining droplets of ruby and sapphire on the nightside hemisphere.”

The team also found that WASP-121b’s powerful winds sustain a water cycle by moving water from the day side to the night side of the gas giant.

Not surprisingly, the exoplanet’s water cycle is far more dramatic and violent than that of Earth’s. Mikal-Evans describes it as “a giant conveyor belt” shipping molecules between the vastly different hemispheres of WASP-121b.

Molecules ripped apart

“We were able to observe that most of the water molecules get ripped apart on the day side because it’s so hot, while those that survive deeper in the atmosphere are glowing strongly at infrared wavelengths,” says Mikal-Evans. “The hydrogen and oxygen atoms from the disrupted water molecules then get blown around to the night side hemisphere, where the lower temperatures allow them to recombine to form water vapour once more before they are blown back around to the dayside hemisphere to repeat the cycle.”

The team has booked time on the new James Webb Space Telescope to study WASP-121b in even greater detail. They plan to observe changes in not just water vapour but also carbon monoxide, which is believed to be in the exoplanet’s atmosphere.

“As our technology continues to improve, one day we can hope to do something similar for planets that more closely resemble our own Earth,” Mikal-Evans concludes. “We’re still just taking the first steps down this long and challenging path  –  but we’re certainly on our way!”

The research is described in Nature Astronomy.

Physics equations compete for your approval, exoplanets that never were

What is your favourite physics equation and how well would it stand up in the court of public opinion to other equations? That pressing question could soon be answered by the Perimeter Institute for Theoretical Physics (PI) in Canada, which has been running a single-elimination tournament that pits famous physics equations against each other. The winners and losers are decided by you, the public.

Modelled on the March Madness US college basketball extravaganza, the tournament started on Monday with 16 equations, which will be winnowed down to a field of eight by the end of this week. Today, you can choose your favourites in two matches. The first sets the second law of thermodynamics against Newton’s law of universal gravitation; and the second puts Maxwell’s equations up against Hamilton’s equations.

If you have missed voting in the first round, don’t despair. Next week the PI is running the quarter finals – which already has a battle royale set between Schrödinger’s equation and the uncertainty principle.

Closer look

A few weeks ago I wrote about a black hole that never was, and this week’s astronomy snippet is about four exoplanets that never were. Prajwal Niraula of the Massachusetts Institute of Technology and colleagues have taken a closer look at some of the thousands of exoplanets that have been discovered in the past 30 years. They have concluded that three (or maybe four) of these objects are probably not exoplanets after all.

Using updated observations, the team reckon that three of the objects – Kepler-854b, Kepler-840b, and Kepler-699b – are bigger than previously thought.  The new analysis suggests that the objects are between two and four times the radius of Jupiter – and the team says that this is too big for them to be exoplanets.

The fourth suspect exoplanet is called Kepler-747b and is estimated to be about 1.8 times Jupiter’s radius. While this is on par with the largest confirmed exoplanets, Kepler-747b is relatively far from its star and this means that amount of light it receives is too small to sustain a planet of that size. As a result, the team says that it is doubtful that Kepler-747b is an exoplanet – but not impossible.

So, what are these objects? The team reckons that they are probably small stars that are orbiting larger companions. The team reports its results in the Astronomical Journal.

Russia’s invasion of Ukraine: the chilling impact on science

The world has been shocked by Russia’s invasion of Ukraine – but no-one ought to have been surprised. Under president Vladimir Putin, Russia had already invaded the country in 2014 – annexing the Crimean peninsula – and supported Russian separatist forces in the Donbass region. Early last year it also started massing troops on the Ukrainian border. If anyone was in any doubt, Putin spelled out his intentions last July in a 5000-word essay, claiming that Russia had been “robbed” of lands in Ukraine.  

Quite rightly, the invasion brought immediate indignation from the international scientific community.

Statements condemning it were released by the likes of the American Physical Society, the Institute of Physics and the European Physical Society. Conferences and meetings due to take place in Russia were swiftly cancelled. Space missions and launches involving Russia were delayed or postponed, with ExoMars being the latest craft to be put on hold. Letters of opposition were released, including one signed by more than 200 Nobel prize winners calling for Putin to recall his armed forces.

The letter’s withdrawal was a chilling reminder of what Russia’s political climate has become.

Most striking was a letter signed by more than 2500 staff and students from the Moscow Institute of Physics and Technology (MIPT). Stating that the MIPT could surely “not support this senseless and outrageous war”, the signatories hoped their letter would encourage other universities in Russia to condemn their country’s leaders too.

But with a new law threatening 15-year prison sentences for anyone discrediting the Russian military, the letter’s organizers swiftly deleted it, fearing the safety of its signatories.

The letter’s withdrawal was a chilling reminder of what Russia’s political climate has become. Amid all the rightful condemnation of the invasion, we should not forget that there are many ordinary Russian physicists, like the signatories of the MIPT letter, who are appalled by the war. They will only face further difficulties as international sanctions start to bite. 

Life is harder still for physicists in Ukraine, who find themselves caught in a humanitarian crisis not of their making and having to flee centres of attack. They also face the danger of military strikes on their country’s civilian nuclear-power plants and the potential for Russia, which has a huge arsenal of nuclear weapons, to engage in nuclear attacks. One physicist in Ukraine – Vasyl Kladko – was even shot dead by Russian forces last month.

Life is harder still for physicists in Ukraine, who find themselves caught in a humanitarian crisis not of their making and having to flee centres of attack.

These are tough times for those who see science as a force for peace. The CERN particle-physics lab struck the right balance by suspending Russia’s “observer” status while standing behind Russian scientists at the lab.

All eyes will now be on ITER, which is building a fusion reactor in France. The project was forged at the tail-end of the Cold War to let Russian and western scientists collaborate for the wider good of humanity. Those principles are now being put fully to the test.

Incredible ionogel is ultra-tough and super-stretchy

A technique for making ionogels that are both ultra-tough and ultra-stretchy has been developed by scientists at North Carolina State University in the US. Their novel one-step process can be used to create ionogels with a range of useful properties.

Ionogels are polymeric networks that are swollen with ionic liquids. They are somewhat similar to hydrogels, which are swollen with water and have a number of applications including contact lenses, hygiene products and wound dressings. Ionogels have garnered tremendous interest amongst researchers because of their non-volatility, high thermal and electrochemical stability, and excellent ionic conductivity. However, most ionogels made so far have undesirable mechanical properties, such as low fracture strength (less than 1 MPa), poor toughness (about 1000 J/m), and low Young’s modulus (less than 0.1 MPa).

To tackle these shortcomings, a team led by Michael Dickey at North Carolina State University developed a simple and straightforward one-step method to produce a highly stretchable, stiff and ultra-tough ionogel. This is done by randomly copolymerizing two monomers using UV light in the presence of a ionic liquid.

The two monomers first used by the team  were acrylamide – which is used in contact lenses – and acrylic acid, which is used in baby’s diapers. The simple process involves mixing the two monomers, placing them in an ionic liquid and then shining UV light on the sample. This creates a copolymer that is a mixture of two phases: a polymer-rich phase that toughens the ionogel and an elastic solvent-rich phase, which enables the material to undergo enormous strain.

Pick your ingredient

Meixiang Wang – a postdoctoral researcher at North Carolina State and first author on a paper describing the work – along with her colleagues also explored the generality of their method by using a variety of monomers and ionic liquid combinations. They found that their one-step method could be used with pairs of monomers that form polymers with different solubility during copolymerization. This offers a promising way for producing ionogels with tunable microstructures and distinct mechanical, electrical and optical properties.

The team used their technique to create tough ionogels with high fracture strengths of 12.6 MPa, fracture energies of 24 kJ/m, Young’s moduli of 46.5 MPa, and stretchability of about 600% strain. These properties are comparable to natural rubber and cartilage.

We’re excited that we’ve made something with truly remarkable properties that can be made very easily – you just shine a light on it – using widely available polymers,” says Dickey, “and you can tailor the properties of the ionogels by controlling the ratio of ingredients during the copolymerization process”.

Unique combination

Existing ionogels rarely possess multifunctional properties. However, the team was able to create ionogels with good self-recovery, excellent self-healing and outstanding shape-memory properties. This is possible because copolymer ionogels change their behaviour with temperature.

One important benefit of the photopolymerization process is that it could be used for 3D printing the ionogels to arbitrary shapes and sizes. Wall thickness as low as 100 micron could be achieved using a stereolithography-based printing technique.

The team’s process bodes well for commercialization because unprecedented mechanical properties such as very high stiffness, toughness and stretchability, combined with self-recovery, self-healing and shape-memory properties, open up a wide array of new applications, including shock-absorbing materials for use in running shoes.

“The next step is to commercialize this technology. We’re already working with one industry partner and are open to working with others to develop applications for this new breed of ionogels,” says Dickey.

The team describes their process in this video and in a paper published Nature Materials.

Melanin-targeted PET probe tracks down malignant melanoma lesions

In its first clinical trial, a novel PET radiotracer developed in China outperformed the traditional 18F-FDG tracer in identifying primary malignant melanoma and nodal metastases. The new PET probe – 18F-PFPN – detected 365 metastases that were missed in 18F-FDG PET imaging. Investigations in healthy volunteers also confirmed that the new PET tracer is safe and well tolerated.

Currently, 18F-FDG PET is used to stage patients with advanced malignant melanoma and to monitor the effects of cancer treatments. 18F-FDG PET, however, lacks the sensitivity to diagnose early-stage disease and is unable to identify small metastases (less than 1 cm) to the lung, liver and brain.

The new radiotracer is designed to target melanin, which exists in most melanomas. Principal investigator Xiaoli Lan, from Union Hospital, Tongji Medical College of Huazhong University of Science and Technology, explains that the 18F-PFPN tracer was based on a melanin-targeted nicotinamide probe (18F-FPN) that the researchers had previously developed, optimized to have a higher tumour-to-normal liver ratio and radiochemical yield. It is characterized by negligible accumulation in the liver and rapid renal clearance, enabling its safe use in clinical imaging studies.

Safety assessment

Lan and colleagues initially investigated the biodistribution, pharmacokinetics, radiation dosimetry and safety of 18F-PFPN in five healthy volunteers. The tracer was safe and well-tolerated; none of the volunteers exhibited any changes in vital signs or experienced adverse reactions to the tracer.

The researchers performed serial whole-body PET scans on the volunteers 30, 60, 120 and 240 min after injection of 18F-PFPN, and calculated the tracer uptake in the gallbladder, urinary bladder, stomach and liver at each time point. To investigate the tracer pharmacokinetics, they determined the radioactive counts of blood, plasma and urine samples at different time points, observing a rapid renal clearance. The bladder wall showed the highest dose activity, followed by the kidneys. The total effective dose was 2.01 × 10⁻² mSv/MBq.

Follow-up exams did not reveal any abnormal changes in liver and kidney function and none of the volunteers reported any subsequent problems.

Tracer comparison in patients

The team also examined nine patients with suspected malignant melanoma and 12 with confirmed malignant melanoma. All patients received both 18F-FDG and 18F-PFPN PET scans, spanning the brain down to the bottom of the foot. The resulting images were interpreted by two experienced nuclear medicine specialists. For patient-based analysis, they identified either the primary tumour or the single lesion showing the highest tracer uptake at each metastatic site. For each site, the experts also conducted lesion-based analysis, either on all lesions (for up to 10) or on the 10 with the highest tracer uptake.

Lesion detection

In the patient-based analysis, both types of tracer identified all eight primary tumours and performed similarly with all types of metastases, with 18F-FDG images identifying 35 metastases and 18F-PFPN images identifying 39. The team note that 18F-PFPN uptake was higher than 18F-FDG for both primary tumours and nodal metastases.

In the lesion-based analysis, 18F-PFPN significantly outperformed 18F-FDG, identifying 100% of all lesions. Specifically, 18F-PFPN identified 394 bone metastases compared with 18F-FDG’s 151 (100% versus 38.32%); 141 liver metastases compared with 49 (100% versus 34.75%); 124 lymph node metastases compared with 98 (100% versus 79.03%); and 33 metastases to other sites compared with 29 (100% vs 87.88%). In total, 18F-PFPN PET detected 365 metastases that were missed when using 18F-FDG PET.

The team also applied a visual scoring system based on the number of lesions identified in each patient. Here, 18F-PFPN also outperformed 18F-FDG for detection of distant metastases to the liver, bone, lymph nodes and other distant sites.

“We found that 18F-PFPN PET was capable of identifying early T-stage lesions (for example, T2b),” comments Lan. “We will continue to enrol more patients with early stage to further confirm the feasibility, which may help the patients’ clinical management. Early surgical excision of localized malignant melanoma portends favourable outcomes, and surgical strategies vary on different T-stages. In this scenario, both prompt diagnosis and accurate disease staging are paramount to reduce mortality.”

“We aim at exploring the diagnostic value of 18F-PFPN in patients with clinically suspected or confirmed malignant melanoma,” she adds. Although 18F-PFPN helps to distinguish between pigmented and non-pigmented lesions, our planned research will not focus on the evaluation of non-pigmented lesions.”

The study is described in the Journal of Nuclear Medicine.

Closest black hole is really a vampire star, augmented reality comes to prescription eyeglasses

In this episode of the Physics World Weekly podcast, I chat with the KU Leuven astrophysicist Abigail Frost about a mysterious stellar system that was thought to harbour the closest black hole to Earth. Instead, Frost and colleagues have shown that the system comprises a star that has been stripped by its “vampire” partner. She explains how different research groups competed and co-operated to gain a better understanding of the system, which is called HR 6819.

Also featured this week is Frank-Oliver Karutz, who is chief technology officer of Germany’s tooz technologies. He talks about the company’s curved waveguide technology that is used to make smart eyeglasses for augmented reality and other applications. The firm has partnered with Jade Bird Display (JBD) of China to create eyeglasses that provide the wearer with bright virtual images on prescription lenses that are otherwise transparent.

Below is an illustration of how the tooz and JBD eyeglasses work.

Tooz JBD eyeglasses


European conference spotlights quantum for business

Science and innovation are essential ingredients for a technological revolution, but they are not enough alone. Other driving factors are the need for businesses to adopt new technology to encourage interactions between the developers and the potential end users to discover applications.

Promoting this type of communication is a key goal of Quantum Business Europe (QBE), a conference that brings together researchers and industry leaders to spark collaborations and accelerate the quantum revolution in Europe.

After a successful initial event last year, QBE is returning for a second edition from 23-24 March 2022. It will be held in a fully virtual format, with sessions livestreamed and made available to attendees for two months after the conference.

With the rapid developments happening in the quantum sector, the QBE organizers believe that the question for businesses is no longer whether they should implement quantum technology, but rather how they can best use it to advance their goals.

QBE therefore aims to help companies get ahead of the curve by equipping them with the knowledge and connections to assess how quantum can meet their needs and to build their own “roadmap” for deploying it.

To this end, the programme features more than 50 speakers including experts from tech giants and start-ups in all three primary areas of quantum 2.0 technology: computing, communications and sensing.

Among the speakers are also representatives of industrial associations and government bodies, with the opening session to be given by Tommaso Calarco, chair of the European Quantum Community Network. He will discuss the EU’s current standing in quantum technologies and how it is capitalizing on its advantages in the field.

Other keynote sessions include one by John Martinis of the University of California, Santa Barbara, delving into what quantum computers actually are – and why they are not simply the next generation of supercomputers – and another by Gabriel Puebla-Hellmann, CEO of QZabre, looking at how quantum sensing is already having real-world impacts.

There will be two streams of talks and roundtables in the afternoons. Topics will range from end user applications of quantum computing, such as materials discovery and drug design, to the skills required for the European quantum industry and best practices in quantum software development.

In addition, there will be more than 30 technology-demonstration sessions showcasing the latest advances in the European quantum sector. Zurich Instruments will demonstrate its new qubit controller for superconducting quantum processors, while Atom Computing will discuss recent results in scalability and error correction for neutral-atom qubits.

Cryogenics company Bluefors will present the latest developments in its dilution refrigerator measurement system, which are outlined below, and the applications for quantum measurements.

To participate in Quantum Business Europe, you can register for a full conference pass or for free access to the virtual exhibition and demo sessions on the event’s website.

Cryogenic technology supports quantum measurement

Photo of the Bluefors Transformative tech Bluefors’ travelling wave parametric amplifier

Finnish firm Bluefors is a leader in the area of dilution refrigerators, which can be used to cool quantum computers based on superconducting qubits. The company has recently announced multiple developments to support and enable the evolving measurement needs of the quantum industry.

Late last year, Bluefors introduced KIDE, its largest cooling system yet, which is designed to facilitate the large-scale experiments involved in the near-to-medium-term goals of the quantum-computing community. Furthermore, the KIDE units are structured so they can be clustered together to form an even bigger system if required.

Another new solution that Bluefors will be launching in the near future is an integrated readout module comprising everything needed to perform qubit readout. This module combines several advances developed by the company in recent years. For example, it includes Bluefors’ coaxial infrared filter, which absorbs and dissipates relatively high-energy photons coming from thermalized components, protecting quantum devices from radiative heating and decoherence while preserving high signal fidelity.

Another key feature of the integrated readout module is the travelling wave parametric amplifier (TWPA), which is designed to amplify signals near the quantum limit. Set to be showcased at the Quantum Business Europe conference, it has a wide gain bandwidth of 4-8 GHz, with a high gain of 15dB across 80% of this range, with only a minimal amount of added noise, around 300mK.

The high performance of the TWPA has been demonstrated with a cryogenic variable temperature noise source – a diagnostics tool also developed by Bluefors. This tool can be used to add a controlled and well-defined amount of noise into an amplifier cascade, allowing analysis of the amount of intrinsic noise introduced by the amplifier. This is crucial for correcting and optimizing qubit readout.

  • For more information about Bluefors’ recent developments and their applications to quantum measurement, you can tune into the company’s demo session on 23 March at Quantum Business Europe.

Listening to graphene yields clues to its structure

When scientists create graphene by heating a precursor material with a laser, they usually analyse the form and quality of the finished product using techniques such as Raman spectroscopy or electron microscopy. A team at Rice University in the US has now put forward a completely new alternative: listening to the sounds produced as this laser-induced graphene grows.

The new technique arose when two students in James Tour’s lab at Rice, John Li and Victor Li, got the idea of attaching a $31 microphone to the laser writing head. After recording the sounds the graphene made as it grew, the pair, who are brothers and were aged just 19 and 17 at the time, converted these sounds into spectrograms and used a simple signal processing technique known as a fast Fourier transform to turn the patterns into interpretable signals. Thanks to this technique, members of the team were able to analyse the properties of their laser-induced graphene in real time – a significant advantage over conventional methods.

Interconnected graphene sheets

Graphene is a two-dimensional form of carbon just one atom thick. In the laser-induced method of growing it, layers of interconnected graphene sheets form when a laser heats the surface of a thin polymer film to 2500 °C. The intense heat causes other components of the polymer to vaporize, leaving just the carbon atoms behind. Developed in 2014 by Tour and colleagues at Rice, the method can also be used to make graphene from other precursors, including food.

Normally, researchers assess the quality and morphology of this type of graphene by performing Raman spectroscopy and electron microscopy on it after the synthesis is complete. These measurements have low throughput, however, and they cannot be used to analyse the material in real time. They also only provide information about the relatively small area of the laser-induced graphene they sample, meaning that some products may escape detection.

Different sounds from different processes

The new sound-based technique, on the other hand, yields a real-time quality assessment of the entire graphene surface. To test it, the Rice researchers created laser-induced graphene by scribing an industrial polyimide film with a commercial 10.6-micron CO2 laser. As well as recording sound, they also used a camera to observe the formation of laser-induced graphene, which is associated with a visible blackening of the converted surface.

The different sounds they recorded come from different processes that occur during growth, explains John Li, who is now a PhD student at Stanford University (his brother Victor is now an undergraduate at the Massachusetts Institute of Technology). The sounds the graphene emits “provide information on the relaxation of the energy input when the laser hits the sample and gets absorbed, transmitted, scattered, reflected or just in general converted into different types of energy,” he says. Variations in these signals during synthesis, he adds, indicate that different products are being formed.

The audio analysis technique gives the researchers a much greater ability to control the quality of the graphene as it forms. Members of the Rice team say that a similar method could be applied to other manufacturing processes, including plasma-spraying and cleaning, sintering, ball-milling, phase and strain engineering, chemical vapour deposition, combustion, annealing, quenching, laser-cutting and the flash Joule heating method also developed by Tour’s group.

The team, which reports its work in Advanced Functional Materials, now plans to explore ways of extending the acoustic analysis technique to some of these processes. “We also hope to develop new algorithms to analyse sounds and combine information obtained through sound with other techniques that provide complementary signals,” John Li tells Physics World.

Copyright © 2026 by IOP Publishing Ltd and individual contributors