NASA has launched a mission to test whether it is possible to deflect an asteroid using “kinetic impact”. The Double Asteroid Redirection Test (DART) craft – the first mission dedicated to demonstrating this method of asteroid deflection – took off at 06:20 UTC today from Vandenberg Space Force Base, California, aboard a SpaceX Falcon 9 rocket. The mission will slam into a binary asteroid to see if the kinetic impact of a spacecraft could one day successfully deflect an asteroid that is on a collision course with Earth.
DART is a critical next step for planetary defence
Cristina Thomas
Asteroids and comets that orbit the Sun like the planets are collectively known as near-Earth objects (NEOs) and are dangerous because they can come within 50 km of Earth’s orbit. In 2005 the US Congress called on NASA to find, track and characterize – by 2020 – at least 90% of the predicted number of NEOs that are 140 m or larger in size. While no known asteroid bigger than 140 m has a significant chance to hit Earth over the next century, fewer than half of the estimated 25,000 NEOs that are 140 m and larger in size have been found to date.
Weighing around 60 kg, DART’s target is a binary, near-Earth asteroid system that consists of a 780 m-diameter asteroid called “Didymos” and a smaller, 160 m body “Dimorphos” that orbits it. The DART payload is made up of a single instrument called DRACO – a high-resolution imager that will take images of Didymos and Dimorphos on approach to measure their size and shape.
The mission also contains the Light Italian CubeSat for Imaging of Asteroids (LICIACube) – a CubeSat that has been contributed by the Italian Space Agency. LICIACube carries two optical cameras and will be deployed from the DART spacecraft 10 days prior to impact.
Measuring impact
DART is expected to carry out the impact on Dimorphos between 26 September and 1 October 2022. It will do so travelling about 6 kilometres per second. Soon after impact, LICIACube will fly past Dimorphos to image the kinetic impact itself, the resultant ejecta plume and possibly the impact crater.
Ground-based observations carried out at several facilities – including the Lowell Discovery Telescope in Arizona, Las Campanas Observatory in Chile, the Las Cumbres Observatory global network, and the Magdalena Ridge Observatory in New Mexico – will also track the impact of DART and the subsequent response by Dimorphos.
Scientists will then compare the results of DART’s kinetic impact with computer simulations to evaluate the effectiveness of this approach and assess how best to apply it to future planetary defence scenarios. “DART is a critical next step for planetary defence,” says planetary astronomer Cristina Thomas from Northern Arizona University who heads the DART observations working group. “It is, on the surface, a simple test, but we will not completely understand what will happen until we do it.”
In 2024 the European Space Agency’s Hera mission will launch to the asteroid system and, once it arrives two years later, it will perform a close-up “crime-scene” investigation of DART’s impact.
Exoplanets have been spotted orbiting at right angles to each other by an international team of astronomers led by Vincent Bourrier at the University of Geneva. The team believes that this unusual configuration is caused by the influence of a yet-to-be-discovered companion object orbiting the exoplanets’ star.
A star and its planets are believed to form from the same rotating disc of gas and dust. Therefore, the spin of a star should point in the same direction as the plane of the orbits of its planets. The planets in the solar system follow this rule to within a few degrees, but the dwarf planet Pluto is off by about 17°.
Astronomers have discovered more than 3500 exoplanetary systems so far – systems of planets orbiting stars other than the Sun. Studies of the relative orientations of spins of stars and the orbits of their planets would provide important information about how planetary systems form and evolve.
Mini-Neptunes
To do this, astronomers measure the trajectories of exoplanets as they “transit” in front of their star and compare this to a measurement of the spin of that star. In 2019, observations using the HARPS-N spectrograph in the Canary Islands revealed a particularly extreme example of misalignment. Around the star HD3167, two out of three orbiting planets – both “mini-Neptunes” – were misaligned with the star’s spin by close to 90°.
At the time, limitations in spectral and temporal resolution prevented astronomers from determining the orbital plane of HD3167’s much smaller innermost planet. Called HD3167b, this “super-Earth” completes a full orbit in just 23 h. To study this exoplanet, Bourrier’s team developed a new technique that extracts more orbital information from observed optical spectra.
The study involved taking measurements using two ESA instruments: the ESPRESSO spectrograph – part of the Very Large Telescope in Chile – and the CHEOPS space telescope. Together, these instruments allowed the team to determine the misalignment of HD3167b’s orbital plane to within just a few degrees, while measuring its transit time to within an accuracy of just one minute. This revealed that HD3167b’s orbit is mostly aligned with its star’s spin, making it perpendicular to its two planetary companions.
This suggests that HD3167’s two outermost planets have been influenced by the gravitational tug of a yet-to-be-discovered fourth body. This would have pulled the planets from the original orbital plane of the system and caused them to migrate to their current orientations. In contrast, the results show that HD3167b is likely to be more strongly coupled to its host star, forcing it to continue orbiting in the original plane. Using these results, Bourrier’s team will now expand their search for HD3167’s elusive fourth companion – potentially uncovering new details on how planetary orbits evolve after their initial formation.
A neurosurgeon, who is about to retire, approaches a historian of science and says: “I’m thinking of taking up history of surgery; can you give me any tips?”
“Yes I can!” replies the historian. “As it happens, I’m also retiring and I plan to take up brain surgery; do you have any pointers for me?”
This caustic and surely apocryphal story is beloved by historians, for it highlights and mocks a perceived asymmetry between professions. Science and medicine are regarded as much more difficult, and to require much more specialized training, than history, which seems to be within the skill set of amateurs.
A dramatic illustration of what’s wrong with that perception can be found in a project I’m currently working on – editing a book on the history of materials-science institutions across the world as part of a four-volume series on the history of materials science. It sounds easy in principle. Just compile a list of the laboratories that focus on materials science, describe how they evolved and say what they discovered.
But labs do materials science in different ways. National laboratories tend to be mission-driven and respond to government priorities. Metrological laboratories have (until recently) focused on making standards and testing materials. Industrial labs are product-driven and can target single materials (such as Corning) or a range of them (like IBM). Military labs, meanwhile, study defence-related materials and devices.
Science and medicine are regarded as much more difficult, and to require much more specialized training, than history
A history of institutions has to describe and evaluate this diversity. What’s more, materials-science labs depend on a network of funding agencies, professional societies, educational institutions and journals geared to the field.
Diverse discipline
In the US, which is only one of the regions that I have to cover, a variety of federal agencies sponsor such research. One of the most successful is the Defense Advanced Research Projects Agency (DARPA), which the Economist recently said had “shaped the modern world”. In the 1960s, DARPA’s predecessor agency, ARPA, set up materials-science research centres at several universities to sharpen US prowess in key military areas during a heightening of the Cold War, each of which went on to become key parts of the materials-science network in their own right.
So much for the labs themselves. My volume on the history of materials science also needs to record how universities train material scientists. In the US, those institutions fall into two camps: prestigious places such as Berkeley and Cornell that focus on high-quality work and those that turn out lots of students. Then somehow I have to acknowledge different educational models. At universities like Northwestern, materials science is in a single department, whereas at the University of Texas, Austin, say, it’s interdisciplinary and spread across departments.
And what about institutions that publish and disseminate research? There are learned-society publishers like the APS and the Institute of Physics, which publishes Physics World, as well as commercial companies such as Elsevier. Then there are magazines from the likes of the MRS and repositories like arXiv. I also have to identify which institutions have done key work on the real-world applications of materials. Can they be processed? Are they too expensive? Will they pollute?
It’s clear that an entire network of institutions is required to make materials science happen, and there are different networks in different nations and regions. Each needs to be flexibly and efficiently managed for the research to happen. These networks evolve, with new ones entering and existing ones changing focus or disappearing.
New networks spring up in areas such as nanotechnology. There has also been a blurring between “hard” and “soft” materials, and the arrival of 2D materials, quantum materials and other exotic forms of matter.
How did there come to be “materials science” in the first place?
Finally, how did there come to be “materials science” in the first place? Until recently, materials such as ceramics, glasses, semiconductors and metals were studied separately using different instruments and theories. Only in the past few decades did those fields draw together into a single, coherent fields of science such as solid-state physics and condensed-matter physics.
That, in turn, raises the philosophical question of how and why this disciplinary consolidation occurred.
The critical point
Let me conclude with a story that Ian McEwan tells in his best-selling 2010 novel, Solar. The protagonist, a male physicist, is attracted to a woman who he knows is interested in the 17th-century poet John Milton. Keen to impress her, he spends a week reading books and biographies, memorizing passages and facts. The ploy succeeds – leading the physicist to conclude that English literature is easy and an academic scam compared to physics, which takes years to become skilled in.
The physicist gleefully points out his belief to an English professor. She, however, puts him firmly in his place, wryly remarking that of course he deserves a degree in English literature – provided he approaches 90 different women in the same fashion (which would involve studying one poet a week for three academic years) while at the same time crafting an aesthetic overview of all those poets’ works.
And that is why I wouldn’t recommend working on a history of materials science institutions to a neurosurgeon.
Magnetic moment: Tino Gottschall of the Dresden High Magnetic Field Laboratory in Germany was awarded the 2021 Nicholas Kurti Science Prize for his work on magnetic refrigeration. (Courtesy: R Weisflog/HZDR)
This year’s Nobel prize for physics, announced in early October, was awarded to three scientists who laid the theoretical groundwork for understanding complexity in physical systems. Their fundamental insights have had far-reaching consequences across many different areas of scientific research, ranging from the chaotic dynamics of climate change through to the effects of disorder in exotic states of matter.
While this year’s Nobel prize celebrated the long-lasting impact of work that was done several decades ago, it is just as important to recognize the achievements of early-career researchers and how they might influence the science of the future. For that reason Oxford Instruments NanoScience has since 2005 sponsored the Nicholas Kurti Science Prize, awarded by a panel of leading academics to young European researchers who have pioneered novel experimental techniques that exploit low temperatures or high magnetic fields – or sometimes both.
“Receiving the Nicholas Kurti prize was a great honour,” says Tino Gottschall, the winner of the 2021 prize. “I strongly believe that it will be a real booster for my scientific career.”
Gottschall, who studies magnetic materials at the Dresden High Magnetic Field Laboratory (HLD) at the Helmholtz-Zentrum Dresden-Rossendorf (HZDR) in Germany, is particularly pleased that his modern-day research is directly descended from the work of Nicholas Kurti. While working at Oxford University in the 1960s, Kurti used a technique called magnetic refrigeration to reach lower temperatures than had ever been achieved before – down to one microkelvin. Today, Gottschall is exploiting the same technique at room temperatures to develop cooling devices that offer a greener alternative to conventional refrigerators.
Gottschall explains that magnetic cooling exploits materials that exhibit a strong magnetocaloric effect – in other words, the temperature of the material changes when it is exposed to a rapidly changing magnetic field. The spins in these materials are usually disordered, and only become aligned when a magnetic field is applied. “Going from a disordered state to an ordered state reduces the entropy in the material,” says Gottschall. “If the magnetic field is applied quickly enough, this entropy is transferred from the magnetic system to the crystal lattice. The atoms vibrate more vigorously and the temperature of the material increases.”
The opposite happens when the magnetic field is removed: the spins fall back into the disordered state and the material cools down. “We can use these effects to build a machine that acts as a refrigerator,” says Gottschall. “The big advantage at room temperatures is that we only need water to pump the heat, which makes it much more environmentally friendly than the gaseous refrigerants typically used today.”
To investigate the properties of these magnetocaloric materials, Gottschall exploits pulsed-field magnets designed and built at the HLD that can deliver field strengths of up to 100 T for short periods of time, typically a few milliseconds. For the rare-earth element gadolinium, for example, he measured a temperature increase of 60 K when the pulsed field reached 60 T. “In the very moment the field goes back to zero the temperature change also goes back to zero,” he says. “It’s really fascinating. There is no other class of materials that can do such a thing.”
One of the big experimental challenges for Gottschall is to precisely measure the temperature of the sample within such short timescales, which he has achieved by creating thermocouples as thin as 35 µm. Other material properties need to be quantified at the same time, particularly changes in length and volume that can be quite pronounced in magnetocaloric materials, while Gottschall also uses a calorimeter based on a static 16 T superconducting magnet to record the heat capacity of the samples over a wide temperature range. “Pulsed-field experiments are unique because they offer the opportunity to measure temperature changes as well as kinetic effects, but we also need static conditions to get the full picture and enable us to optimize the materials,” he says.
Gottschall is now keen to explore the potential of magnetic cooling for the liquefaction of hydrogen, a crucial process for storing and transporting large amounts of hydrogen fuel. The current technology is extremely energy-intensive, with efficiencies of just 20–25%, which means that the liquefaction process consumes almost all of the energy contained inside the hydrogen. Gottschall believes that magnetic refrigeration has the potential to make the process much more efficient. He is currently applying for research grants, and hopes that winning the Nicholas Kurti prize will provide an important external endorsement to bolster his research proposals.
“Of course publications and citations are crucial, but the people who make decisions about research funding are often not experts in the field,” he says. “This kind of recognition is really important to raise the funding I need to push my research forwards.”
Rebeca Ribeiro-Palau shared the 2020 Nicholas Kurti prize for her investigations of the quantum properties of stacked two-dimensional materials. (Courtesy: Rebeca Ribeiro-Palau)
Rebeca Ribeiro-Palau, who shared the 2020 prize for her work on two-dimensional materials, agrees that this external recognition can boost the profile of early-career researchers. “It’s really important to get your name known within the research community,” she says. “If people are more familiar with your work, it might you help you to get a better job, raise some research funding, or establish new connections and collaborations.”
Ribeiro-Palau points out that it can be very difficult for younger researchers to promote their research to the wider research community. “It’s not easy when you are just starting,” she says. “As a junior researcher you don’t get invited to conferences as often as senior academics because the organizers always ask the big names.” For that reason, along with a cash prize of €8000, the Nicholas Kurti award includes financial support for the winner to attend and present their work at a European conference – although neither Ribeiro-Palau nor Gottschall has yet been able to take this opportunity because of the COVID-19 pandemic.
One key aim for Oxford Instruments NanoScience, which also awards several other science prizes in different geographic regions, is to help talented young researchers to establish their own research programmes. “We are really proud to support innovation in scientific research through our science prizes, which we have been awarding for more than 15 years,” comments Stuart Woods, managing director of Oxford Instruments NanoScience. “Innovation is at the core of everything that we do, and we are really excited about the opportunities this programme provides for scientists to do ground-breaking work to advance our human understanding.”
For Ribeiro-Palau, one unexpected benefit of winning the Nicholas Kurti prize is that it has acted as a magnet for attracting talented post-docs and PhD students. “We have one very good post-doc who had decided to change his research direction,” she says. “He found out about the prize, thought the research looked interesting, and asked to join the group. It was a perfect match.”
Ribeiro-Palau’s research at the University of Paris-Saclay explores the unique electronic properties that emerge when layers of two-dimensional materials are stacked on top of each other. Changing the angle between the weakly coupled layers can completely alter the properties of the material – such as the discovery in 2018 that aligning two sheets of graphene at a “magic angle” of 1.1° yields a superconducting structure at 1.7 K – which opens up the possibility of tuning the material’s properties simply by twisting one layer relative to the other.
“We are using these stacked materials to investigate and enhance new quantum properties of matter,” says Ribeiro-Palau. “I am particularly interested in electron transport inside these materials, since at low temperatures they can exhibit robust electronic states that are protected from the environment as well any defects in the materials. Such topologically protected states could form the basis of future quantum technologies.”
To investigate these electrical phenomena, Ribeiro-Palau needs to make precise measurements of the movement of charge carriers at low temperatures. High-quality samples are essential to reveal the quantum effects she is looking for, plus the experiment is extremely sensitive to any source of noise. “The experiment needs to be completely isolated from the environment, not just to reach low temperatures but also to prevent electrical interference from other lab equipment and even the computers we use to run it,” she explains. “We need to use very low-noise equipment and very sensitive amplifiers.”
Within the next few years, Ribeiro-Palau hopes to develop a lab that offers complementary techniques for investigating low-temperature electron transport in twisted 2D structures. She is also keen to study a phenomenon called the anomalous quantum Hall effect – which enables current to flow along the edges of the 2D materials with virtually no resistance, even in the absence of a magnetic field – which can be tuned by changing the angle of alignment between adjacent layers of different 2D materials. “The goal would be to use this phenomenon to develop new metrological standards,” says Ribeiro-Palau. She also has ambitions to create a start-up company, but says with a smile that “I need to focus on the next five years first.”
Flash Joule heating recovers valuable and toxic metals from electronic waste. (Courtesy: Jeff Fitlow/Rice University)
Electronic waste could be transformed from an environmental headache into a literal goldmine thanks to a technique known as flash Joule heating. The technique, which scientists at Rice University in the US have now expanded to include a broader range of materials, can be used to recover valuable metals from waste quickly and simply, without toxic solvents and with much less energy than current laboratory methods. The processed waste also contains a very low concentration of heavy metals, making it safe for agricultural use.
The world’s consumers produce more than 40 million tonnes of electronic waste each year. Since only about 20% of this e-waste is recycled, it is becoming an increasingly serious problem. Most of the rest ends up in landfills, which is disastrous for the environment – not least as it often contains heavy metals such as chromium (Cr), arsenic (As), cadmium (Cd), mercury (Hg) and lead (Pb), some of which are highly toxic.
Sustainable resource
With the right type of processing, however, e-waste could also be a substantial – and sustainable – source of precious metals like rhodium (Rh), palladium (Pd), silver (Ag) and gold (Au). Indeed, the concentrations of some of these elements are actually higher in e-waste than they are in natural ores. For this reason, recovering metals from e-waste – a process known as urban mining – is becoming more cost-competitive with traditional mining.
The drawback is that e-waste recycling processes are far from perfect. The main ones are based on pyrometallurgy, which involves creating a molten soup of metals at high temperatures, and thus lacks selectivity as well as requiring a lot of energy. These methods also produce hazardous, heavy-metal-bearing fumes, especially when the waste contains metals like Hg, Cd and Pb that have relatively low melting points. Other methods rely on hydrometallurgy, in which metals are leached out of e-waste using acids, bases or cyanide. While these methods are more selective, they produce large amounts of (often highly polluted) liquid waste and sludge, and involve kinetically slow chemical reactions, making them hard to scale up. A third family of techniques, known as biometallurgy, involves harnessing biological processes in microorganisms to separate metals, but this promising research is still in its infancy.
Flash Joule heating
In 2020, a Rice University team led by James Tour developed a way of producing graphene from carbon sources like waste food and plastic. The same team has now adapted this flash Joule heating method to recover metals like Rh, Pd, Au and Ag from e-waste. A further advantage is that the same approach can also remove toxic metals like Cr, As, Cd, Hg and Pb from the waste after the more valuable metals have been extracted.
The technique relies on the fact that the metals in e-waste have vapour pressures that are very different from those of typical substrates such as carbon, ceramics and glass. In a process known as evaporative separation, the researchers vaporize these metals in a flash chamber by applying a brief (less than 1 second), intense pulse of current to the waste, rapidly heating it to 3400 K. The vapours are transported under vacuum from the flash chamber to a cold trap where they condense into their constituent metals, explains team member Bing Deng. The metal mixture in the trap can then be further purified using well-established refining methods.
The researchers claim that their technique, which they describe in Nature Communications, can recover more than 80% of metals like Rh, Pd and Ag when halide additives are included in the mix, while yields for Au exceeded 60%. They also report that a single flash Joule reaction reduced the concentration of Pb in the remaining char to below 0.05 ppm – the level deemed safe for agricultural soils. Increasing the number of flashes reduced the levels of As, Hg and Cr further, too. “Since each flash takes less than a second, this is easy to do,” Tour says.
The process, which the researchers say is scalable, consumes roughly 939 kilowatt-hours per tonne of e-waste processed. The Rice team say that this is 80 times less energy than commercial smelting furnaces and 500 times less than lab tube furnaces.
In the not too distant future, wearable biometric sensors may be able to detect the early stages of acute viral respiratory infections in people before they develop any symptoms. Such non-invasive devices could be used for infection screening to help limit community spread of airborne viruses. If a biometric sensor could also predict the severity of infection, a person could also receive faster and potentially better medical treatment.
A study conducted by researchers at Duke University showed that a wristband with biometric sensors could detect an influenza infection (H1N1) in an asymptomatic person with up to 92% accuracy, and the common cold (rhinovirus) with up to 88% accuracy. An infection severity prediction model designed by the researchers was able to distinguish between mild and moderate infection 24 hr prior to symptom onset, with an accuracy of 90% for influenza and 89% for rhinovirus, according to findings published in JAMA Network Open.
“Resting heart rate, heart rate variability, accelerometry, electrodermal skin activity and skin temperature can indicate a person’s infection status or predict if and when a person will become infected after exposure,” the researchers write. “Detecting abnormal biosignals using wearables could be the first step in identifying infections before symptom onset.”
Principal investigator: Jessilyn Dunn from Duke University.
Principal investigator Jessilyn Dunn and colleagues recruited 39 participants for the H1N1 influenza challenge and 24 for the rhinovirus challenge. The groups were inoculated with intranasal drops of diluted influenza virus or diluted human rhinovirus, respectively. The influenza group only was isolated in a clinic for a minimum of eight days after inoculation.
For the study, the team employed the Empatica E4 wristband, a medical-grade wearable device that measures heart rate, skin temperature, electrodermal activity and movement in real time. The influenza group wore an E4 wristband one day before and 11 days after inoculation, while the rhinovirus group wore the wristband four days before and five days after inoculation. The wristband recorded data continuously, which were transmitted electronically twice daily. Participants performed a nasal lavage polymerase chain reaction (PCR) test every morning to record viral shedding, and self-reported symptoms twice daily.
The researchers measured observable symptoms (including fever, stuffy or runny nose, coughing, sneezing, shortness of breath, hoarseness, diarrhoea and wheezy chest), self-reported unobservable symptoms (such as fatigue, headache, ear pain, throat discomfort, chest pain, chills, fatigue and itchy eyes) and viral shedding. Participants were divided into subgroups by infection similarity, specifically being asymptomatic or non-infected, having a mild case or having a moderate case, and by disease trajectory.
The team developed and tested 25 classification models to predict infection versus non-infection from wristband data, with each model covering a different time period after inoculation or using a different definition of infected versus uninfected. The final analysis included 31 participants for the influenza group and 18 for the rhinovirus group.
Using only data collected from the wearable device, the H1N1 models were able to distinguish between infection and non-infection with an accuracy of up to 92% for H1N1 (90% precision, 90% sensitivity and 93% specificity). Models predicting whether or not a participant was infected with rhinovirus achieved up to 88% accuracy (100% precision, 78% sensitivity and 100% specificity).
The researchers also developed 66 models for prediction of infection severity prior to symptom onset, for different time periods after inoculation. These models also performed well, distinguishing between mild and moderate infection 24 hr before symptom onset, with an accuracy of 90% for influenza and 89% for the common cold. The most important features for predicting infection severity were resting heart rate and mean heart rate variability.
The researchers report that an accuracy plateau occurred between 12 and 24 hr after inoculation, for 24 of the 25 infection detection models and for 64 of the 66 infection severity models. “This finding indicates that the most critical of the physiologic changes that occur in response to viral inoculation and that predict pending illness severity occurred within 12 to 24 hours after exposure,” they write.
Dunn says that research to improve the algorithms is ongoing, and that another influenza study will be conducted to evaluate models using different dosage levels of virus inoculation.
Dunn and Ryan Shaw, director of Duke’s Health Innovation Lab, are co-principal investigators of CovIdentify, an ongoing study launched in April 2020 to assess whether smartwatch wearers’ health, such as sleep schedules, oxygen levels, activity levels and heart rate, can be used to detect early symptoms of COVID-19. The study is currently collecting data from around 8500 smartwatch wearers, who also complete a short online survey for up to 12 months, and continues to recruit volunteer participants.
“We hope to learn what sickness with COVID-19 looks like at the physiological level, and how parameters around heart rate, sleep and movement change when a person gets infected,” Dunn explains. “We are also interested in comparing data from unvaccinated individuals, as well as people who develop breakthrough infections.”
The event I attended on Friday caught my attention for several reasons. Billed as the Quantum Network Explorer (QNE) Launch, it took place in the Hague, the Netherlands, not far from where I live. In a year that has seen so much exciting progress on quantum networks, I was curious to find out what it involved. But I was also drawn by the event’s name, which made it sound a lot like Microsoft’s all-but-defunct web browser, Internet Explorer.
Among Internet-using citizens of a certain age, the name “Internet Explorer” triggers one of two emotions: nostalgia or annoyance. For many (excluding Netscape fans from the 1990s and, of course, the CERN scientists who created the web in the first place), Explorer was their first experience with the World Wide Web. Over the past two decades, however, it has fallen well behind competing browsers such as Chrome and Firefox. So, from the perspective of the QNE launch, I was wondering: will this be the beginning of a new era, one that will eventually lead to us to take the quantum Internet for granted? Or will it fizzle out?
The event was hosted by QuTech, a collaboration between the TU Delft and TNO. From a broader perspective, it was part of the Europe-wide Quantum Internet Alliance, which has the long-term aim of enabling quantum communication applications between any two points on Earth. During the event, 50 people present on-site and around 400 viewing via livestreamed video watched the QuTech physicist Stephanie Wehner push the red button that officially launched QNE. Afterwards, we watched animations and listened to two discussion panels, containing members from Quantum Delta NL, SURF and RIPE NCC, that explained what the quantum Internet was and how QNE contributes to it.
QNE, it turns out, is a development platform based on the software stack that runs a quantum network. Because of the requirement for quantum entanglement, quantum networking software is very different from the software that runs classical networks – and complicated enough that most people who operate it have a PhD in physics. Although QNE has been developed with an actual quantum network in mind, for now, it is running on a classical simulation. In time, this simulation will be replaced with actual quantum hardware.
Importantly, though, QNE offers a user-friendly software interface that allows people to start developing applications for quantum networks (you can access it here). The idea is that anybody – with or without a PhD in physics – can start playing with the software and use it to develop next-generation quantum network applications. That way, QNE will train end-users to work with quantum networks, allow for new “killer apps” to come forward and attract new people (including high school students) to the field of quantum.
I believe it’s the right choice for developers to put this new technology in the hands of users, as it should help to accelerate progress. But will QNE lead to a new generation of quantum apps, inevitably named Qapps? Or will it lose ground to competing quantum browsers such as Qhrome or FirefoQs? Only time will tell, but thanks to projects like QNE, we can take at least take a step towards making such daydreams a reality. I guess the only thing left for me is to put my PhD in physics to good use…
This post was updated on 24 November 2021 to clarify the roles of the organizations involved.
A new X-ray imaging technique that uses sticky, or Scotch, tape as a diffuser to generate “speckle” patterns makes it possible to characterize strongly curved X-ray mirrors in two dimensions with nanoscale precision. The new technique could find use in super-precision metrology, while also aiding the development of next-generation X-ray mirrors for upgraded synchrotrons.
X-ray mirrors are routinely employed in synchrotron radiation facilities, X-ray free-electron lasers and X-ray telescopes. Such mirrors have become increasingly smooth in the past few years thanks to advanced polishing techniques and now boast “slope errors” smaller than 50 nanoradians rms (root mean square). While this is a boon for many applications, the downside is the mirrors are so smooth that existing metrology techniques can no longer be used to characterize them.
Speckle angular measurement
Researchers led by Kawal Sawhney, Hongchang Wang and Simone Moriconi from the Optics and Metrology group at the UK’s Diamond Light Source have now developed a new instrument and technique based on “speckle angular measurement” (SAM) that remedies this need. Indeed, in their work, which they describe in Light: Science & Applications the researchers show that they can push the angular precision of slope error measurements down to just 20 nanoradians rms thanks to an advanced sub-pixel tracking algorithm.
The SAM technique generates two-dimensional random intensity patterns (the speckles) by shining a laser through a “diffuser” made from good old sticky tape. Since the tape is see-through, the laser light can pass through it and generate the speckle patterns, with any variations in the slope of the mirror shifting these patterns. The researchers can then determine the exact value of these variations to the nanoradian level by precisely tracking the speckle shift with the algorithm they developed.
Unlike other techniques, the new method does not require high-precision optics and the samples do not need to be rotated during the experiments. The technique is also simple as it only requires Scotch tape.
Complement existing metrology methods
The researchers say the SAM instrument might also be used to measure toroidal, ellipsoidal and paraboloidal mirrors by raster scanning across the entire mirror surface. This type of technology would be straightforward to integrate into existing measurement probes, too, and thus complement other imaging methods. As well as characterizing synchrotron X-ray mirrors, it could have applications for characterizing freeform optics and extreme ultra-violet high-quality mirrors, with possible extensions to the inspection of biomedical and materials science samples.
The new nano-metrology technique could also aid the development of next-generation super-polished X-ray mirrors that are required for upgraded synchrotron facilities such as Diamond, the researchers say. “This novel instrument will enhance the capabilities of our state-of-the-art metrology laboratory at Diamond and enable us to metrology test the extremely high-quality X-ray mirrors required for use with the planned upgrade of Diamond to a low-emittance Diamond-II source,” Sawhney says. “Vendors of X-ray mirrors will also find this new instrument attractive as it will enable them to fabricate even better-quality optics than at present.”
Transforming CT Naeotom Alpha is the world’s first photon-counting CT scanner. (Courtesy: Siemens Healthineers)
Computed tomography, or CT, is a ubiquitous X-ray imaging technique used to perform more than 300 million medical imaging exams globally each year. Use of the technique continues to grow, with CT increasingly employed as a first-line diagnostic tool for conditions such as coronary artery disease, as well as moving into preventive care and early detection, such as lung cancer screening.
But there are still limitations to what conventional CT can achieve in the clinic. For starters, it’s not always possible to image all patients: medical implants, for example, can create image artefacts that inhibit diagnostic accuracy. There are also shortfalls with regard to image reproducibility and standardization, both essential for ongoing evaluation of disease progress. Finally, there’s a growing need for functional data alongside the standard anatomical CT images.
“These three shortcomings are the ones we had in mind when we started moving into a new era of how CT imaging can be provided,” said Philipp Fischer, head of CT at Siemens Healthineers. “This was the starting point for our thoughts around Naeotom Alpha.”
The culmination of more than 15 years of research, Naeotom Alpha is the world’s first photon-counting CT scanner. Photon-counting technology enables dramatic improvements in diagnostic imaging, including increased resolution and a reduction in radiation dose by up to 45% over conventional CT detectors. Naeotom Alpha is now cleared for clinical use in the USA and Europe, and Siemens Healthineers will be showcasing its new system at next week’s RSNA Annual Meeting.
Crystal breakthrough
Speaking at a media briefing, Fischer described the main differences between conventional and photon-counting CT technology. Conventional CT requires two conversion steps to turn photons into a medical image: X-rays are collected by a scintillator, which uses many photons together to generate an optical signal; a photodiode then converts this light into an electrical signal. The process is stable and reliable; but two-step conversion limits the dose efficiency and, with many photons contributing to the optical signal, the achievable resolution is limited.
“With photon-counting technology, we move from a two-step conversion process to a single one-step conversion of X-ray photons into an electrical current that generates the medical image,” Fischer explained, noting that removing a conversion step increases dose efficiency. “The large difference is that with this new technology, we are able to assess each and any single photon separately, and also assess the energy level of each and any photon.”
This new approach to image acquisition, however, required the development of an entirely new detector material: high-purity cadmium telluride (CdTe) crystals. CdTe crystals deliver the highest spatial resolution of any CT imaging system to date, said Fischer, enabling pixels nine times smaller than used in conventional CT, without any dose penalty.
The crystals also completely eliminate electronic noise from the detector, resulting in a higher signal-to-noise ratio and lower dose requirements. Another advantage is that, unlike conventional CT that often underrepresents low-energy photons, photon-counting technology uses all photons equally, which should be particularly beneficial for soft-tissue imaging. Finally, the detector’s intrinsic spectral sensitivity means that spectral data are available in every scan.
Clinical gains
Fischer shared some examples of how these CT advances could prove invaluable in the clinic. When diagnosing coronary disease, for instance, seven million invasive catheterization procedures are performed each year, half of which do not lead to therapy. CT angiography provides a non-invasive diagnostic alternative. But conventional CT scans suffer from image artefacts due to calcifications or implanted stents or pacemakers, precluding a large patient population from this approach.
The spectral imaging offered by photon-counting technology enables differentiation between calcifications, stents, vessel walls and contrast media. This allows the removal of unwanted data from the image, increasing diagnostic accuracy. “With photon-counting technology, we have the goal to make non-invasive coronary imaging available to all patients that could benefit from it,” said Fischer.
In oncology, meanwhile, Naeotom Alpha’s high precision is particularly beneficial. Cancer patients undergo diagnostic scanning and many follow-up exams to assess treatment response and disease progression. With conventional CT, however, the image acquisition parameters can influence the image itself, preventing accurate comparison of scans over time. Photon-counting CT, on the other hand, provides consistent signal quality, with stable Hounsfield unit values for each patient across every scan.
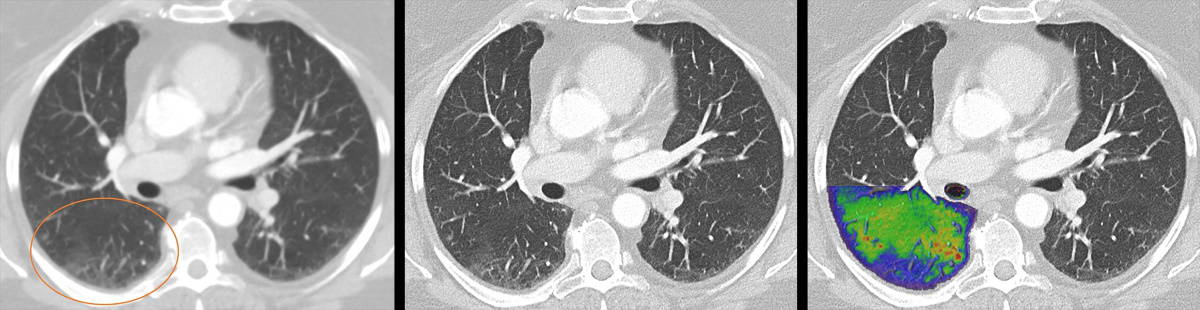
Lung imaging Photon-counting CT allows visualization of detailed structures (centre) with simultaneous functional imaging (right). For comparison, a conventional CT image is shown on the left. (Courtesy: J Ferda, University Hospital Plzen, Czech Republic)
Another target application is lung imaging, where multiple images are often required to achieve a meaningful diagnosis. “With conventional CT, you need to know in advance what you are looking for, and then design your imaging exam,” Fischer explained. “You cannot look for all the detail in one exam without compromising on patient dose, resolution or functional image information.” But with photon-counting technology, a single scan can provide both structural images and functional information on the perfusion of the lung.
Initial experience
The dual-source Naeotom Alpha scanner is already installed at 22 sites. One of the first installations was at the University Hospital Augsburg in Germany, where the system has been in routine clinical use since April 2021.
To date, the Naeotom Alpha has been used to scan more than 4000 patients, in areas including oncology, neurology, cardiology and musculoskeletal imaging. “We are very happy with the results so far,” said Thomas Kröncke, director of the hospital’s department of diagnostic and interventional radiology.
“The important thing to me is seeing better and seeing more, due to the intrinsic spectral separation that photon counting allows,” said Kröncke. “Spectral post-processing is always possible, and the considerable increase in spatial resolution and higher intrinsic iodine contrast make it possible to reduce not only the radiation but also the contrast material.”
Have you ever thought about what happens when you snap your fingers? Raghav Acharya, Elio Challita, Mark Ilton and Saad Bhamla have looked deeply into the physics of the finger snap and published a paper about their surprising findings in the Journal of the Royal Society Interface.
Based at the Georgia Institute of Technology and Harvey Mudd College in the US, the quartet has discovered that the motion of your finger during a snap undergoes the highest angular acceleration that the human body is known to be capable of. They came to this conclusion by studying snapping fingers using high-speed imaging, automated image processing and dynamic force sensors.
They found that a finger snap happens in about 7 ms, which is about one twentieth of the time it takes to blink an eye. The measured angular acceleration was 1.6 million degrees per second squared – which is about three times greater than the acceleration of the arm of a professional baseball pitcher. A pitcher, however, does develop a higher angular velocity than a finger snapper.
Latch and spring
When they are not snapping their fingers, the team studies the mechanisms used by a range of living organisms to store energy and then quickly release it. They say that finger snapping is an example of a latch-mediated spring-actuated system, which is used by some termites and ants to make snapping noises with their mandibles. The team also looked at the role friction plays in snapping by covering their fingers in various materials. When low-friction metal was used, the velocity of the finger dropped dramatically – illustrating the importance of friction in the snapping process. However, when high friction rubber was used, the velocity also dropped – suggesting that there is a “Goldilocks zone” of friction for snapping.
We know about organisms that lived on Earth a very long time ago because occasionally one of those plants or animals was fossilized and preserved for posterity. Scientists believe that Mars may have supported life several billion years ago, so looking for fossils on Mars seems like a reasonable thing to do. But what would Martian fossils look like and how could we tell them apart from structures in rock that were formed by non-living processes?
False fossils This composite image shows some of the types of fossil-like specimens created by chemical reactions that could be found on Mars. (Courtesy: Sean McMahon/Julie Cosmidis/Joti Rouillard)
In the UK, Julie Cosmidis at the University of Oxford and Sean McMahon at the University of Edinburgh have done a review of non-biological geochemical processes that can create structures that look a lot like fossilized microbes. Writing in the Journal of the Geological Society, they identify dozens of processes and say that there could be many more.
These processes can create deposits that look like bacterial cells as well as carbon-based molecules that closely resemble the building blocks of life (see figure).
“We have been fooled by life-mimicking processes in the past,” says Cosmidis. “On many occasions, objects that looked like fossil microbes were described in ancient rocks on Earth and even in meteorites from Mars, but after deeper examination they turned out to have non-biological origins.”
McMahon adds, “For every type of fossil out there, there is at least one non-biological process that creates very similar things, so there is a real need to improve our understanding of how these form.”