A new “time lens” that can magnify the difference in arrival times between individual photons within an ultra-short pulse has been developed by researchers in the US. Using an advanced optical setup, Shu-Wei Huang and colleagues at the University of Colorado, Boulder, showed how the arrival times of individual photons within a femtosecond-length pulse could be stretched out while retaining the quantum information that they carry.
Time-correlated single-photon counting (TCSPC) is a long-established technique for obtaining precise 3D images of objects ranging from molecules to geological features. It involves measuring the times taken for individual photons from a pulsed laser to bounce from an object and travel to a detector.
Through additions including photomultiplier tubes and superconducting nanowires, physicists have greatly improved the resolution of this technique in recent years and it can now distinguish between photons separated by times as small as 3 ps. This has proven particularly useful in studying molecules, whereby the laser pulses cause the molecules to emit photons of fluorescent light.
To further improve this resolution, Huang’s team have developed a new time lens, which instead of magnifying physical space, magnifies the time separating the arrival of individual photons.
Late arrivals
The team’s optical setup comprises an off-the-shelf single photon detector, a 30 m spool of nonlinear optical fibre and two pulsed lasers. When a pulse passes through the time lens, Huang and colleagues found that photons at the leading edge of the pulse speeded up, while the photons at the trailing edge slowed down. As a result, the researchers could clearly distinguish between photons arriving earlier and later within the pulse, while retaining the quantum information contained within each photon.
Overall, the setup magnified photon separation times by a factor of 130, to within an accuracy of about 20 fs, and with a 97% photon conversion efficiency. This allowed the team to resolve ultrashort pulses just 130 fs in duration: several orders of magnitude shorter than those resolvable with existing technology.
Although the widespread use of the time lens in TCSPC is still some way off, Huang’s team hope that their new “quantum stopwatch” will pave the way for new advances in lab-based imaging in the future. If achieved, the technology could aid studies of a wide range of ultrafast, molecular scale processes including chemical reactions and metabolic processes taking place within cells.
A structural colour technology that produces concentric rainbows could help autonomous vehicles read road signs, scientists in the US and China claim. As well as exploring the physics of these novel reflective surfaces, the researchers show that they can produce two different image signals at the same time. Autopilot systems that read both signals would be less likely to misinterpret altered road signs, they suggest.
Car autopilot systems use infrared laser-based light detection and ranging (lidar) systems to scan their environment and recognize traffic situations. But these systems cannot recognise traffic signs. To read signs, autonomous vehicles rely on visible cameras and pattern recognition algorithms.
In recent years, researchers have demonstrated that these visual systems can be fooled by physically hacked or damaged road signs. Placing stickers on stop and speed limit signs resulted in some autopilot systems misidentifying them as faster speed limit signs. This could cause cars to accelerate when they should be slowing down.
“The challenge for those artificial intelligent systems is that the signal for them to identify the traffic sign is limited in a conventional traffic sign,” explains optical engineer Qiaoqiang Gan, from the University at Buffalo. “They only rely on the visible pattern.”
Structural colour: White light reflected by microscale concave interfaces produces concentric rainbows. (Courtesy: Jacob Rada)
Gan and his colleagues think they may have a solution. In 2019 they described a new reflective film that consists of a single layer of polymer microspheres on the sticky side of a transparent tape. These structures are known as microscale concave interfaces. When white light is shone on the film it produces multiple concentric rainbows.
“This phenomenon is very interesting and to our knowledge we cannot observe this type of multi rainbow from naturally existing materials,” Gan tells Physics World.
The researchers initially thought that this material could be used to produce hyper-reflective road signs. These could be great at night as they would not need their own light source, cutting energy consumption and light pollution. The colour of the reflection also changes when observed from different distances and angles. The team showed how this could be leveraged to create passive but smart road signs.
For example, if someone was walking along a dark road towards a road sign and a fast-moving car with its headlights on approached from behind them the sign would change colour. This is because the distance and angle between the headlights and the sign changes relative to the pedestrian. For the driver, however, the colour of the sign stays the same, as their position relative to the headlights is fixed. “This is an interesting optical phenomena to two different observers,” Gan says. “One person will see a stable traffic sign; another will see colour changing. In a dark environment this might be helpful to alert this slowly moving pedestrian to pay attention.”
Alternatively, if the sign has its own light source, it appears to change colour to an approaching driver. This could be useful to alert them to particularly important signs.
Improved sign recognition
In their latest work, published in Applied Materials Today, Gan and his colleagues demonstrate how their earlier findings could be exploited to produce different visual and infrared signals. In a series of experiments, they illuminated signs containing microscale concave interfaces with a fixed light source and scanned them with a moving visual camera and a lidar system. Echoing their earlier work, the visual system saw a colour-changing sign, as it shifted position relative to the light source. But as the lidar system moved with the infrared laser, it saw a stable infrared image.
The researchers believe that if autopilot systems could use lidar to map these signs, the simultaneous visible colour change and stable infrared image could significantly improve pattern recognition. Autonomous vehicles could then be less likely to misclassify damaged or altered road signs.
The researchers also probed the physics of the microscale concave interfaces. They found that depending on the angle at which the light enters the spheres, it is reflected internally two or three times before exiting. This means that even a single light source produces beams of light that exit the spheres at a multitude of angles. These then interfere with each other creating the multiple rainbow ring pattern.
Gan tells Physics World that the team is now looking for collaborators to develop and test robotic systems to read the signs.
Few events in history – and even fewer in the history of physics – have generated as much counterfactual speculation as the atomic bombings of Hiroshima and Nagasaki. Did the bombings save lives by forestalling a US invasion of Japan? Could their immense toll of human suffering – an estimated 210,000 deaths, plus hundreds of thousands of survivors injured and sickened by radiation – have been avoided by warning Japan’s generals of the bomb’s power and demanding they surrender? As with all counterfactuals, the answers to these questions are unknowable, but that has not prevented armchair historians from debating them, with diminishing returns (though not, alas, diminishing enthusiasm from book publishers).
Fortunately, Alex Wellerstein is not that kind of historian. He is an expert in science and technology studies at the Stevens Institute of Technology in New Jersey, US, and his book Restricted Data explores a much less examined (and thus far more interesting) counterfactual: What if the secrecy surrounding nuclear weapons had ended with those first atomic bombings?
Today, the existence of a nuclear security state – that is, an institution charged with shielding nuclear know-how not only from a country’s enemies but even from its own citizens – may seem normal. Not so in 1945. Many Manhattan Project physicists, Niels Bohr and Robert Oppenheimer among them, viewed the secrecy involved in building the first atomic bombs as contrary to scientific ideals. Even Edward Teller, the hawkish “father of the H-bomb”, had doubts about limiting the free exchange of nuclear information, albeit for idiosyncratic reasons (he felt it hindered weapons development). In US political circles, prohibitions on what could be said, and by whom, were seen as antithetical to American values – perhaps even contrary to the First Amendment of the US Constitution, which guarantees the right to free speech. How, then, did information about nuclear physics become so verboten that releasing it without US government approval could be punished with fines, prison or even execution?
To answer this question, Wellerstein draws on a voluminous body of documentary research, supplemented by interviews with more than two dozen living or recently deceased participants in nuclear history. One of the great ironies of Restricted Data is that none of this research involved information that is currently secret. Though Wellerstein is clearly well versed in the art of filing Freedom of Information Act requests, he has no security clearance and professes not to want one. That a book of such calibre and depth can nevertheless be written is a testament both to Wellerstein’s scholarship and to one of the book’s central contentions: knowledge, once created, is very hard to keep secret, and nuclear knowledge – stemming as it does from physics principles accessible to anyone with an intelligent mind and the right training – is arguably harder than most.
Plenty of people tried, of course. Between the end of the Second World War and the Soviet Union’s first atomic test in 1949, a vast and unwieldy bureaucracy sprang up from the fertile soil of the Manhattan Project. Its mission, set out in the Atomic Energy Act of 1946, was to keep “all data concerning the manufacture or utilization of atomic weapons, the production of fissionable material, or the use of fissionable material in the production of power” in the hands of a carefully vetted few.
In the context of the early Cold War, this definition of “Restricted Data” might seem sensible. However, Wellerstein points out that it is in fact extremely far-reaching. Among other consequences, he writes, “the statute was open to the interpretation that nuclear weapons information is ‘born secret,’ no matter who or where the new information comes from”. In principle, scientists in other countries, including allies like the UK, could fall foul of it. Certainly, domestic scientists who unwittingly strayed into restricted territory (knowledge of what was useful for weapons was, naturally, also restricted) were likely to have their work declared off-limits by the newly created Atomic Energy Commission (AEC). Worse, the “Restricted” label was soon covertly extended to cover information that “might have an adverse effect on the position of the commission”. Most grievously, this included a series of experiments in the late 1940s in which US scientists injected terminally ill patients with plutonium without their knowledge or consent, to determine how quickly the body excretes radiation.
In the book’s later chapters, Wellerstein chronicles efforts by various individuals to cast light on this dark territory. One such individual, ironically, was US President Richard Nixon, who signed an Executive Order in 1972 disallowing “the use of secrecy to conceal errors or avoid embarrassment”. Another, more satisfyingly, was Hazel O’Leary, who in 1993 became the first woman and (so far) only African American to lead the Department of Energy (DOE), one of the AEC’s successors. Under her tenure, the department declassified more information than it had in the entire previous history of the DOE and its predecessors – including information on the unethical plutonium experiments and their role in setting occupational health limits for radiation exposure.
The more the authorities tried to keep bomb designs out of view, the more attention they drew to them
Ultimately, though, Wellerstein shows that the US nuclear secrecy edifice cracked less through individual efforts than through a high-stakes version of the Streisand effect – where attempts to hide information end up generating more interest in it. Beginning in the cynical 1970s and extending through to the conspiracy-minded present, the more the authorities tried to keep bomb designs, stockpile numbers and so on out of view, the more attention they drew to them. While many secrets still exist, Wellerstein argues convincingly that their preservation is a matter of great tension for the US, which remains in this respect – as in so many others – “a simmering mix of high-minded idealism and ugly, fearful power”.
Have you ever wondered what a black hole “sounds” like? The Belgian mathematician, lecturer, and electronic musician Valery Vermeulen has created an album of electronic music that was composed using data associated with black holes. Collaborating with the cosmologist Thomas Hertog and physicist Matthias Kaminski, Vermeulen selected data from simulation models of astrophysical black holes as well as gravitational-wave observations of the objects.
According to the composer’s studio, Vermeulen has bridged the fields of mathematics and music by designing, “bespoke data sonification systems to create otherworldly expansive soundscapes, that guide us into the higher dimensional realms of deep space and reality”.
The album is called Mikromedas AdS/CFT 001 and it will be released by the London based record label Ash International in December 2021.
Pop-up book
Vermeulen is not the only person listening to black holes. The physicist Mariela Massó Reid and children’s literature expert Dimitra Fimi – both at the University of Glasgow – have teamed up to write a pop-up book called Listen to the Universe.
Aimed at children in Hingoli district of Maharashtra in western India, the book is a conversation between a girl and boy (Lila and Gopu) about the LIGO gravitational-wave detector that is planned for the area. In the book, Lila explains gravitational waves to Gopu, starting with Einstein’s suggestion of their existence in 1915.
“We were incredibly excited when formal approval for the building of LIGO–India came from the Indian Prime Minister in 2016,” says Massó Reid. “However, we were also very conscious that a large observatory was going to be built close to many rural communities. Our initial aim was to introduce and explain the purpose of these large instruments to local people.”
Massó Reid adds that the authors aimed their book at young children “to inspire girls and boys to realize that they can be anything they want – and that girls can be astrophysicists”. They also hope that parents will read the book along with their children and learn about LIGO–India.
The book is illustrated by British illustrator Oliver Dean. It is written in Marathi, the language of the region, and was written in consultation with scientists working on LIGO–India. 1000 copies of the book have been printed initially and there are plans for translations into other languages.
An improved search for a potential fifth force of nature is one of a trio of new results gleaned from observations of neutron interactions in silicon made by an international team of physicists. The work, which relies on Pendellösung interferometry, also takes a precise look at silicon’s thermal properties and provides a new, independent value for the neutron’s charge radius.
Scattering particles such as X-rays, electrons or neutrons off samples of crystalline materials has for decades provided scientists with valuable information on atomic structure. Quantum mechanics tells us that those particles also behave like waves, and it is the interference between waves deflecting off different points in a crystal lattice that reveals properties such as interatomic spacing.
Straightforward particle scattering has its shortcomings, however. For example, the thermal motion of atoms within crystal samples continually changes the lattice spacing and hence the interference patterns that are created. The consequent loss of accuracy could become a problem when studying silicon and other semiconductor materials at the level needed to understand the behaviour of novel devices operating close to the limits imposed by quantum mechanics.
Standing waves
In the latest work, Benjamin Heacock of the National Institute of Standards and Technology (NIST) in Gaithersburg, Maryland and colleagues in the US, Japan and Canada have better characterized this thermal motion using Pendellösung interferometry. This technique exploits the standing waves created when neutrons enter a sample and interact both with individual atoms ahead and the layers of atoms above and below. Interference between the two sets of standing waves produces oscillations of diffracted intensity whose characteristics reflect the forces experienced by the neutrons as they travel through the crystal.
Pendellösung interferometry was first demonstrated back in the 1940s and has since been implemented using X-rays to measure the density of electrons in silicon. However, the technique’s precision when using neutrons has been limited, partly because neutron sources have lower fluxes than those of X-rays and partly because machining techniques needed to make samples flat also introduce strain.
Heacock and colleagues have found they can minimize strain through the use of modern machining techniques pioneered at the RIKEN Centre for Advanced Photonics in Japan. They were also able to relax the flatness requirement by characterizing samples using what is known as a perfect-crystal neutron interferometer – putting their scheme into practice using cold neutrons from a beamline at NIST’s Center for Neutron Research in Gaithersburg.
Independent vibrations
The researchers used their data in part to better understand how thermal dynamics in silicon can affect X-ray diffraction measurements. As they point out, neutrons provide information complementary to X-ray data. This is because unlike X-rays, which interact with atomic electrons, neutrons interact with atomic nuclei — and because neutrons penetrate more deeply into crystals. The team found that some models based on X-ray data underestimate the size of thermal vibrations. They also discovered that nuclei and their associated electrons may not vibrate as one – as had been previously assumed.
Beyond these data specific to silicon, the researchers also gained new insights into two (real or presumed) universal parameters. One of these is the neutron’s electrical charge radius. Although the neutron is a neutral particle overall, its quark structure confers a slight imbalance in the charge distribution – resulting in a fractionally higher concentration of positive charge near its centre and more negative charge on its edge. The charge radius is the distance between these two points.
As the researchers explain, the inside of a silicon crystal provides an ideal environment to measure this radius given the huge electric fields created by the collection of charges in close proximity to the neutron. Their neutron measurements yielded a mean square charge radius of -0.1101±0089 fm2, which is slightly less precise than the leading values from established experiments that measure neutron transmission through lead or bismuth targets. But they say that their work involves completely different systematic uncertainties and therefore provides an independent measurement – which is particularly valuable, they argue, given a slight inconsistency among existing results.
Fifth force of nature
Perhaps most eye-catching of all, however, are the new bounds that the experiment places on a possible fifth force of nature. Such a force would represent a break with the Standard Model of particle physics, which includes the electromagnetic and strong and weak nuclear forces, but which is widely considered incomplete by physicists owing to outstanding major problems – such as the incompatibility of quantum mechanics and general relativity, as well as the existence of dark matter and dark energy.
No such force has yet been observed but it could potentially take many forms. The generic form probed by Heacock and colleagues is a modification of gravitational interactions known as a Yukawa potential. With their neutron data, the researchers were able to decrease the range of possible interaction strengths at distancebetween 10-8–10-11 m by around an order of magnitude compared to previous experimental searches.
Independent experts are enthusiastic about the latest results, with Tamaki Yoshioka of Kyushu University in Japan describing the new-look Pendellösung interferometry as a “very powerful” research tool. Michael Snow of Indiana University Bloomington in the US, meanwhile, reckons there is “still plenty of room” to make the technique more sensitive to possible fifth forces and to develop new kinds of measurements with slow neutrons.
The researchers’ next step is to measure Pendellösung interference over a wider range of symmetry planes within crystals, with the aim of reducing experimental uncertainties by up to a factor of five – in both silicon and germanium. They also have plans for a cryogenic version of their experiment to probe the quantum ground state of atoms. This, they say, could prove particularly fruitful for silicon, given how its quantum ground state determines the material’s electrical properties and anomalous thermal expansion at low temperatures.
In recent years, health and fitness wearables have gained popularity as platforms to wirelessly track daily physical activities, by counting steps, for example, or recording heartbeats directly from the wrist. To achieve this, inertial sensors in contact with the skin capture the relevant motion and physiological signals originating from the body.
As wearable technology evolves, researchers strive to understand not just how to track the body’s dynamic signals, but also how to simulate them to control artificial limbs. This new level of motion control requires detailed understanding of what is happening beneath the skin, specifically, motion of the muscles.
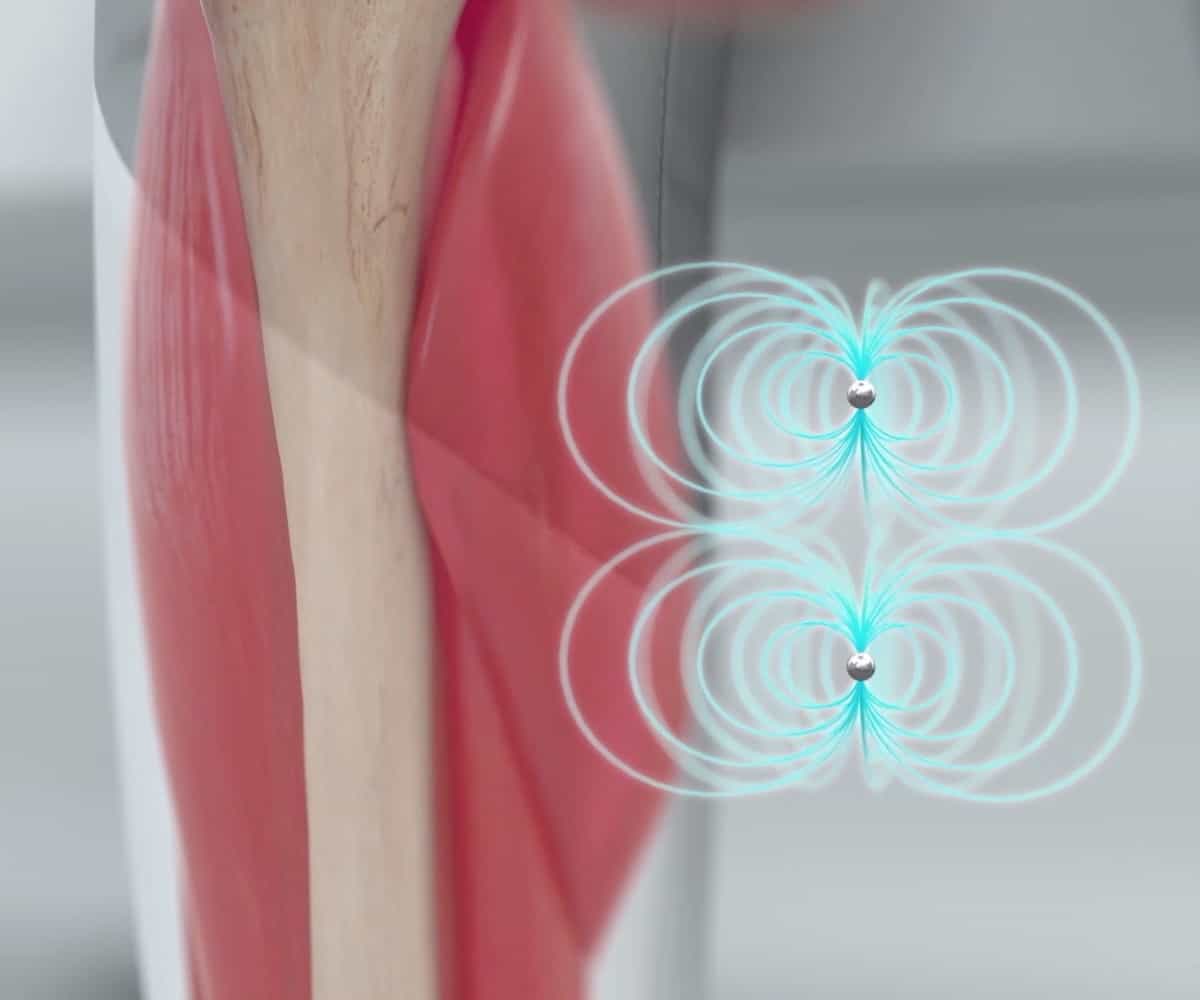
Skeletal muscles are responsible for almost all movement of the human body. When muscle fibres contract, the exerted forces travel through the tendons, pull the bones and ultimately produce motion. To track and use these muscle contractions in real-time and with high signal quality, engineers at Massachusetts Institute of Technology (MIT) employed low-frequency magnetic fields – which pass undisturbed through body tissues – to provide accurate and real-time transcutaneous sensing of muscle motion. They describe their technique in Science Robotics.
Magnetic monitoring: Low-frequency magnetic fields are not disturbed by materials such as silicone, carbon fibre or the human body, and allow transcutaneous tracking of muscle length. (Courtesy: MIT Media Lab/Cameron Taylor/Vessel Studios)
Engineers at the MIT Media Lab implanted pairs of tiny magnetic beads into the leg muscles of four turkeys and applied a mechanical frequency sweep to create leg motion. An external array of magnetic field sensors tracked the spatiotemporal changes in muscle length when the turkey moved.
This real-time magnetic tracking strategy, called magnetomicrometry, demonstrated a submillimetre tracking precision of around 37 µm – comparable to the current gold-standard method for tissue position measurements.
“We are currently studying the use of magnetomicrometry in a mobile context to verify that motion of the sensor array (relative to the muscle frame as well as to the world frame) does not cause any unexpected issues with the tracking,” explains lead author Cameron Taylor, a postdoctoral associate at MIT Media Lab.
Inside the body – biocompatible magnets
Using a minimally invasive percutaneous injection, the team implanted pairs of 3-mm diameter magnetic beads at different locations within the animals’ leg muscles. The bead pairs were strategically placed at least 21.5 mm apart to prevent bead migration caused by pulling forces when two magnets are in close proximity.
This cut-off distance can be determined empirically for a given bead size and magnetization strength to reduce the migration risk and increase safety.
Before implantation, all magnets were coated with a biocompatible and corrosion-resistant polymer to mitigate the risk of infection or foreign body reactions. Twenty-seven weeks after implantation, harvested tissue revealed no adverse reactions to the presence of the magnetic beads.
Outside the body – tracking array
To monitor muscle movements, the team mounted a portable 96-sensor array externally on the turkeys’ legs. The array captures spatiotemporal changes in the surrounding magnetic field caused by changes in the relative distances between magnetic beads during motion. A time derivative of the magnetic bead distance yields the velocity, and a linear transformation gives the local strain in the muscle, both key control parameters during prosthetic manipulation.
The tracking accuracy is highly influenced by the number of sensors, the subcutaneous sensing depths and the strength of each magnet. The researchers note, therefore, that a balance between sensor size, which impacts portability, and accuracy must be maintained for successful wireless sensing.
Combining magnetomicrometry with exoskeletal control can potentially impact many people undergoing physical therapy and rehabilitation. “A person with injured or weak muscles, for instance, could have pairs of magnets implanted in those muscles for the control of an exoskeleton that restores or augments their strength,” Taylor tells Physics World.
Robotic control: A pair of magnetic beads implanted in line with the muscle fibre orientation to track muscle length can be used to control a robotic ankle. (Courtesy: MIT Media Lab/Cameron Taylor/Vessel Studios)
In this episode of the Physics World Weekly podcast, the cosmologist and theoretical physicist Laura Mersini-Houghton of the University of North Carolina at Chapel Hill joins us to talk about big questions in cosmology such as why did the universe come into existence and what, if anything, existed before the Big Bang?
From the very big to the very small, our second guest is the electrical engineer Justus Ndukaife, who uses nanophotonic plasmonic tweezers to manipulate objects that are too tiny to be held by optical tweezers. Based at Vanderbilt University, he explains how the technology could be used in a wide range of applications from cancer diagnoses to quantum computing.
Laura Mersini-Houghton will be debating the origins of the universe at the How the Light Gets In festival in London later this month.
Video-speed switching of structural colour has been achieved by researchers at Chalmers University of Technology in Sweden and the UK’s University of Cambridge. The technology could be further developed to create low power video displays.
The team, led by Andreas Dahlin, created their reflectance-based digital displays by controlling structural colour and broadband switching in a conductive polymer. The devices could offer an eye-pleasing and low-energy alternative to light-emitting displays.
Easy to view
Electronic paper is easy to view and uses little energy because it works by reflecting ambient light rather than by emitting its own light. However, the technology currently has limited colour range and low switching speed. As a result, it is used in applications such as ebook readers and labels where speed and visual impact are not required.
In a conventional colour display, the wide spectrum of projectable colour arises from the combination of subpixels that emit red, green and blue (RGB) light. One way forward for creating colour in electronic paper could be to use structural colour to create RGB subpixels.
Structural colour arises from the wavelength-specific reflection of light from nanostructured metamaterials. This is different to conventional colour, which arises from the absorbance of light by dyes. As a result, structural colour is ideal for creating coloured subpixels.
RGB and gold
Dahlin and colleagues created metamaterials consisting of ordered nanoparticles on top of thin alumina or aluminium films, that are then coated with an ultrathin gold layer. The resulting nanostructures have a large surface area and enhanced optical contrast. The structures are then coated with an opacity-changing conjugate polymer top layer, which is used to control brightness and visibility. While it is possible to fabricate the nanostructures on flexible substrates, the team’s research focused on devices based on glass substrates.
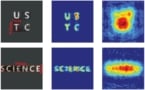
The resonance of light in the structure causes the reflectance of RGB light, with no need for energy-intensive light-emitting components. By adjusting the thickness of the gold layer and the underlying thin film, the high intensity RGB colouration can be seen from any angle. This is shown in the top figure, which is a magnified image of the subpixels.
Polymer shutters
To control the display, the opacity of the conjugated polymer covering individual subpixels can be changed from black to transparent to create the desired colour image. The polymer is black in its polymerized state and transparent when its monomers are oxidized. Switching between the two states is done using an electrical current in a process called electropolymerization, which involves the transport of ions within the polymer.
Colourful scene: image reproduction using RGB pixelated metasurfaces. (Courtesy; Andreas Dahlin/Xiong 2021 Advanced Materials 2103217)
By regulating critical parameters in the switching operation – including the switching voltage, choice of ions, ion movement and monomer oxidation – the researchers achieved a switching speed of 10–50 ms. This speed combined with good optical contrast would not have been possible without using metamaterial nanostructures for structural colour because they significantly aid ion mobility.
Previous devices that used electropolymerization have much longer switching times, which cause unwanted reactions that degrade the polymer shutters. This is not a problem with the new devices, which can switch more than ten million times with no loss in contrast. The energy needed for switching is only 7 mW/cm2, which is even lower than for efficient OLED displays. What is more, because the device is stable between switches, the device needs miniscule energy to maintain a static image.
While the team has yet to build a fully functioning display using their technology, as a proof of concept they used lithography to pattern subpixels to display a full-colour digital photo, as shown in the second figure. The next step for Dahlin and colleagues is creating a functional display, and this will involve integrating transistors that will control the individual switching of the subpixels. The team is also searching for more efficient ways to produce the metasurfaces by wasting less gold.
The interstellar medium (ISM) of gas and dust between the stars seems surprisingly patchy, with large areas missing lots of heavy elements, according to new research published in Nature. This could have repercussions for how we interpret the history of the galaxy and its chemical evolution, although not all astronomers agree with the findings.
The ISM is made primarily of hydrogen and helium, but is laced with what astronomers refer to as “metals” – that is, all elements heavier than helium, to distinguish between the primordial elements formed in the Big Bang and elements forged later by stars.
It had been expected that the metallicity – the abundance of heavy elements – of the ISM in the Sun’s neighbourhood would be about the same as that of the Sun itself. However, measurements of the ISM’s metallicity are complicated by the presence of dust grains that can lock metals inside them, hiding those metals.
To get around this, astronomers led by Annalisa De Cia of the University of Geneva used a two-pronged approach.
“Measuring the relative abundances of one element with respect to another was the key to estimating how much of these elements are locked up in the dust,” De Cia tells Physics World.
De Cia’s team observed 25 of the hottest, brightest stars, ranging from 200 to 9000 light-years away, using the Space Telescope Imaging Spectrograph on the Hubble Space Telescope. The light from these stars is partially absorbed by gaseous elements in the intervening ISM along the line of sight, and the strength of the resulting absorption lines tell us the abundance of different elements in the ISM.
The metal universe
Metals come in different abundances. For example, there should be more iron than zinc in the universe, since iron is produced in greater quantities by supernovae. De Cia’s team measured the abundances of different metals in the gaseous part of the ISM, and then compared these data to the expected relative abundances. Deviations from those relative abundances could then be attributed to dust depletion, with some metals such as iron and titanium being more prone to being locked up inside dust.
To double check the results, De Cia’s group then employed a second, independent measure of metallicity. This determines the overall amount of dust depletion using a different tracer to quantify dust, and then compares that to the abundances of the metals in the gaseous part of the ISM.
Putting it all together, the team found that the ISM’s metallicity is inhomogeneous on scales of tens to hundreds of light-years, with some regions having ten times more metals than others. Combining the results suggests that the average metallicity of the ISM in the Sun’s neighbourhood is just 55±7% of the Sun’s metallicity, with some parts of space as low as 17%.
De Cia attributes these variations to massive, in-falling clouds of pristine hydrogen gas that drop onto our galaxy from intergalactic space. Such clouds have been observed many times before, and are the leftovers of the formation of the galaxies. It had been assumed that such clouds would be efficiently mixed into the ISM, but De Cia’s results suggest otherwise.
Esteban López has been an author on several papers that have used star-forming regions (known as H II regions, because they are filled with ionized hydrogen) to measure the metallicity of the galactic disc at different distances from the galactic centre. Their results imply that any variations in the metallicity of the ISM in the galactic disc are fairly small.
“Our data do not support such large inhomogeneities,” says Esteban López, who attributes these different conclusions to the assumptions made in the different methodologies, as well as arguing that the metallicity values obtained from the H II regions are “far more direct and give the most robust results, based on relatively simple and very well checked methods. Dust depletion is not a concern in our results.”
De Cia responds by pointing out that H II regions are full of dense, ionized gas that has already been processed by stars, and therefore represents a “small, special portion that is not enough to reflect all the complexity of the ISM” whereas “the neutral gas where we found the large inhomogeneities is more diffuse and extends to much larger scales”.
Changing galactic history
If the new results from De Cia’s team are correct, then it would have profound implications for models of the galaxy’s star-forming history and the chemical evolution of the Milky Way, and others.
“One could imagine that a different composition of the gas could affect the way that stars can form from gas,” says De Cia. “And different compositions of the stars could affect what other elements will be further produced.”
This could lead to stars having formed relatively close to the Sun, but with a lower metallicity. Indeed, something similar has already been observed, says De Cia, citing results from as long ago as 1993 that indicate a large scatter in the metallicity of stars of the same age. In turn, it may even be more difficult to form rocky planets if the amount of available metals is too low.
Look towards the Sun during a total solar eclipse (taking proper precautions of course) and you’ll see a beautiful, crown-shaped glow surrounding the Moon. It’s the solar corona – a hot plasma that extends millions of kilometres out into space. This region is a million times dimmer than the solar surface beneath, yet, strangely, it’s at least 1 million kelvin hotter. Seven decades after the unexpected observation was first made, it’s still one of the biggest mysteries in astronomy.
From images carved into ancient stones in places like County Meath, Ireland, it seems that people recorded the appearance of the solar corona at least 5000 years ago. But how do we know anything about the corona given that eclipses occur so rarely – barely a few minutes per year – and then only at specific geographic locations? For what we do know, we can thank the French astronomer Bernard Lyot, who in the 1920s developed a device that can create “artificial eclipses” inside specially adapted telescopes. By blocking out the extreme brightness of the Sun, this device, known as a coronagraph, allowed astronomers to study the corona for hours, rather than minutes, every year.
In fact, in 1943, using data taken during solar eclipses and with coronagraphs at other times, the Swedish physicist Bengt Edlén was able to determine the origin of certain, mysterious spectral lines from the Sun. These, he realized, are emitted when ions of iron and other heavy elements that have been stripped of at least 10 electrons collide with electrons in the corona heated to temperatures of 250,000 K. This estimate was later revised upwards to 106 K and above. It was a bold claim and some researchers initially struggled to accept the implications because it meant that energy must be flowing from the “cool” 6000 K surface of the Sun into the hotter corona – seemingly in violation of thermodynamics. So began the ongoing, seven-decade search for the non-thermal mechanisms by which energy from the Sun is transported and dissipated to the corona.
Intriguingly, these scientific studies took on a wider political importance during the Second World War. That’s because the corona emits highly variable charged particles, magnetic fields, X-rays and extreme ultraviolet (EUV) light, which can cause troublesome variations in the structure of the Earth’s ionosphere and trigger “radio blackouts”. Keen to ensure the smooth running of military communications, both Axis and Allied scientists began deploying novel coronagraphs to try to anticipate when these blackouts might occur.
After the war, Richard Tousey of the US Naval Research Laboratory even explored UV and X-ray emissions from the Sun using instruments flown on V2 rockets captured from the Germans. But it was not until 1973, when NASA launched its SKYLAB space laboratory – built inside a command module left over from the Apollo lunar missions – that solar EUV and X-ray wavelengths were routinely acquired.
These measurements proved pivotal to our understanding of the corona. As the US astronomer Leo Goldberg from the Kitt Peak National Observatory wrote in the foreword to A New Sun – John Eddy’s 1979 book of SKYLAB’s achievements: “Especially illuminating has been the recognition of the extent to which the Sun’s magnetic field is responsible for the structure, dynamics and heating of the Sun’s outer layers”.
Many space missions since SKYLAB have extended our measurements of the corona beyond EUV and X-ray wavelengths, yielding details of the even-higher-energy gamma radiation it emits. A particularly important role has been played by NASA’s Solar Dynamics Observatory satellite, which has been travelling in a geostationary orbit around the Earth since 2010. Its 17 megapixel camera gives us a brand new image of the corona once a second, 24 hours a day, seven days a week.
With so much information to hand, why are we still arguing over the reason why the corona is so hot?
Today, hundreds of scientists are pondering the vast quantities of data we have of the solar corona. Armed with ever more powerful numerical capabilities, they are seeking to finally understand how the corona and magnetism interact. But with so much information to hand, why are we still arguing over the reason why the corona is so hot? How, in other words, does energy from the heart of the Sun get transported and dissipated above the visible surface?
An enduring problem
Ask a group of astronomers what heats the solar corona and you’ll be surprised by how many different answers you’ll get. Some might say “magnetic energy”. Others “Alfven waves” or “nanoflares”. Yet others will talk about “turbulence”, “ion cyclotron waves” or “magnetic reconnection”. In fact, almost one article about the solar corona has been published per day since 1943.
The stage upon which this mystery plays out is straightforward. Nuclear fusion in the heart of the Sun generates energy, of which a tiny fraction (less than 0.001%) ends up as “free magnetic energy”. A concept developed in the 19th century by the German physicist Hermann von Helmholtz, free magnetic energy is a reservoir of “ordered” energy that can be converted to less ordered forms. This free energy somehow gets transported and dissipated as heat above the Sun’s visible surface. But like catching a burglar emerging red-handed from a window with a bag of loot, we can’t easily observe the action and identify the suspected mechanism(s).
New views of the Sun NASA’s Solar Dynamics Observatory has been monitoring the Sun’s corona since 2010. Shown here is the Sun pictured at extreme ultraviolet wavelengths on 10 August 2018, superimposed with the magnetic-field lines calculated by computer models. The high concentration of field lines (centre) correlates with a bright, active region, while the lack of lines (top) shows a coronal hole, showing that magnetism drives the dynamic activity near the Sun’s surface. (Courtesy: Solar Dynamics Observatory, NASA)
In one sense, finding what heats the corona is easy. After all, less than 0.001% of the Sun’s entire power is required to sustain the corona and all of it is carried by convective motions just under the surface. But precisely because so little is needed, almost any mode of magnetic-energy transport could sustain the corona, making it tricky to rule out theoretical ideas. As one astronomer joked, “With so many ways to heat the corona, why is it so cold?”
The next challenge arises because the Sun is a plasma: a hot, ionized gas containing free ions and electrons. Like water or any other fluid, the plasma is subject to many nonlinear interactions. Changes in velocity, for example, depend on the velocities themselves, making the flow of the plasma fiendishly difficult to describe. But the corona also has complex nonlinearities arising from the fact that plasma is made up of charged particles.
No large-scale electric fields are sustained in plasma blobs because electrons quickly move to “short out” long-lived electric fields, but magnetic fields can penetrate the corona (there being no “magnetic monopoles” that could short them out). These fields exert a Lorentz force on the moving fluid, altering its bulk velocity and internal electric currents, which in turn modify the magnetic field. Cause and effect become thoroughly confused.
The study of the dynamic behaviour of magnetic fields in an electrically conducting fluid such as a plasma was initiated in 1942 by the Swedish physicist Hannes Alfvén, who dubbed it “magneto-hydrodynamics” (MHD). Alfvén went on to win the 1970 Nobel Prize for Physics for his work on MHD, which film enthusiasts might remember as the power behind the fictional submarine-propulsion system in the movie The Hunt for Red October. But as Alfvén realized, the freed electrons also lead to non-local effects.
He calculated that in the ideal limit of zero electrical resistance, moving blobs of fluid always belong to a particular set of magnetic lines of force. As they move along those lines, the blobs trace out in time a tube-like structure. But because the blobs can’t cross field lines no matter how the fluid moves, the tubes must maintain their topology. Two tubes that aren’t interlinked, for example, can’t suddenly be made to thread one another.
Alfvén’s insight is crucial because the plasma in the solar corona behaves in this almost ideal fashion – except, that is, on very small scales where non-ideal effects involving ions, electrons and their dynamical interactions kick in. In fact, because ideal plasmas have no dissipation, any model for coronal heating must generate dissipation on these tiny scales. In the solar corona, our concept of plasma as a fluid breaks down on the smallest scales.
Simulations suggest that dissipation occurs on a scale of about 100 m at which the constituent ions and electrons can behave separately. On this scale, known as the “ion inertial length”, the plasma no longer behaves as a single fluid, as assumed in MHD. To find out what is going on, researchers instead have to solve “kinetic” equations, derived from Ludwig Boltzmann’s transport equation, that describe the coupled motions of particles and electric and magnetic fields.
Calculations and observation
You might wonder why we can’t just solve the mystery of the solar corona numerically. Surely cranking through the numbers on a supercomputer can yield answers? It’s true that numerical experiments can address various aspects of the problem that can’t easily be studied in the lab (a plasma-filled tokamak being used to generate fusion power, for example, will never approach the near-ideal solar-corona conditions). Unfortunately, even the best computers don’t have enough memory to tackle the enormous range of scales involved.
To get a sense of the problem, consider the “active regions” on the corona – groups of dark sunspots accompanied by brighter areas that come and go over an 11-year timescale. To capture the transfer of energy via dissipation on the 100 m kinetic scale within a 50,000 km active region, you would need about 1017 cells, which is impossible with current computers.
Colourful corona This image shows a part of the solar corona observed over an active region using the Atmospheric Imaging Assembly (AIA) on NASA’s Solar Dynamics Observatory on 12 July 2017. It is a composite of extreme-ultraviolet light emitted by highly ionized atoms in the corona at temperatures of 5 million kelvin (red), 1–2 million kelvin (blue) and 0.8 million kelvin (green). The various structures are created by coronal plasma trapped by the Sun’s magnetic fields. The origin of such high coronal temperatures is still a mystery. (Courtesy: CC BY-SA 4.0/Lpchitta)
This issue is often side-stepped using the qualitative theory of fluid turbulence developed in the mid-20th century by the Soviet physicist Andrey Kolmogorov, in which energy in fluid motions naturally cascades from large to small dissipative scales, following a universal law. Viewed in this way, the problem was “solved” by the Scandinavian physicists Boris Gudiksen and Åke Nordlund in 2005, who used just 3.375 million cells. But is their invocation of Kolmogorov’s argument correct? The jury is still out.
You might also wonder whether we can’t just take better data. The problem is that our best images of the Sun to date have a resolution of just 200 km. To capture both transport and dissipation in action, we’d need a 45 m-diameter space telescope operating at EUV wavelengths (about 50 nm) coupled to a camera with 400 times more pixels than the largest ever built. That’s just not on the cards any time soon.
The story is further complicated by the fact that electrons conduct heat so well. If there happens to be a local burst of heating, they re-distribute that heat over thousands of kilometres to cooler, far-off parts of the corona. It’s as if our burglar has quickly covered their tracks, moving evidence far from the original crime scene and disguising it.
The good news is that astronomers have a great track record of using the laws of physics to solve seemingly intractable problems, such as the evolution of elements in our solar system. I am confident that physics can track the problem of the corona too, with much progress having been inspired by an ingenious thought experiment developed in 1972 by the US astrophysicist Eugene Parker from the University of Chicago. Using the MHD equations of motion in the limit of zero resistance, Parker and many other researchers since then have developed a novel picture of the corona.
Parker’s piano
Parker imagined a long, straight volume of plasma entering the corona, with a nearly uniform magnetic field (figure 1a). Now waggle or twist the cylinder from side to side at its base. The magnetic fields that are subject to this motion will exert a tension on the plasma, sending waves along it like a piano wire. The density of the plasma at any location in the cylinder will depend on the precise details of the convection-magnetism interaction that formed it.
1 Understanding the corona Inspired by ideas from the US astronomer Eugene Parker, these diagrams show how large-scale motions within the solar corona can dissipate energy at small scales (shaded regions). Imagine here a straight set of ‘open’ magnetic field lines emerging from the solar surface (a) being subject to sideways motion (b), with neighbouring parts of the corona with different densities quickly getting out of phase, dissipating energy sideways at small scales by a kind of friction. In the case of field lines (c) that double-back to the solar surface – so-called ‘plasma loops’ – these are straightened out in Parker’s model, like piano wires attached and fixed at both ends (d). When rapid motions across the surface A induce resonances in the wave motions, then small scales (shaded areas) can develop owing to resonant absorption (e) or by so-called ‘tangential discontinuities’ forming at the tangled surfaces between more slowly moving field lines (f). In the latter case, this gradually builds up energy and leads to the creation of ‘nano flares’. With a billionth of the energy of ordinary solar flares, these flares are currently being hunted down by astronomers.
According to MHD, these so-called “Alfvén waves” travel more slowly when plasma densities are higher, just as waves on denser piano wires move more sluggishly and have lower notes than on lighter, thinner wires. As these waves move upwards, neighbouring fluid blobs of different densities quickly get out of phase (figure 1b). Their wave energy can then be readily dissipated in a sideways direction by a kind of friction, like bringing two adjacent piano wires too close together.
Over the years, researchers have developed an entire class of models of coronal heating based on this concept. Many believe that this is how magnetic energy – drawn out by the solar wind – gets transported and dissipated into interplanetary space. The notion can even be used to describe strange, dark patches of the corona that were discovered in SKYLAB data. These “coronal holes”, which live from weeks to months, can cover as much as 10% of the solar surface.
The solar magnetic fields here can be pictured as cylinders bent smoothly so that both ends are attached to the heavier, surface plasma (figure 1c). To make calculations of coronal heating easier, however, Parker imagined straightening out the cylinders again, like piano wires fixed at both ends (figure 1d). Waves sent from one end of the surface reflect off the other end, with the tube amplifying frequencies that match the appropriate natural frequency (just as piano wires amplify waves matching their natural frequency).
Such a picture (figure 1e) was developed mathematically in 1978 by the physicist James Ionson, who later rose to fame as head of research for Ronald Reagan’s proposed “Star Wars” missile-defence initiative. But can this MHD approach tell us what is happening in the corona at scales of 100 m or less? Apparently so, according to Peter Goldreich of Caltech and Seshadri Sridhar of the University of Toronto, who in the mid-1990s showed how oppositely directed Alfvén waves can lead to a turbulent cascade to small scales.
Parker noted, however, that most of the power in observable surface motions occurs on timescales of minutes, not tens of seconds as was needed in Ionson’s model. He therefore wondered what structure you get if these slower motions waggle and/or twist one end of the tube, while the other is kept fixed. The answer turned out to be as important as it was unexpected: unless surface motions are unnaturally well-ordered, you get sudden changes in direction between neighbouring magnetic tubes of plasma (figure 1f).
Known as “tangential discontinuities” (or TDs), these are sheets of electrical current that store free energy on small scales. As the sheets inevitably get thinner, the currents can be so big that instabilities and kinetic effects end up dissipating the slowly built-up energy even without having to invoke turbulence. Like a Shakespearean tragedy, the apparent purity of the theory leads to its own demise.
The hunt for nanoflares
Parker argued that the closed solar corona should release these currents in small bursts of energy, dubbed “nanoflares”, which have an energy of about 1016 J – roughly a billionth of a typical, large flare. Astronomers have been on the hunt for nanoflares ever since he predicted them in 1988 and every so often an article pops up claiming to have detected nanoflares – thus solving the heating problem. But such studies are at the limit of what we can detect, and they may be just a manifestation of (unobservable) smaller-scale structures associated with entirely different mechanisms.
Ultimately, the solution to the coronal-heating problem must come from observations of the Sun. But without accurate measurements of coronal magnetic fields, we cannot trace the energy flow and even massive solar flares leave behind only small changes in the magnetic field on the solar surface. Observers are left to examine the scene of a crime that has been confused and thoroughly cleaned up by heat conduction.
What we hope to find are some fingerprints, some smoking gun or some statistical patterns from observations to reveal the heating mechanisms. Unfortunately, nothing definite has so far appeared. A review published by Cristina Mandrini from the University of Buenos Aires and colleagues in 2000 listed an embarrassing 22 different models, none of which have yet been eliminated. To use the immortal words of Wolfgang Pauli, our models are “not even wrong”.
What we hope to find are some fingerprints, some smoking gun or some statistical patterns from observations to reveal the heating mechanisms
Still, it seems we have a basic understanding of coronal heating in both open and closed (loop) structures. But what about some of the other proposed suggestions for the solar-corona problem? One includes “ion cyclotron waves” – Alfvén waves at kilohertz frequencies in resonance with the helical motion of ions. Another is “magnetic reconnection” – whereby plasmas change their topology, allowing the magnetic field lines to diffuse from their original plasma, often leading to dramatic consequences such as solar flares and coronal mass ejections.
Magnetic reconnection is often dynamic and self-sustaining, but in MHD it cannot by itself lead to much heating, instead generating kinetic energy in outward flows of plasma as the magnetic fields seek a new equilibrium. It may, however, subsequently lead to significant plasma heating and is believed to power enormous flares. Indeed, numerical experiments have revealed that these reconnection processes can generate tiny, balls of plasma-containing magnetic bubbles that enhance local plasma heating. The “plasmoids” may, in turn, generate ion-cyclotron waves at kilohertz frequencies, which could heat the plasma, according to recent analyses of coronal spectral lines.
Final frontier
It’s clear that magneto-hydrodynamics can successfully describe the propagation, storage and development of small scales needed to dissipate free magnetic energy. However, we will need physics beyond this approximation to determine exactly how the magnetic energy gets converted into the random motions of particles in the plasma.
Coronal heating is a challenging yet fascinating topic that, I hope, future generations of researchers will be inspired to explore. And with lots of data coming in from NASA’s Parker Solar Probe and Europe’s Solar Orbiter – as well as the Daniel K Inouye Solar Telescope in Hawaii – there will certainly be lots to keep people busy for many years to come.