Researchers have made ferroelectric domain wall diodes from structures etched on the surface of an insulating single crystal. The new devices, which are made from a material that is already widely employed in optoelectronics, can be erased, positioned and shaped using electric fields and might become fundamental elements in large-scale integrated circuits.
Domain walls are narrow (roughly 10-100 nm) boundaries between regions of a material where the dipole moments point “up” and neighbouring regions where they point “down”. At these boundaries, the dipole moments undergo a gradual transition to the opposite orientation rather than flipping abruptly.
Technologies that exploit these structures in ferromagnets have come along considerably over the last 15 years, making it possible to construct devices such as racetrack memories and circuits that operate using domain-wall logic.Spurred on by these advances, some researchers have turned their attention to analogous domain walls in ferroelectrics – that is, materials that have permanent electric dipole moments in the same way as their ferromagnetic counterparts have permanent magnetic dipole moments. Ferroelectric materials hold particular promise for applications because their dipole moments can be oriented using electric fields, which are much easier to create than the magnetic fields used to manipulate ferromagnets.
New group of two-dimensional conductors
Ferroelectric domain walls have several useful properties. When made into ferroelectric devices like diodes, all the domain walls, regardless of their polarity, align in the same direction when an electric field is applied. The ferroelectric domain walls can therefore be reversibly created, erased, positioned and shaped using positive or negative voltages.
Researchers in the School of Microelectronics at Fudan University, China, have now developed a new way of constructing such diodes by using ferroelectric mesa-like cells that form at the surface of an insulating crystal of lithium niobate (LiNbO3). This material is already commonly used in many optical and optoelectronic devices, including optical waveguides and piezoelectric sensors.
Led by Jun Jiang and An-Quan Jiang, the researchers used electron-beam lithography and dry etching processes to fabricate cells that were 60 nm high, 300 nm wide and 200 nm long on the surface of the LiNbO3. They then connected two left and right electrodes made from platinum (Pt) to opposite sides of a cell for subsequent measurements.
When they applied an electric field across the material via the electrodes, they observed that the domain within part of a cell reversed so that it pointed antiparallel to a domain at the bottom of the cell (which remained unswitched). This led to the formation of a conducting domain wall.
Interfacial “imprint field”
The team controlled the conducting domain wall’s current (which can be as high as 6 μA under an applied voltage of 4V) using two interfacial and unstable (volatile) domain walls that they connected to the two side Pt electrodes. The researchers explain that these interfacial domain walls then disappear, turning off the wall current path after the applied electric field has been removed or under a negative applied voltage.
“We ascribe the rectifying behaviour to the volatile domains within the interfacial layers,” team member Chao Wang tells Physics World. “As we remove the applied voltage or reduce it to below the device’s onset voltage (Von), the interfacial domains switch back into their previous orientations thanks to the existence of an interfacial ‘imprint field’. This field does not exist in the bottom domain, which, as we remember, is non-volatile.”
Reporting its work in Chinese Physics Letters, the Fudan University team says it will now be focusing on optimizing the properties of its devices – namely their Von, their on/off current ratio and their stability.
The idea that a record of the Earth’s magnetic past might be stored in objects made from fired clay dates back to the 16th century. William Gilbert, physician to Queen Elizabeth I, hypothesized in his work De Magnete that the Earth is a giant bar magnet and that clay bricks possess a magnetic memory. This phenomenon – known as “thermoremanent magnetization” – now forms the basis of a well-established method for dating archaeological sites that contain kilns, hearths, ovens or furnaces.
Indeed, the study of these burnt materials containing magnetic minerals, found at archaeological sites, is known as “archaeomagnetism”. One of the aims of this field is to help geophysicists gain a better understanding of local changes that have occurred in the Earth’s magnetic field over the past 3000 years. And if we know how the field changed in the past, we could also get insights into our magnetic future.
We already know that the Earth‘s magnetic field has lost around 10% of its intensity over the last 150 years. “The dipole strength has been steadily decreasing at a rate such that, should it continue, in 2000 years the magnetic field strength would be zero,” says geologist Rory Cottrell of the University of Rochester in the US. “The thought is that the planet is headed for a magnetic field reversal.”
Data collected from magnetic records in rocks indicate that over the last 76 million years there have been 170 reversals in which the north–south polarity of the field has completely switched. And it seems that another event is overdue: a full reversal has happened, on average, every 200,000 years over the last 10 million years, and the last one was 780,000 years ago.
Even small changes in the Earth’s magnetic field can have far-reaching repercussions for the planet’s surface. That’s because the magnetic field acts as a shield, repelling and trapping charged particles from the Sun that would otherwise cause electrical grid failures, navigational system malfunctions, and satellite breakdowns. Strong solar winds already cause problems from time to time, notably in 1989 when a billion-tonne cloud of solar plasma breached the Earth’s magnetic field. This created electrical currents in the ground that caused an electrical power blackout across the entire province of Quebec, Canada. If the field weakens further, we can expect more such events, triggering major disruptions.
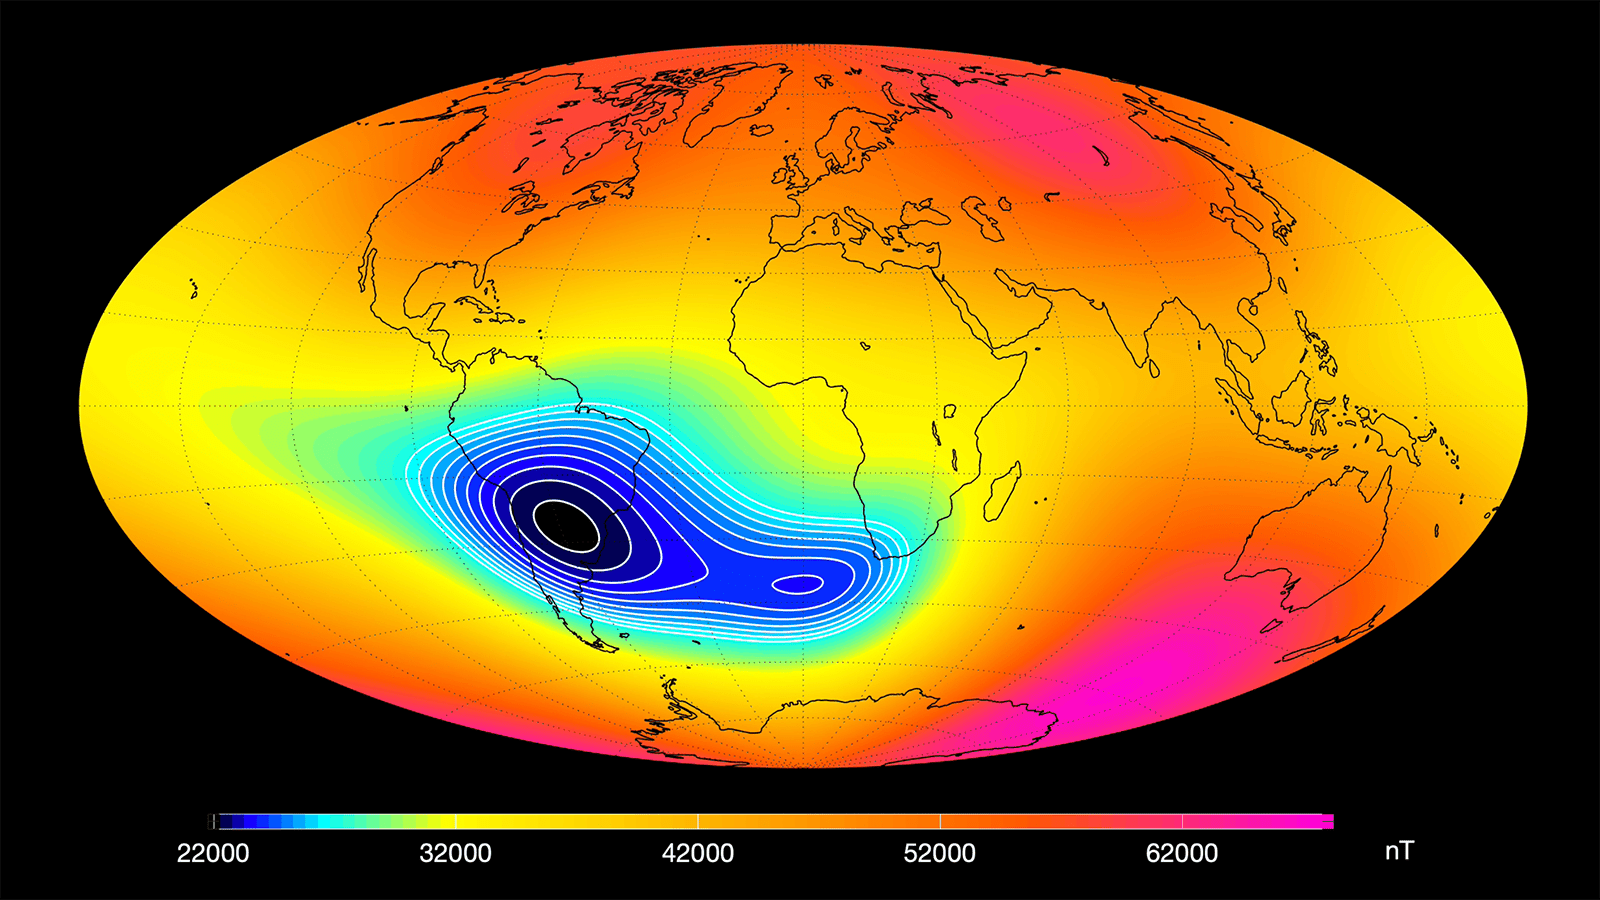
1 Strange anomaly The South Atlantic Anomaly is an area of weak magnetic field stretching from South America to southern Africa, captured here by the European Space Agency’s Swarm satellite constellation. The anomaly has been growing and intensifying over the last 200 years, which could mean that a reversal of the Earth’s magnetic field is on its way. To see if that might happen, geophysicists have been examining archaeological artefacts to try to decipher how our magnetic history has changed over the previous 3000 years. (Courtesy: Division of Geomagnetism, DTU Space)
A particular cause for concern is the South Atlantic Anomaly, an area stretching from Chile in South America to Zimbabwe in Africa, where the magnetic field intensity is much lower than the global average (figure 1). The magnetic field strength across this region can reach as low as 25 μT, compared with up to 67 μΤ for other parts of the Earth’s surface. “It’s low enough that incoming radiation is no longer deflected and it interferes with satellite transmissions,” says Vincent Hare, a geophysicist and archaeological scientist at the University of Cape Town, South Africa. What’s more, the anomaly has been growing and intensifying over the last 200 years or so, which could be yet another signal that a field reversal is on its way.
Measuring archaeomagnetism
To understand whether this localized anomaly might be a sign of more significant changes, geophysicists have been examining our planet’s relatively recent magnetic history. Unfortunately, direct observations of the Earth’s magnetic field have only been collected since the 1850s, and even then only in some locations. While magnetic information contained in rocks goes back millions of years, researchers have focused their attention on archaeological artefacts to reconstruct our magnetic history over the last 3000 years or so.
Clays or other materials containing magnetic minerals lose any magnetic ordering when they are heated above 570 °C, but then become imprinted with the Earth’s ambient magnetic field when they are cooled
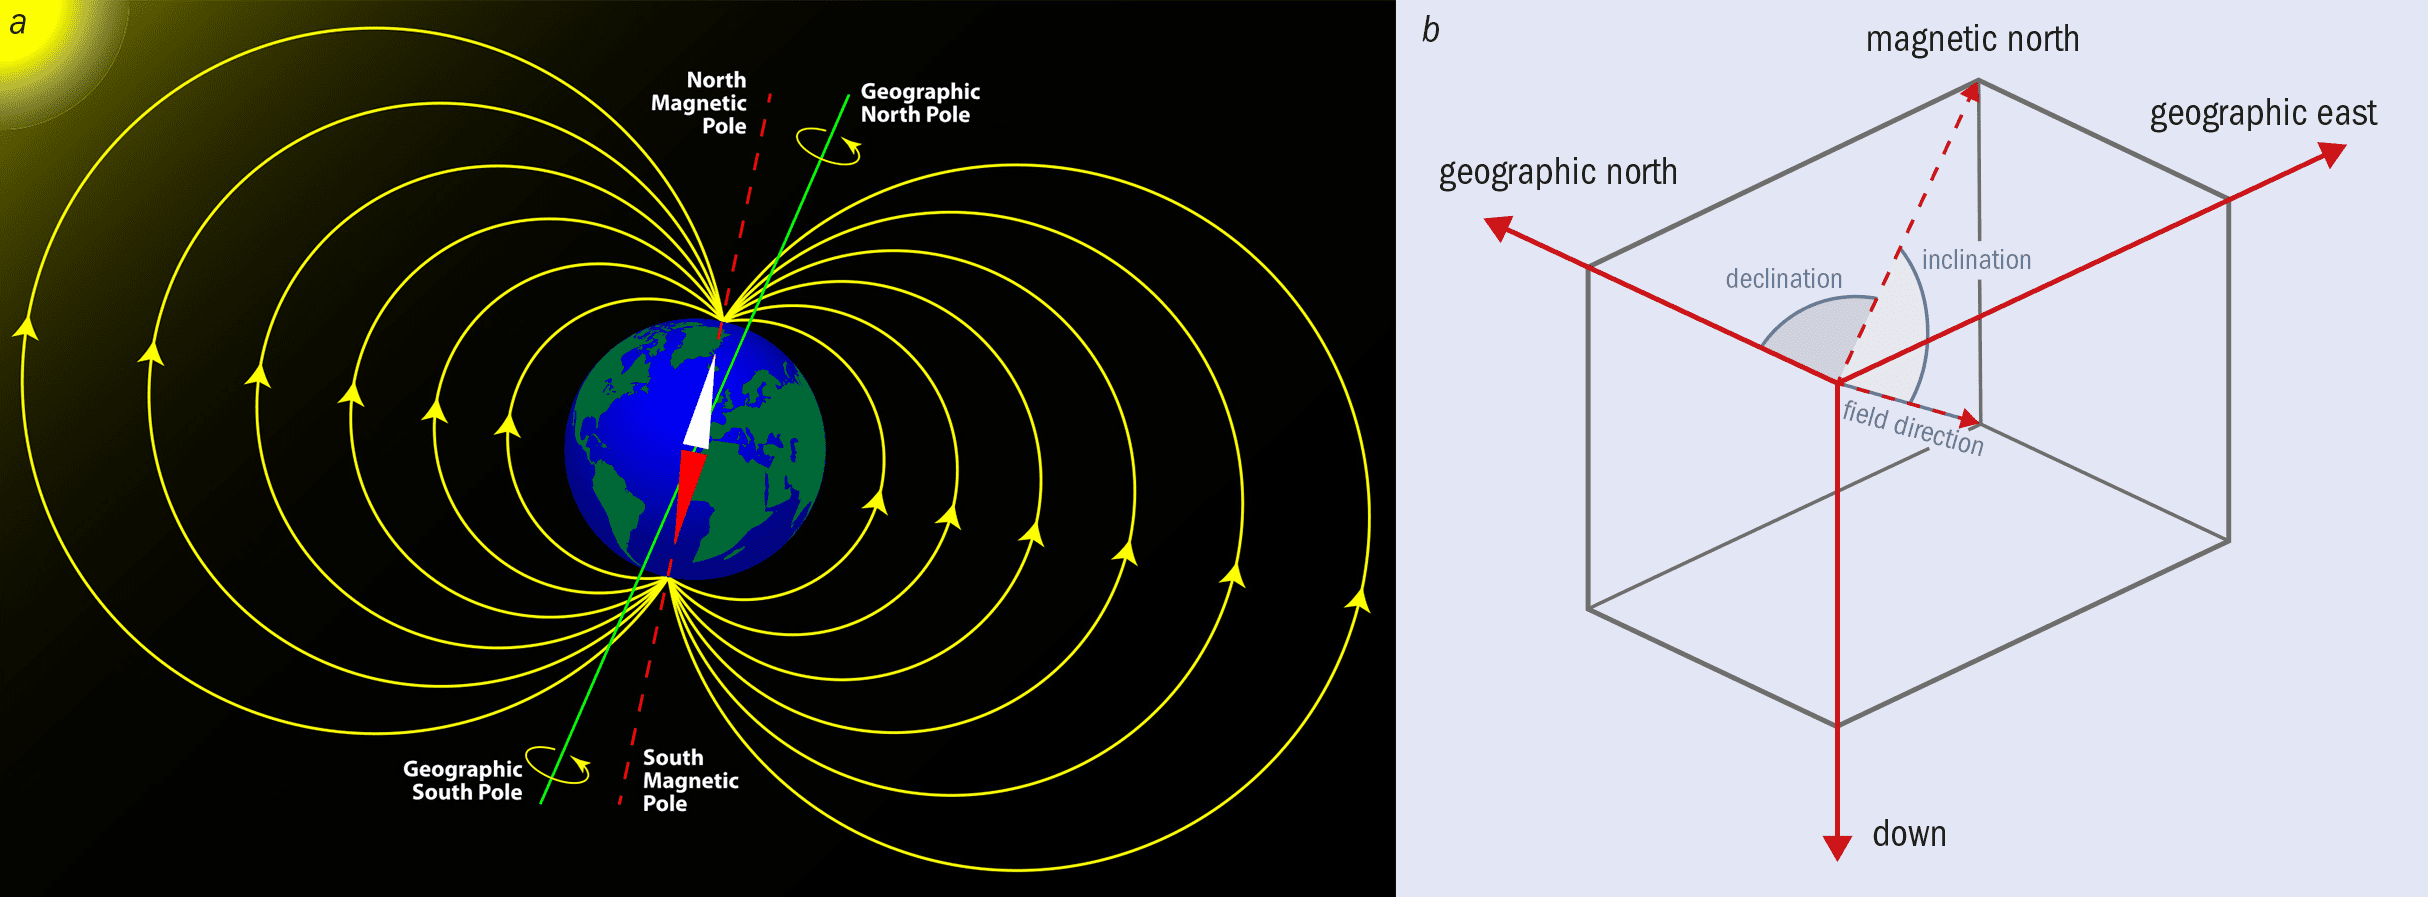
The field of archaeomagnetism relies on the fact that clays or other materials containing magnetic minerals – usually magnetite – lose any magnetic ordering when they are heated to above 570 °C (the Curie temperature). Indeed, the sample loses its net magnetization but when it cools back down below the Curie temperature, the particles remagnetize in the direction of the local magnetic field at that time. In this way, these archeological samples provide a snapshot of the Earth’s ambient magnetic field through different times and places in history. These samples can reveal both the intensity of the magnetic field and its direction, which is measured at any point on the Earth’s surface by the declination – the angle on the horizontal plane between magnetic north and true north (figure 2).
The first attempt to extract magnetic information from fired clay was made in the late 19th century, when the Italian scientist Giuseppe Folgheraiter calibrated a “geomagnetic secular variation curve” – a record of changes in both the declination and inclination of the Earth’s magnetic field, in a given location – for dating ancient pottery. The technique became more established in the 1970s, and can now deliver the same sort of precision as radiocarbon dating. “The job of the archaeomagnetist is to take samples and measure them to death,” says Hare.
But obtaining accurate measurements is far from simple. For a start, the residual magnetism in archaeological samples is tiny, with magnetic moments in the order of 10–3–10–5 Am2/kg, which is an order of magnitude lower than would be required to move a compass needle. Such small magnetic signals can only be detected with cryogenic magnetometers made from superconducting quantum interference devices (SQUIDs). Experiments must also be carried out in a “magnetic vacuum”, often using a Helmholtz cage that creates a uniform magnetic field to cancel out the Earth’s magnetic field.
Another complication is the compound nature of the raw magnetic signal. “The measurements are often a vector sum of the ancient magnetization you’re interested in, and also more recent overprints,” says Andy Biggin, a palaeomagnetist at the University of Liverpool in the UK. Those more recent or “secondary” magnetizations, he says, can often be successfully removed by incrementally heating the samples to temperatures approaching the Curie point, and then cooling them down after each heating step. “That gradually strips away the less stable magnetizations,” Biggin adds.
The accuracy of the measurements also depends on the magnetic structure of the sample, with smaller magnetic grains retaining their magnetization for longer. In magnetite, for example, magnetic grains measuring 50–80 nm can store their magnetic information for billions of years. Obviously, accurate readings of the field direction can only be taken if the object has not been disturbed since the field was imprinted. In other words, the materials should not, for example, have been significantly dried or water-logged since the sample was last heated to the Curie temperature. This requirement rules out a number of types of samples including those that may have been disturbed while being found. “Pottery kilns, or even [the remains of] cities that burned down, make an excellent archaeomagnetic record,” says Biggin.
It is even harder to determine the magnetic intensity from archaeological artefacts, since the present-day measurement also depends on the intrinsic ability of the sample to acquire thermoremanent magnetization. The easiest way to determine this intrinsic property, says Biggin, is to expose the sample to a known magnetic field and then measure the resulting magnetization. If, for example, the new magnetization is twice as strong as the ancient magnetization, the ancient magnetic field must have been half as strong as the controlled field used in the lab.
But working with ancient pieces of clay inevitably introduces problems, partly because the heating process often causes chemical changes or physical deterioration in the samples. “I have never encountered an analytical technique that is so difficult and takes so long,” says Hare. “You can get a month into your measurements, and then have them fail.” Despite these difficulties, geophysicists have already pieced together an accurate magnetic record for western Europe and large parts of the Middle East. In the UK, for example, archaeomagnetic dating now extends back to 1000 BCE, in some cases with accuracies within tens of years.
2 The Earth’s magnetic fielda The Earth’s magnetic field acts like a giant bar magnet, with the field lines encircling the planet and protecting it from the solar wind. (Courtesy: Shutterstock/Milagli) b The direction of the magnetic field at any given point on the Earth’s surface is defined by the declination – the angle on a horizontal plane between magnetic north and the North Pole. This angle varies across the Earth’s surface and changes over time, making it of interest to those involved in “archaeomagnetism”.
Searching for anomalies
This increasing amount of archaeomagnetic data suggests that the current South Atlantic Anomaly is not the only example of extreme local variations in the recent history of the Earth’s magnetic field. One area of focus is the Middle East, where a team of geologists and archaeologists has been studying the magnetization of ancient artefacts found in Israel. “We found very mysterious magnetic fields and surprisingly different than expected – super super strong,” says geophysicist Ron Shaar from the Hebrew University of Jerusalem. Strange behaviour was seen in the field direction as well as the intensity, with anomalies of more than 10° from the prevailing field direction of the time.
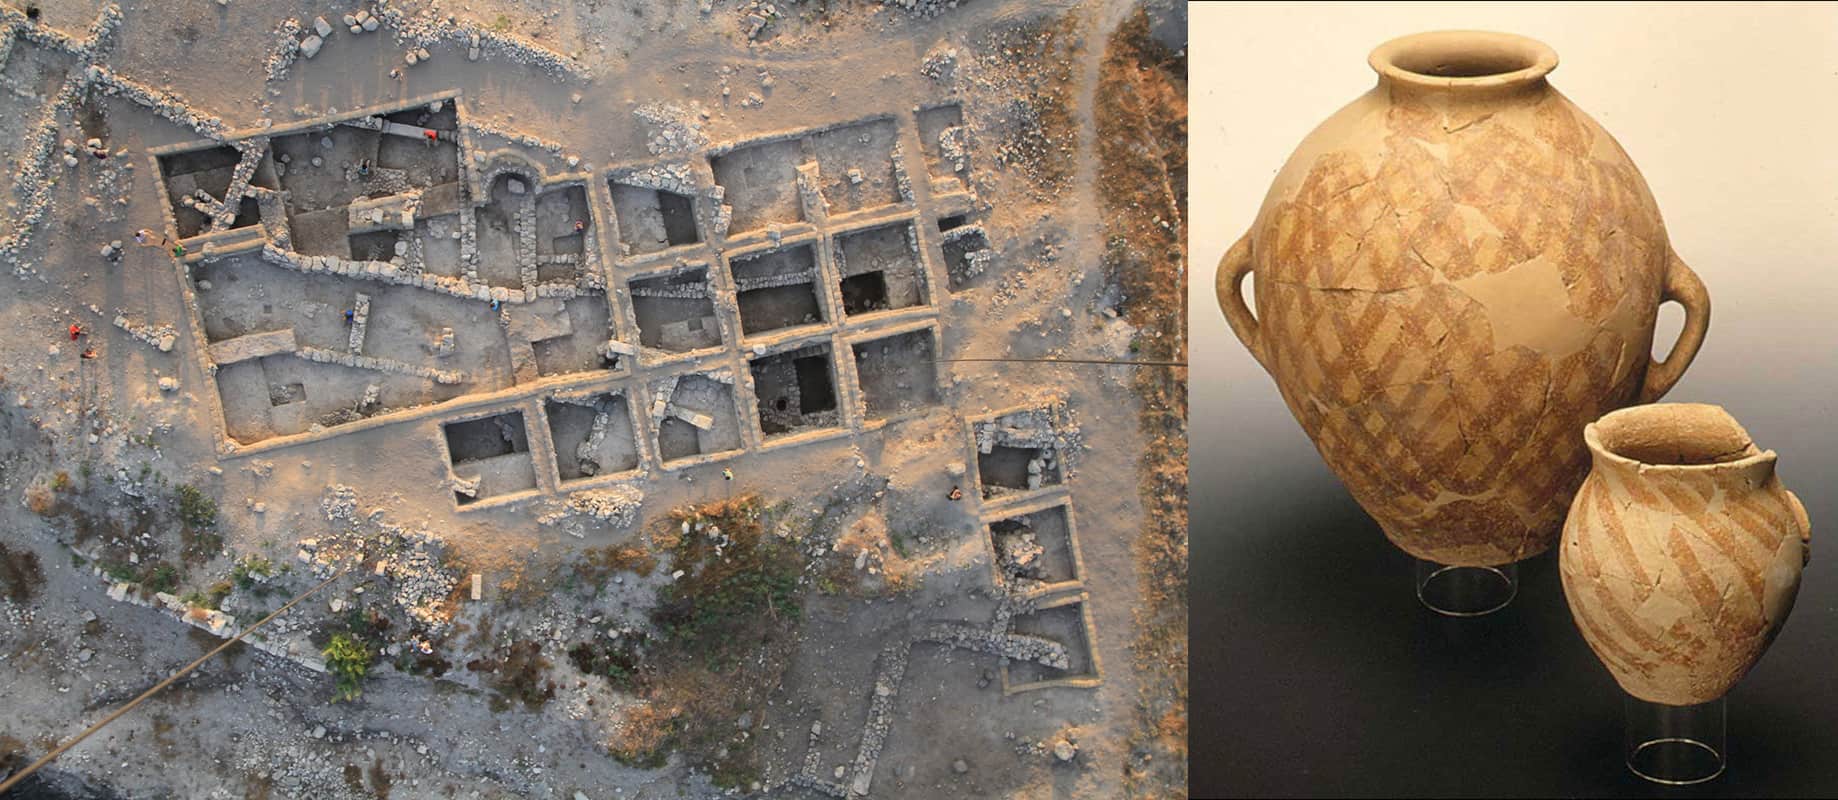
In 2016 the team published results obtained from pottery shards and cooking ovens found at Tel Megiddo and Tel Hazor, two sites in Israel that were occupied during the Iron Age more than 3000 years ago (figure 3). The data reveal the evolution of an extreme geomagnetic high between the 11th and 8th centuries BCE, culminating in two “archaeomagnetic jerks” or “geomagnetic spikes” where the field intensity shoots up and down again in less than a century (Earth and Planetary Science Letters442 173). The two spikes are centred at 732 BCE and 980 BCE, and each one has a field strength more than twice that of the current dipole field. This period has since become known as the Levantine Iron Age Anomaly.
One intriguing possibility is that the effects of these high fields might have been seen during biblical times. Passages from the book of Ezekiel, written 2600 years ago and chronicling a journey through Turkey, describe an immense cloud with flashing lightning surrounded by brilliant light. This depiction is thought to refer to the Aurora Borealis, normally only observed in the far north when charged particles collide at high speed with the stronger magnetic field in these regions. But a stronger magnetic field over the Middle East at that time could explain the lights seen by the prophet. Although the time period doesn’t match exactly with the spikes detected by the team, geophysicist Amotz Agnon – who founded the paleomagnetism lab in Jerusalem and initiated the Tel Megiddo project – points out that “with prophecies, you never know, maybe [this was] just a rumour from some oral tradition”.
In 2020 Shaar and his team published new data from an Iron Age excavation site in Jerusalem. They analysed 397 samples of burnt material from the floor of a building that they deduced was destroyed during the Babylonian conquest of the city, dated to August 586 BCE. Their results reveal similar high-field values, and also provide an exact anchor date for their measurements (PLOS ONE15 e0237029).
Data from further afield show just how far the anomaly stretched at that time. “We can trace its evolution, how it starts in the Middle East and migrates westward toward western Europe over a period of a few hundred years or so,” says Shaar. He and others have studied material from Turkey and Cyprus that show large swings in magnetic field direction from 1910 to 1850 BCE, with exceptionally high intensities around 700 BCE. Other data from Georgia showed high-field values in periods stretching from the 10th to 9th centuries BCE, as well as fast-field variations about 500 years later.
But this unusual magnetic behaviour is quite different from the anomaly now seen in the southern Atlantic, which is a localized region of weak magnetic field. To find examples of similar low-intensity anomalies from the past, Cottrell decided to search for clues in southern Africa. Working in collaboration with South African archaeologists, Cottrell identified suitable samples from sites near the Shashe and Limpopo rivers in northern South Africa, Mozambique, Botswana and Zimbabwe, dated from 425 to 1550 CE.
“The Iron Age of southern Africa is a good place to go,” says Hare, who was part of the study team. He explains that the local people would have built huts with clay floors, and regularly performed certain rituals to cleanse the community if there was a drought or a similar event. “One of those would be the burning of a hut floor, and that’s perfect for archaeomagnetism.”
So far only field-direction measurements have been published, but these early results already show interesting anomalous behaviour (Geophysical Research Letters 45 1361). “If we look at the magnetic field between today and 1500 CE, the rate of change was on the order of 0.06° per year, but between 1500 CE and 1350 CE, it was almost double that,” explains Cottrell. The team also identified an earlier period of relatively rapid change between the 6th and 7th centuries CE.
Cottrell believes that this variability is the most recent historic display of whatever phenomenon is causing the current South Atlantic Anomaly. This had previously been thought to be only a very recent event, but these new findings suggest that some parts of the world might to be prone to repeated changes in the magnetic field. To test this idea, Biggin looked further back in the geological record. He studied volcanic glasses formed 8–11.5 million years ago on the island of Saint Helena, right in the middle of the South Atlantic Ocean, and also found large variations in the direction of the magnetic field. This finding therefore supported the view that the Earth’s magnetic field has been unstable in this region for millions of years.
3 Hidden meaning The hill-top site of Tel Megiddo in Israel contains the remains of at least 20 cities, dating from about 5000 BCE to the 4th century BCE. Artefacts recovered from the site have revealed significant anomalies in the Earth’s magnetic field going back to the Iron Age. Among those to have worked on the project have been geophysicist Ron Shaar from the Hebrew University of Jerusalem and archaeologist Israel Finkelstein. (Courtesy: Megiddo Expedition)
Under the mantle
It is still unclear why certain regions experience these continuing anomalies, but geophysicists believe that the answer may lie in the interactions between the Earth’s mantle and its outer core, the 2889 km layer of molten iron-rich rock that is responsible for the Earth’s magnetic field. The magnetic field is generated by a dynamo process in which the Earth’s rotation, combined with convection currents in the molten core, creates rotating columns of liquid that generate the magnetic field. “When you move a conductor through a magnetic field, you induce electric currents and that makes more magnetic field – so it’s self-sustaining,” explains Biggin.
Anomalies in the magnetic field are thought to be associated with patches of magnetic field in the outer core that are stronger or weaker relative to the overall magnetic dipole, or that even point in the opposite direction. “As these flux patches move, they intensify and diminish, and cause very fast local changes,” says Biggin. Indeed, the current South Atlantic Anomaly seems to sit on top of one or more patches of opposing flux.
The Rochester team has proposed that these flux patches are associated with temperature or density changes deep in the Earth’s mantle. “Africa sits on top of a very special seismological feature in the interior of the Earth, called a large low-shear-velocity province,” says Hare. “It’s essentially a slightly heavier portion of the lowermost mantle of the Earth that sits on top of the outer core, and protrudes slightly into it.” This protrusion then perturbs the flow of the liquid outer core, causing flux patches that alter the magnetic field on the Earth’s surface.
Future clues
Overall, the data from archaeomagnetic studies have been reassuring for the future of the Earth’s magnetic field, since the anomalies we see today are clearly in line with past behaviour. “What we have observed over the past several hundred years is a very normal behaviour of the geomagnetic field,” says Shaar. “There is nothing to worry about based on comparison of today’s field with what we know about the ancient field.” That view is backed up by magnetic records obtained from rocks that were formed much further back in the Earth’s history, which show that the Earth’s magnetic field is now globally much stronger than in the 50 000 years leading up to the past five reversals.
Despite this general reassurance, there is still a lot to explore and understand about the anomalies in the Earth’s magnetic field. That means collecting more data on intensity variations over the last three millennia, but that’s a daunting task when there is still such a high failure rate in sample analysis. “Very few [geophysicists] focus on intensity, because the experiments drive them mad,” says Hare. “But it’s the key to this whole question.”
A new measurement technique being developed combines computed X-ray tomography with scanning magnetometry
One solution could be a new measurement technique being developed by Lennart de Groot, a geophysicist from Utrecht University in the Netherlands. Rather than simultaneously measuring the magnetism of millions of grains in one sample, de Groot combines computed X-ray tomography with scanning magnetometry to calculate the unique contribution of each grain (Geophysical Research Letters45 2995). More accurate results can be achieved, he says, because the technique requires only a small subset of the magnetic grains contained within each sample.
It will also be important to source samples from a wider variety of locations. Detailed magnetic profiles now exist for Europe and much of the Middle East, while data coverage in China is also improving. It remains difficult to source magnetic data from the southern hemisphere, but Cottrell is continuing her work in Africa, adding that “there has been a concerted effort by many researchers, particularly from South America, to collect this data”.
As more data become available, geophysicists are convinced that more anomalous behaviour will emerge in the Earth’s magnetic history. There is already some evidence of strong flux patches under Siberia, for example, and in the Southern Ocean near Australia. Shaar agrees that other anomalies will be found, and predicts that any new discoveries will be just as puzzling as those reported so far. “The world is huge and I suspect that we will find in the future that the geomagnetic field is nothing like we have measured in the past few hundreds of years,” he says. “It is an evolving thing, constantly changing, and there will be many surprises.”
New, large and highly radioactive particles have been identified from among the fallout of the 2011 Fukushima Daiichi nuclear disaster in Japan. An international team of researchers has characterized the particles using nuclear forensic techniques and their results shine further light on the nature of the accident while helping to inform clean-up and decommissioning efforts.
This year marks the tenth anniversary of the Fukushima Daiichi disaster, which occurred as a result of a powerful earthquake that struck off of Japan’s east coast, generating a tsunami that reached some 14 m high when it reached the nearby shoreline. Breaching sea defences, the water from the wave shut down emergency generators that were cooling the reactor cores. The result was a series of nuclear meltdowns and hydrogen explosions that released a large amount of radioactive material into the surrounding environment — including microparticles rich in radioactive caesium that reached as far Tokyo, 225 km away.
Recent studies have revealed that the fall-out from reactor unit 1 also included larger caesium-bearing particles, each greater than 300 micron in diameter, which have higher levels of activity in the order of 105 Bq per particle. These particles were found to have been deposited in a narrow zone stretching around 8 km north-northwest from the reactor site.
Surface soil samples
In their study, chemist and environmental scientist Satoshi Utsunomiya of Japan’s Kyushu University and colleagues have analyzed 31 of these particles, which were collected from surface soil taken from roadsides in radiation hotspots.
“[We] discovered a new type of radioactive particle 3.9 km north northwest of the Fukushima Daiichi Nuclear Power Plant, which has the highest caesium-134 and caesium-137 activity yet documented in Fukushima, 105–106 Bq per particle,” Utsunomiya says.
Alongside the record-breaking radioactivity seen in two of the particles (6.1×10⁵ and 2.5×10⁶ Bq, after correction to the date of the accident) the team also found that they had characteristic compositions and textures that differed from those previously seen in the reactor unit 1 fall-out.
Reactor building materials
A combination of techniques including synchrotron-based nano-focus X-ray analysis and transmission electron microscopy indicated that one of the particles was found to be an aggregate of smaller silicate nanoparticles each with a glass-like structure. This is thought to be the remnants of reactor building materials that were first damaged in the explosion and then picked up caesium that had been volatized from the reactor fuel.
The other particle had a glassy carbon core and a surface peppered with other microparticles of various compositions, which are thought to reflect a forensic snapshot of the particles that were airborne within the reactor unit 1 building at the moment of the hydrogen explosion and the physio-chemical phenomena they were subjected to.
“Owing to their large size, the health effects of the new particles are likely limited to external radiation hazards during static contact with skin,” explained Utsunomiya — with the two record-breaking particles thought too large to be inhaled into the respiratory tract.
Impact on wildlife
However, the researchers note that further work is needed to determine the impact on the wildlife living around the Fukushima Daiichi facility — such as, for example, filter feeding marine molluscs which have previously been found susceptible to DNA damage and necrosis on exposure to radioactive particles.
“The half-life of caesium-137 is around 30 years,” Utsunomiya continued, adding: “So, the activity in the newly found highly radioactive particles has not yet decayed significantly. As such, they will remain [radioactive] in the environment for many decades to come, and this type of particle could occasionally still be found in radiation hot spots.”
Nuclear material corrosion expert Claire Corkhill of the University of Sheffield – who was not involved in the study – says that the team have offered new insights into the events that unfurled during the accident. “Although the two particles selected [for analysis] were small, a mighty amount of chemical information was yielded,” she said, noting that some of the boron isotopes the researchers identified could only have come from the nuclear control rods damaged in the accident.
Ongoing clean-up
“This work is important to the ongoing clean-up at Fukushima, not only to the decontamination of the local area, but in defining a baseline understanding of radioactive contamination surrounding the power plant, to ensure that any materials accidentally released during the fuel retrieval operations can be quickly identified and removed,” she adds.
With this study complete, the researchers are now using the particles to better understand the conditions involved in the reactor meltdown, alongside looking quantify the distribution of this fallout across Fukushima, with a focus on identifying resulting radiation hot spots.
“If we can find and remove these particles, we can efficiently lower the radiation dose in the local environment,” Utsunomiya concluded.
A new electrostatic de-icing technique that exploits the natural charge separations in growing frost crystals has been developed by Jonathan Boreyko and colleagues at Virginia Tech in the US. The team used high-speed cameras to show how ice particles are broken off and propelled away from chilled surfaces when liquid water is suspended above them. Their discoveries could significantly improve our ability to remove stubborn frost layers from surfaces including aircraft and car windscreens.
Spontaneous charge separations in growing ice crystals have been studied for decades. For atmospheric scientists, the effect is key to understanding how clouds become charged during thunderstorms. However, one related effect, characteristic of frost formation, has remained largely unexplored until now.
When surfaces including glass and metal are chilled in humid air, ice crystals with branching, tree-like structures called dendrites can form. As these crystals grow, their upper branches will gradually become warmer, while their bases will remain cold. This generates higher concentrations of thermally activated negative ions, including hydronium and hydroxide in the branches, creating an excess of negative charge in those regions.
Jumping the gap
Borekyo’s team explored the idea that this charging effect could be exploited to develop better techniques for de-icing frosty surfaces. In their experiment, they prepared layers of dendrites on both glass and metal surfaces and suspended thin films of liquid water a few millimetres above them. Since water molecules are strongly polar, they became aligned in the presence of the negatively charged dendrite branches. This generates an electrostatic attraction between the branches and the liquid water; causing branches to dramatically break off and jump across the gap to stick to the water (see video).
Since no airflow or applied voltage is involved in the process, Borekyo and colleagues could non-invasively capture these jumps using a high-speed camera and compare their observations with numerical simulations. Their images showed strong agreement with the simulations; enabling them to precisely measure the electrostatic forces involved, and to determine their dependence on the temperature gradient across the dendrites.
The results could now provide fresh insights for atmospheric scientists studying how growing ice crystals drive electrification in thunderclouds. In addition, the research could lead to practical new electrostatic de-icing techniques; suitable for removing built-up frost from surfaces including aircraft, air conditioning units, and car windscreens on cold winter mornings.
Borekyo’s team now plan to scale up their technique in future research. By replacing water films with high voltage, actively charged electrodes, they could cause larger masses of ice, including entire dendrites, to be propelled away from surfaces.
Accurate and reproducible patient positioning is the essential first step in any optimized radiation therapy workflow, allowing the clinical team to plan and deliver high-precision radiation dose to the tumour while minimizing damage to adjacent healthy tissue and organs at risk. Operational success starts with the lasers used for patient alignment and marking during CT imaging in the treatment position (the basis of treatment planning and dose optimization). These lasers are also essential for patient positioning and marking in the MRI systems increasingly employed to visualize the tumour target, as well as its surrounding anatomy, with exceptional soft-tissue contrast – both prior to and during treatment. The same goes for the delivery of radiation treatment, with lasers ensuring accurate, repeatable positioning of the patient versus the linac isocentre.
In this way, positioning laser systems underpin robust and precise registration of CT/MRI data for treatment planning, while minimizing the stress experienced by the patient during subsequent radiotherapy fractions in a conventional linac or MR-Linac. “Our lasers enable fast and repeatable positioning of the patient in the imaging and treatment unit – increasing patient safety and streamlining the radiotherapy workflow,” explains Torsten Hartmann, director of product management (healthcare) at LAP, the German laser and radiotherapy QA specialist.
As for specifics, LAP supplies more than 5000 room lasers each year for patient positioning and marking in CT, PET/CT, MRI and linac installations – an offering that’s complemented by a portfolio of phantoms that enables medical physicists, dosimetrists and technicians to carry out regular QA checks on their imaging systems and linac machines. “The room lasers are a fundamental component of manufacturer-independent QA,” Hartmann adds, “guaranteeing precise orientation of the phantom in a range of testing set-ups.”
Collaborate, innovate, accumulate
Right now, Hartmann and his colleagues are busy working on LAP’s next-generation laser offering for the radiation oncology market. It’s a product roadmap that, in large part, will be shaped by an ambitious R&D collaboration with the Institute of Product and Process Innovation at Leuphana University in Lüneburg, Germany. Dubbed “Innovative Support for Reproducible Patient Positioning”, the project runs till summer 2022 and is backed with funding of €700,000 from the state of Lower Saxony and the European Regional Development Fund.
Within the collaboration, LAP is developing its laser portfolio while exploring broader opportunities around workflow automation, cybersecurity and big data. Near-term, the partners are focused on enhanced integration and interoperability between LAP’s lasers and the imaging and treatment systems within the radiation oncology clinic – innovations that will simplify the networking of clinical devices and the import/export of machine and patient data. In this way, it will be possible to integrate functionality in one system to control another – for example, QA tools that interact directly with the positioning lasers to improve patient safety.
A big driver here is the development of open interfaces between LAP’s lasers and imaging and radiotherapy systems from multiple OEMs. “Ultimately,” notes Hartmann, “that will mean enhanced usability, saving the medical physicist time during the positioning of the patient in the imaging suite or on the treatment couch – all of which means improved patient experience, increased patient throughput and reduced cost of care.”
Another area of interest for LAP is intelligent laser systems. “With built-in intelligence,” argues Hartmann, “our lasers could help to track and adjust for geometric deformations in patient anatomy between treatment sessions – for example, when they gain or lose weight or when the stomach, bladder and bowel contents change.”
Taken together, these efforts represent a logical progression for LAP. The manufacturer has worked previously with Siemens Healthineers, for example, to create a unified user interface for the latter’s syngo.via RT Image Suite. This multimodality imaging system allows clinicians to access CT, MR, PET/CT and cone-beam CT imaging data to support organ contouring, treatment planning and response assessment via a single interface.
Significantly, the syngo.via RT user interface was extended to incorporate direct steering of LAP’s DORADOnova room lasers via an integrated “virtual laser view” based on LAP’s CARINAnav control software (see the animation, below). “The collaboration with Siemens Healthineers demonstrates the benefits of open interfaces and interoperability,” says Hartmann. “As a result of this collaboration, the clinical end-user is able to control our lasers with just a few clicks via a single user interface within the syngo.via RT Image Suite.”
Listening to the customer
Alongside these flagship R&D partnerships, LAP is also casting the net wider in an effort to facilitate bottom-up, customer-driven product innovation. With this in mind, the regional sales teams are front-and-centre in the vendor’s collective conversation with the clinical user base – and a productive conduit for requirements-gathering at scale.
Torsten Hartmann: “For the product management function, the priority is more dialogue, more often, with more customers.”
“For any promising idea, the product management team will first work up a set of user stories to flesh out the clinical and commercial opportunities,” says Hartmann. “Our ‘lighthouse customers’ are invaluable in this regard, helping us to iterate our thinking and articulate the best way forward.” A case in point is Strahlentherapie Singen-Friedrichshafen, which has teamed up with LAP on various workflow questions and the evaluation of industry 4.0 concepts to support embedding of next-generation laser systems in the radiotherapy equipment chain.
Those close links are replicated into LAP’s global service organization, with Hartmann and his team disseminating the latest product know-how and training so that LAP service engineers have the information they need to support clinical customers out in the field. That training is especially important given that LAP treats every laser installation as unique, with customers benefiting from upfront room planning and design support from their LAP service team.
“There are various possibilities for combining wall-, ceiling- or floor-mounted laser units,” Hartmann adds. “Different attachment systems and flexible, adjustable retainers allow us to adapt the laser system to the specifics of the customer’s imaging suite or treatment room.”
Post-pandemic, Hartmann is looking forward to re-engaging directly – not just over Zoom – with LAP’s diverse clinical customer base. “For the product management function,” he concludes, “the priority is more dialogue, more often, with more customers – which is especially tricky just now. Down the line, it’ll be nice to spend more time with customers out in the clinic again, working with them to understand the day-to-day challenges they face in the imaging suite and the treatment room.”
Intra-operative shear wave elastography, showing the brain tumour lying under the ventricles. (Courtesy: CC BY 4.0/Front. Oncol. 10.3389/fonc.2021.619286)
Shear wave elastography can detect the presence of residual cancerous tissue after brain tumour resection as effectively as expensive MRI scans, and 2.5 times better than surgeons, according to researchers from the UK. Should it prove as effective in wider trials, the approach could have the potential to improve surgical outcomes by helping to ensure that cancers are comprehensively removed during surgery, thereby reducing the chance of a recurrence.
When surgically removing brain tumours, ensuring that as much of the cancerous tissue is removed as possible without damaging healthy tissue is key to optimizing patient outcomes. The gold-standard approach to identifying residual tumour tissue is MRI. Unfortunately, such scans are expensive to perform, require facilities not commonly available in operating theatres, and are time-consuming to the point of being somewhat impractical, as individual scans can take in excess of an hour-and-a-half to perform.
As a result, many surgeons rely on visual inspection and tactile feedback to determine the nature of the tissue being considered for removal – with tumours typically being stiffer than regular brain tissue.
Taking advantage of this fact, medical physicist Jeffrey Bamber of the Institute of Cancer Research and colleagues turned to elastography, an ultrasound technique that determines the stiffness and stretchiness of matter and can thus map out areas that may represent tumour tissue. It works by measuring the passage of vibrational waves, which move faster through stiffer tissue.
“Shear wave scanning can quickly and affordably map the stiffness of brain and tumour tissue in patients during surgery,” Bamber explains. “Using this new type of scan, surgeons could greatly increase confidence that no cancerous tissue is going to be left behind after surgery.”
Tumour detection
In their study, the researchers recruited 34 patients aged between one and 62 years who were undergoing surgery to remove a brain tumour. During each operation, the team performed both regular 2D ultrasound and shear wave scans before, during and after tumour resection – alongside asking the surgeons to manually identify cancerous tissue before they were shown the results of the two ultrasound examinations. Following each operation, each patient was also given an MRI scan for comparison.
The researchers found that shear wave elastography was more sensitive in identifying residual tumour tissue after initial resection than either a standard ultrasound or a surgeon’s evaluation. Specifically, it detected tumour tissue with 94% sensitivity, compared with 73% and 36% for regular ultrasound and physical examination, respectively.
There was a drawback, however, with the shear wave scans only detecting tumour tissue with a 77% specificity – better than the 63% for 2D ultrasound, but not on par with the 100% success rate of the surgeons. This means that the new approach risks yielding false positives but, as the researchers explain, would work best when used in tandem with the surgeon’s evaluation.
“We have shown for the first time that this new tool is better than either a standard 2D ultrasound or a surgeon’s judgment on its own – and has the potential to supplement a surgeon’s opinion as a means of improving outcomes from operations,” Bamber says.
Furthermore, the researchers report that interoperative shear wave scans were as good as post-surgical MRIs at detecting the presence of residual tumour tissue – while still inherently more economical, faster and practical to deliver.
“Intraoperative ultrasound is a versatile and low-cost technique that has proven to be a helpful tool in the image-guided resection of brain tumours,” comments Santiago Cepeda, a neurosurgeon from the University Hospital Río Hortega in Spain, who was not involved in the present study. He added: “We will probably be able to include elastography within the neurosurgical armamentarium shortly.”
“Elastography definitely represents a reliable, cost- and time-effective advancement for oncological neurosurgery,” agrees Francesco Prada, who is the director of the acoustic neuroimaging and therapy lab at the Fondazione IRCCS Istituto Neurologico Carlo Besta in Italy.
A new type of maser made from periodically driven xenon atoms can detect low frequency magnetic fields far better than any previous magnetometer, according to scientists in China and Germany. The researchers believe their device is ready for use in a proposed gravitational wave search and might in future be used to find hypothetical dark matter particles.
Masers are the microwave-wavelength equivalent of lasers and their extreme frequency stability allows them to make invaluable contributions to atomic clocks, radio telescopes and several other areas of physics. In a traditional maser – as in a traditional laser – the masing action occurs between two energy levels in an atomic or molecular gain medium confined in a cavity. As electromagnetic radiation bounces back and forth in the cavity, photons whose frequency is resonant with the energy difference between the two levels are repeatedly emitted and absorbed by the atoms. Eventually, a “population inversion” with more atoms in the upper level is achieved, and stimulated emission from these atoms produces a highly monochromatic beam of microwave radiation.
Floquet sidebands
With their new maser, Xinhua Peng and colleagues at the University of Science and Technology of China in Hefei, in collaboration with Dmitry Budker of Johannes Gutenberg University of Mainz in Germany, took a more subtle approach. They replaced the normal, static gain medium with a gas of xenon-129 atoms in a vapour cell. When placed in a magnetic field, atoms with nuclear spins aligned anti-parallel to the field become slightly higher in energy than atoms with parallel nuclear spins, and masing between the two energy levels is possible. A periodic perturbation applied to this field creates a periodic perturbation in the energy shift. This manifests as a series of so-called Floquet sidebands either side of the central masing frequency.
“If we see sidebands, we can see from the frequency of the sidebands the frequency of the magnetic field and, from the amplitude of the sidebands, the amplitude of the magnetic field,” explains Min Jiang, who is first author on a paper in Science Advancesdescribing the work.
The researchers tested their Floquet maser at sensing perturbations when driven at various frequencies. They showed how the amplitude of the first-order sidebands grew as the driving frequency decreased, suggesting the magnetometer’s sensitivity was increasing. For driving frequencies below 1 Hz, it was not possible to make simple measurements like this as the maser entered a different regime showing a very large number of sidebands. The researchers therefore analysed the frequency spectrum of all the sidebands. Their measurements suggest that the magnetometer was most sensitive to extremely low frequency perturbations – the opposite behaviour to that seen in other state-of-the-art magnetometers such as superconducting quantum interference devices (SQUIDs) and spin exchange relaxation free (SERF) atomic magnetometers, which are more accurate at measuring higher frequency perturbations.
“Substantially better” performance
“We measured, for example, 1 mHz and then 10 mHz and then we fit our data,” says Jiang. Between 1–100 mHz, the researchers say, their device performed “substantially better” than any other magnetometer, with a sensitivity of 700 fT/Hz.
The current limitations of the device are not fundamental so the researchers believe that it should be possible to achieve even better sensitivity at even lower frequencies. “It’s mainly limited by the instability of our maser, which mainly comes from the laser that we use to optically pump the system,” says Jiang, “at low frequencies that noise goes up”.
With a more stable setup, it may be possible to reach a sensitivity of about 7 fT/Hz at 1 mHz. Even in its current form, the detector could help to monitor the alignment of the mirrors in eLISA (Evolved Laser Interferometric Space Antenna), which is a proposed space-based gravitational-wave observatory. A more advanced maser could prove invaluable in the hunt for ultralight dark matter particles, some of which are predicted to create low frequency magnetic fields detectable on Earth: “I think this opens a new window that nobody has reached before in dark matter searches,” says Peng.
Mike Romalis of Princeton University in New Jersey, one of the inventors of the SERF magnetometer, is sceptical, however. “I am sure that their conclusion that sensitivity improves at lower frequency is wrong,” he says. “They measured the frequency response only down to 1 Hz but then extrapolate down to millihertz and arrive at an un-physical conclusion. Sensitivity of any detector cannot improve indefinitely at lower frequency.”
Cancer stem cells (CSCs) are responsible for tumour growth and metastatic spread, as well as cancer cell repopulation following chemotherapy or irradiation. Finding safe and effective methods to destroy CSCs is of critical importance in cancer treatment, because they tend to be resistant to both radiation and chemotherapy.
The answer may lie in the use of microsecond pulsed electric fields (µsPEF), according to researchers from the Italian National Agency for New Technologies, Energy and Sustainable Economic Development (ENEA). Exposure to µsPEF provides an effective, destructive tool to retard tumour growth and when followed by radiation, could stop malignant tumour growth entirely. The researchers demonstrated the effectiveness of this approach on laboratory mice with medulloblastoma tumours, who experienced no tumour regrowth for nearly four months following the combined treatment.
Described in the International Journal of Radiation Oncology, Biology, Physics, this finding could have significant implications for improving cancer therapy, in particular, treatments of malignant brain tumours. In addition to improving survival outcomes, µsPEF radiosensitizes the CSCs prior to radiotherapy. This enables the delivery of lower doses of radiation to the brain, which could help minimize the risk of neurocognitive damage, particularly when treating paediatric patients.
Selective sensitization
Pulsed electric fields of high amplitude and short duration provide a powerful means to induce cell electroporation, in which the cell membrane becomes increasingly permeability to ions and macromolecules. One such approach, electrochemotherapy, which enables chemotherapy drugs to better permeate cell membranes, is now widely used to treat superficial and deep tumours. Others, such as irreversible electroporation (IRE) and high-frequency IRE (H-FIRE), cause direct, nonthermal cell death. The effectiveness of IRE and H-FIRE for treating a range of cancers is currently being evaluated in numerous clinical trials.
These electrically mediated therapies also offer the possibility to selectively target CSCs. CSCs are present in brain cancers and are believed to be responsible for their fast regrowth rate and the extremely high recurrence of brain tumours following treatment. Brain cancers in children are of particular interest, such as medulloblastoma, the most common malignant paediatric brain tumour.
Lead author Mirella Tanori and colleagues investigated the effects of µsPEF on D283Med cells, a human medulloblastoma cell line reported to be rich in CSCs, and on a normal human astrocyte (NHA) primary cell line.
The researchers report that cell membrane permeability of D283 cells increased proportionately to the number of electric pulses administered. They identified a specific pulse protocol – five 40 µs pulses at 0.3 MV/m (PEF-5) – that produced high cell mortality within 72 hours. PEF-5 exposure reduced the clonogenic capacity (a cell’s ability to clone itself) of D283 cells by four times compared with sham-treated cells. The team note that NHA cells were resistant to this treatment, suggesting that NHAs have a higher threshold for irreversible electroporation than D283 cells.
Exposure of D283 cells to PEF-5, followed 3 hr later with 2, 5 or 8 Gy irradiation, demonstrated the effectiveness of the combined treatment. Notably, PEF-5 reduced clone formation with the same efficacy as the highest X-ray dose delivered, implying that PEF-5 could be used as a pre-treatment to de-escalate radiation dose.
Clonogenic survival of D283 medulloblastoma cells in vitro after exposure to ionizing radiation, with and without pulsed electric fields. (Courtesy: Int. J. Radiat. Oncol. Biol. Phys. 10.1016/j.ijrobp.2020.11.047)
Electric pulses act as stressors for cell membranes, causing exposed cells to generate reactive oxygen species to defend themselves. Thus the team also evaluated ROS production. In D283 cells, they observed a significant ROS increase 3 hr after the electric exposure. DHE cells, however, did not show this increase after PEF-5 exposure.
In vivo success
The team also investigated the use of µsPEF on medulloblastoma tumours in laboratory mice – and the results were similarly impressive. Compared with sham-treated mice, PEF-5 exposure alone inhibited tumour growth by 46.47%, while irradiation at 5 Gy inhibited growth by 87.18%, 43 days following treatment. The combination of PEF-5 and a lower radiation dose of 2 Gy inhibited tumour growth in mice by 100%, and there was no subsequent growth for up to 110 days.
“Pulsed electric field exposure may play an important role in sensitizing CSCs, also blocking their proliferation capacity and hence possibly promoting a stronger action with X-rays on the pre-treated D283 cells,” write the authors. They also believe that the combined treatment represents “an interesting therapeutic strategy to selectively target CSCs, safeguarding the healthy tissues and overcoming radiation therapy-associated cognitive disabilities typically associated with brain tumour therapies.”
Clear pictureThe Apotheosis of Washington in the US Capitol links democracy and science. (Courtesy: Architect of the Capitol)
If you stand in the Great Rotunda in the neoclassical US Capitol Building and look up, you’ll see high above a concave fresco entitled The Apotheosis of Washington. Painted in 1865 by the Greek–Italian artist Constantino Brumidi, it shows the first US president surrounded by six allegorical scenes. The details are hard to make out from 50 m below, but with binoculars – or Google – you can spot George Washington gesturing towards a scene representing science.
The central figure in that particular scene is the Greek goddess Athena. Neither looks at the other; Washington has other things on his mind, while Athena is teaching people – including Benjamin Franklin, Samuel Morse and the steamboat pioneer Robert Fulton – about a spark gap. Brumidi knew that Washington, like America’s other founding figures, believed in an association between effective democratic institutions and science.
I thought of Brumidi’s fresco on 6 January this year as I watched live TV footage of domestic terrorists in the Great Rotunda assaulting police, smashing artefacts and splashing blood on a sculpture (Brumidi’s painting, high up in the oculus of the dome, was unharmed). The carnage was incited by leaders who (amplified by social media) were warring against both democratic institutions and science. I wondered about the connection between the two wars.
The three Cs
Each war is associated with a “grand story”. The grand story of the war on democracy is that the 2020 US presidential election was fraudulent; the grand story for science is that evidence for things like climate change, the pandemic and vaccines is false. Each story provides justifications for rejecting contrary evidence, with the key elements being that the evidence has been faked, that a group of people plotted that fakery, and that attacking it is moral and just. I think of these elements as the “three Cs”: conviction, conspiracy and community.
Let’s start with the first C, that adherents are firmly convinced of their beliefs. Such convictions insulate belief against the doubt that might inspire need for further inquiry; contrary evidence must be wrong or was manipulated.
“If my friends lose the election, ballots were stolen,” say believers of the first story; “Scientific evidence against my view was faked,” say believers of the other. Alternative “experts” are found to reassure believers. The Capitol invaders, for instance, swear by certain disaffected politicians, while science deniers turn to the likes of Bjørn Lomborg (for his views on climate change), Peter Duesberg (AIDS) and Andrew Wakefield (anti-vaccination).
If contrary evidence persists, the reason must be a conspiracy – an organized effort to produce falsehoods. In one grand story, the conspirators are socialists, political opponents, those of other races, and the “deep state”; in the other, foreigners and the medical and scientific establishment. Conspiracies explain contradictory evidence and strengthen buffers against it.
The trouble with conspiracies is that they’re non-falsifiable, because any evidence against them is dismissed as manufactured by the conspirators
The trouble with conspiracies is that they’re non-falsifiable, because any evidence against them is dismissed as manufactured by the conspirators. Conspiracies are also comforting, as they tell believers that the truth is not difficult and that they already know what’s really happening. Believe in a conspiracy theory and you don’t need to understand, say, climatology, epidemiology, demographics, physics or voting machine technology.
The third element bolstering grand stories is that they make believers feel spiritually and morally uplifted. Grand stories provide an apparent moral clarity, dividing the world into a blameless “us” and a wicked “them”, with the former representing the community as a whole and the latter a malevolent minority. To keep the group from splintering into sub-tribes with different views and aims, grand stories maintain unity through pageantry and entertainment.
I’ve seen anti-nuclear protests against research reactors that were picnics, with folk singers and dancers and people dressed as mushroom clouds and skeletons, while pro-science groups also have slogans and symbols. The Capitol’s invaders shared a mix of anger and celebration. Some painted their faces in patriotic red, white and blue and dressed as bald eagles or revolutionary war figures, while others carried iconography of racism and antisemitism such as Confederate flags.
Antidotes such as “better communication”, “science literacy” or “more dialogue” are ineffective; the messier and more difficult truth is harder to explain
The three Cs reinforce each other in a way that makes them propagate easily. Wouldn’t it be great if you didn’t need to investigate complex issues involving your health and welfare? Which would you rather watch: a parade of invaders smashing the halls of government, or broadcasts of a legislative session or scientific conference? Don’t you wish truth and moral clarity were easier?
Grand stories aim to spread enough distrust so that the most persuasively and vividly presented position seems the truest. This is why commonly suggested antidotes such as “better communication”, “science literacy” or “more dialogue” are ineffective; the messier and more difficult truth is harder to explain.
Democracies have ways of tolerating grand stories without suppressing them or letting their members dominate headlines, affect decisions or invade buildings. These ways involve a sifting process in which experts and institutions exercise judgment by weighing evidence, consulting experts and repeated inquiry.
This is not elitism, but democracy trying to make itself work. In the US at least, this process broke down well before 6 January. There’s a long-term danger if we allow grand storytelling to metastasize in social life and become normalized in politics, disconnecting beliefs from reality and blurring the distinction between fact and fiction.
The critical point
I have no idea what George Washington and Athena would have thought about the rampage taking place beneath them. The kind of battle occurring was not one each had to fight. To keep it from recurring will involve rebuilding trust and creating an even grander and still more uplifting story whose key elements are periodically rechecked facts, discerningly chosen experts, respect for irritations of doubt, and messier truth and moral vision. This is painstaking, frustrating and never-ending work, but the price of effective democracy.
Researchers in China have shown that the spin of a molecular quantum bit (qubit) can remain coherent for more than 1 millisecond – long enough to perform 145 000 basic logic operations. This number, known as the qubit “figure of merit”, is 40 times higher than previously reported for this molecule, raising the chances that such qubits could be used in quantum computing applications as well as in biomedical imaging and quantum sensing.
Quantum computers can, in principle, solve certain problems much faster than classical computers because they exploit a quantum particle’s ability to be in a superposition of two or more states at the same time (as opposed to classical bits that have only 0 and 1 states). Promising candidates for qubits include superconducting circuits, trapped ions, defects in solid materials and quantum dots.
Electron spins in magnetic molecules as qubits
Recently, electron spins in magnetic molecules have emerged as another qubit possibility. Compared with other physical systems, these molecular qubits have several advantages. For one, researchers can easily tailor their structure by changing their chemical makeup. It is also relatively straightforward to fabricate lots of identical molecular qubits and deposit them in regular arrays to create circuits.
Like all qubits, however, the superposed states in molecular qubits are fragile and easily disrupted by noise in the environment. This noise destroys the quantum information stored in the states, in a process known as decoherence. While various methods exist for overcoming decoherence in molecular qubits (including diluting the qubits in a diamagnetic matrix, enhancing the rigidity of the molecules and isotropic purification), the longest coherence time measured for a molecular qubit to date has been less than a millisecond.
Dynamic decoupling technique
A team at the University of Science and Technology in Hefei has now improved on that figure by applying microwave pulses to “flip” the quantum state of molecular qubits – a method known as dynamical decoupling. As team member Xing Rong explains, inverting the state of the molecule’s electron spin greatly averages out the coupling, or interaction, between the qubit and its environment, so extending the qubit’s coherence time.
Rong and colleagues made their molecular qubits from the transition-metal complex (PPh4)2[Cu(mnt)2]. Using a modified commercial X-band pulsed electron paramagnetic resonance spectrometer, they measured a coherence time of 1.4 milliseconds for the system. The previous best value for the material was just 6.8 μs.
Applications and future challenges
“The dynamical decoupling method described in our work does not require us to specially modify the molecule, in contrast to other approaches,” Rong tells Physics World. “The longer coherence time we measured could enable the molecular qubit to be widely used — not only in the field of quantum computation, but also in magnetic biomedical imaging and quantum sensing.”
The researchers, who report their work in Chinese Physics Letters, say they now plan to steer the spin coherence of their molecular qubit at the single molecular level. “This is a key step for a molecular qubit in quantum information processing and is very challenging because the signal from a single molecular qubit is very weak,” Rong says.