Natural acoustic metamaterials found on the wings of some moths could help the insects avoid being eaten by bats – according to Marc Holderied and colleagues at the UK’s University of Bristol. By doing a combination of simulations and experiments, the team found that coupled vibrations of wing scales enable the moths to absorb ultrasound over a broad range of frequencies. The discovery could lead to the development of bio-inspired sound proofing materials with the potential to perform far better than current designs.
As a key source of prey for echolocating bats, moths are under evolutionary pressure to evade capture. While many moth species are very good at hearing the ultrasound used by bats, many other species lack this ability. Instead, these insects use acoustic camouflage to avoid detection. This involves sound waves being scattered or absorbed by sub-wavelength size structures on the moth’s wings.
Scientists have studied similar metamaterial structures on butterfly wings, which can have special optical properties that produce vibrant iridescent colours. However, these scales are not suitable for dampening sound, leading Holderied’s team to ask what is different about moths’ wings? In their study, the researchers investigated sound dampening mechanisms in two earless species of moth – Antheraea pernyi and Dactyloceras lucina.
Microscope and tomography
They first used a combination of scanning electron microscopy and micro-computed tomography to study the shapes and arrangements of the wing scales of both species. The images revealed overlapping tile arrangements of paddle-shaped scales, with stalks attached to stiff, lightweight membranes. These layers were typically less than 0.3 mm thick, which is far shorter than the ultrasound wavelengths used by bats.
In subsequent experiments, Holderied and colleagues showed that these layers could significantly dampen sound waves within a broad range of ultrasound frequencies. Sound at frequencies as low as 20 kHz is absorbed and the layers display a maximum absorption of 72% at 78 kHz.
Using computer models, the researchers worked out the mechanisms responsible for these advanced absorption properties. The scales vary significantly in terms of their sizes and shapes – depending on their location on the wing. The team found that this leads to variations in the natural resonant frequencies of the scales. Furthermore, their models revealed a strong coupling between the vibrations of neighbouring scales on shared membranes. This means that collectively, the scales act to dampen acoustic waves over a broad range of frequencies. This is wholly unlike the acoustic behaviour of butterfly wings, whose uniform scales can only resonate in small, localized clusters.
The wings of the two moth species are the first confirmed examples of natural acoustic metamaterials. Their design could be mimicked to create lightweight, ultrathin soundproofing panels, with the potential to out-perform the thick, porous absorbers currently used for sound insulation.
Proton therapy holds the promise of delivering highly conformal dose distributions to a target tumour volume, due to the finite range of the proton beam. However, the accuracy of this delivery can be affected by factors such as target motion, which may lead to overdosing regions of healthy tissue and underdosage of the tumour volume.
“Proton therapy is very sensitive to changes in the position and shape of the patient as a whole and the patient’s organs, both between fractions and within one fraction,” explained Sonja Schellhammer, recipient of the Donal Hollywood Award for the best abstract presented at the recent ESTRO 2020 congress. “It would be ideal if we could monitor the proton range simultaneously with the patient anatomy in real time.”
Currently, verification of proton range is mostly based on detection of secondary radiation such as prompt gamma rays or acoustic waves. Another indirect approach involves using MRI to visualize long-term radiation-induced biological effects. MRI benefits from excellent soft-tissue contrast, offers real-time imaging, delivers no radiation dose and could prove ideal for integration with proton therapy.
With this in mind, scientists at OncoRay/Helmholtz-Zentrum Dresden-Rossendorf (HZDR) are working to integrate proton therapy with MRI. Previous studies by others have shown that MRI can determine proton beam range using an off-line approach, with contrast-enhanced images recorded weeks or months after irradiation. “The question we asked in this study, is whether it would be possible to visualize the proton beam with online MRI during irradiation,” Schellhammer explained in her ESTRO presentation.
To test this idea, the researchers designed a phantom experiment using the Dresden proton therapy facility, where OncoRay, in collaboration with IBA and ASG Superconductors – Paramed MRI Unit, had integrated an open 0.22T MRI scanner with a fixed proton research beamline. The proton beam was incident upon a plastic bottle filled with deionized water and placed in the scanner’s magnetic isocentre. The team used a PMMA range shifter to tailor the proton energy such that the beam stopped within the bottle, and recorded MR image slices through the centre of the beam.
The researchers performed one scan during proton irradiation, and three immediately after irradiation, using a variety of MR sequences. For two of the six MR sequences – the proton density-weighted gradient echo (GE) sequence and the inversion recovery gradient echo (IRGE) sequence – they saw signatures in the MR image that were likely induced by the proton beam. They also observed that these signals didn’t disappear immediately after irradiation, but faded over tens of seconds.
“With this experiment, we confirmed that there is a measurable proton beam-induced signal on the MR images,” said Schellhammer. “We then asked whether this could be useful for range verification.”
Next, the team irradiated the water phantom using proton beams with energies of between 190 and 225 MeV (corresponding to different beam ranges). The observed MR signal changed in depth with increasing range, and the measured residual ranges agreed with the calculated values to within 2 mm.
Repeating the experiment with four different beam currents (1, 3, 9 and 27 nA, corresponding to dose rates of 1.7, 5, 15 and 45 Gy/s) demonstrated that the signal intensity increased with increasing beam current. MR images (recorded for 20 s) were only visible using beam currents of 3 nA or more.
To investigate whether this approach may work in a patient, the team used the same experimental set-up to irradiate other liquid phantoms (ethanol and petroleum), highly viscose materials (sugar syrup, mayonnaise and gelatine) and a tissue-mimicking material (a pork chop). While images of ethanol and petroleum showed similar beam-induced signals as seen with water, for the more viscose materials and the pork chop, no signal was seen.
“It appears that the signal is only present in liquids, so likely may not be transferable to patients,” explained Schellhammer. “But this approach may well prove useful for quality assurance of proton range in future hybrid MR-proton therapy systems.”
The mechanisms underlying the observed effects are still to be unravelled. The most probable hypothesis, Schellhammer suggested, is that irradiating a liquid increases its temperature locally, creating a density difference in which the lighter heated water rises out of the imaging volume and creates a signal void. Further investigations are needed to test this hypothesis, she noted.
“I have demonstrated that proton beam range can be accurately verified with online MRI,” Schellhammer concluded. “However, today only at high doses and in fluid-filled phantoms. The method holds potential for dosimeter-free online quality assurance of MR-integrated proton therapy. Further research towards MR-based range proton beam verification is clearly justified.”
“Alexa, play some Christmas music.” “OK Google, turn on the fairy lights.” “Hey Siri, how long do you need to cook a turkey?”
This festive season, we’ll undoubtedly be chatting to our smart speakers like they’re another member of the family, and every time, the disembodied response will be almost instantaneous.
These devices – which include Amazon’s Echo, Google’s Nest and Apple’s Homepod – have already become an extra presence in more than a fifth of UK households. Indeed, in 2019 almost 147 million units were sold globally and sales for 2020 are expected to be 10% higher still. Quite simply, smart speakers have reached an astonishing level of capability for recognizing what we say. Although speculation remains as to exactly how much they are listening to and what the collected data are used for, there is no doubt that the voice-recognition technology is amazing in its accuracy. This comes down to ultrasensitive acoustic sensors and sophisticated machine-learning algorithms interpreting speech (see box “From speech to text”).
While good enough to have made it into our homes, the development of sensors for voice recognition is by no means finished. It’s not clear which technology has the most promise, and novel ideas are frequently gaining commercial attention. It also seems likely that this field, like so many others, will be altered in light of the coronavirus pandemic, with wearable sensors that can detect speech through vibrations of the throat potentially providing important diagnostic tools for diseases, such as COVID-19, that can that affect the vocal cords.
From speech to text
(Courtesy: Shutterstock/SergeyBitos)
To generate text from live speech, two things need to happen: an acoustic sensor has to convert the incoming sound waves into an electrical signal, and then software must be used to figure out what words have been said.
For the second stage, the electrical signal is traditionally first converted from analogue to digital, before being analysed using a fast Fourier transform technique to find the variation in amplitude of different frequencies over time. Little time sections of the graphs, representing small sounds known as “phones”, are matched to the ideal short sound, or “phoneme”, that they probably represent. Then algorithms build the phonemes into full speech.
Because voices vary so much, these programmes cannot just rely on a phonetic dictionary to piece together the phonemes, which is why machine learning is so useful to improve accuracy over time. When using Alexa, for example, it will “remember” when we correct it on what we said, and so become more accurate at interpreting our individual voices. Most algorithms also use a probabilistic approach to work out which phonemes are most likely to follow each other – this is called a hidden Markov model.
A single-step approach, called “end-to-end deep learning”, is now gaining popularity and is used in current voice-recognition technology. This uses a single learning algorithm to go from the electrical signal representing audio to a text transcript without extracting the phones.
Audrey and the capacitors
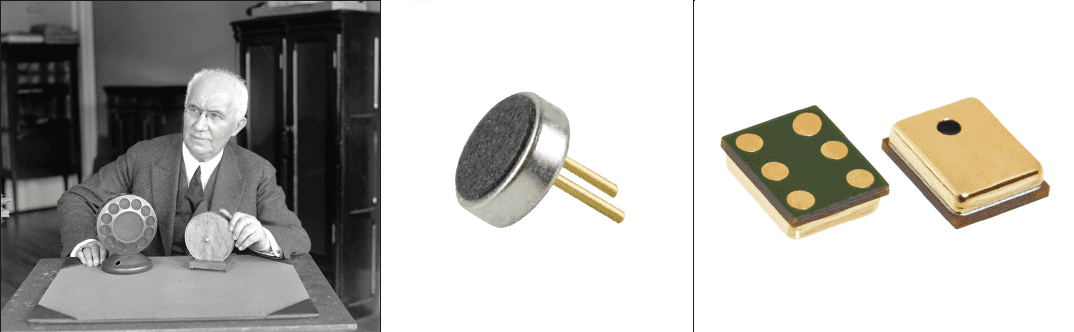
The story of how acoustic sensors reached such extraordinary sensitivities begins in the late 19th century when the first acoustic sensor, the carbon or “contact” microphone, was developed independently by three inventors – Emile Berliner and Thomas Edison in the US, and David Hughes in the UK. These devices consist of carbon granules pressed between two metal contact plates with a voltage applied across the plates. Incoming sound waves cause one of the plates, the diaphragm, to vibrate. During compression, the graphite granules deform, increasing the contact area between the plates so that the resistance of the set-up drops, and current increases. These changes as the diaphragm moves mean that the sound is encoded in an electrical current.
However, it wasn’t until 1952 that voice-recognition technology was first developed. A team at Bell Telephone Laboratories (now Nokia Bell Labs) in the US created a program called “Audrey” – the Automatic Digit Recognition machine – that could understand the digits 0–9 spoken into a standard telephone (which most likely featured a carbon microphone). Audrey could be used for hands-free dialling, but had to be trained to the user’s voice and required a room full of electronics to run.
While the computing side of voice recognition has obviously come a long way since Audrey, acoustic sensors have also gone through rigorous development. Various designs, such as ribbon, dynamic and carbon microphones, have come in and out of fashion, but the one that has prevailed for voice recognition is the capacitor, or “condenser”, sensor. Originally developed in 1916 by E C Wente of Western Electric Engineering Department in the US (later becoming Bell Telephone Laboratories), the design hinges on the fact that the voltage across a capacitor depends on the distance between the plates. To this end, the sensor features a stationary backplate and a moving diaphragm, charged up by an external voltage. As the diaphragm vibrates from the incoming sound waves, the capacitance – and hence the voltage across the capacitor – varies with diaphragm displacement, from which the amplitude variation of different frequencies in time can be calculated.
The inventors Gerhard Sessler and Jim West at Bell Telephone Laboratories further developed the capacitor sensor in 1962 by using an electret diaphragm, creating the electret condenser microphone (ECM). Electret materials, such as Teflon, have a pre-existing surface charge, which means they keep a permanent voltage across the capacitor, thereby reducing the power input needed. Roughly 3–10 mm in diameter, ECMs dominated the general microphone market for nearly 50 years, but the move towards compact devices led to drops in signal-to-noise ratio and decreased stability, particularly in variable temperature environments.
When it comes to voice recognition, ECMs have therefore been mostly replaced by micro-electro-mechanical system (MEMS) capacitive microphones. At only 20–1000 μm in diameter, these devices are typically what you find in smart speakers. MEMS sensors differ from ECMs in the internal circuitry, notably in that they convert the signal from analogue to digital while still inside the microphone. Apart from being less susceptible to electrical noise than ECMs, the design is smaller and easier to make, since the silicon wafers required can be made on semiconductor-manufacturing lines. The drawback with MEMS microphones is that they are not very durable, so do not cope well with harsh environments. This is because dust particles tend to gather under the diaphragm, limiting its vibration, and rain can also damage it. Even in ambient settings, the trapped layer of air between the diaphragm and backplate makes it harder for the diaphragm to vibrate at maximum amplitude, limiting the device’s sensitivity.
A new way?
Although capacitor sensors have dominated the industry for decades, the technology might not hold all the answers for the future. US firm Vesper Technologies is paving the way in the commercial development of piezoelectric acoustic sensors, with the endorsement of Amazon Alexa. Founded in 2014, the company’s initial designs were based on the PhD research of Bobby Littrell, the company’s chief technology officer, and the work has since won many awards.
These devices work using a diaphragm made of a piezoelectric material, such as lead zirconate titanate, that directly converts the mechanical energy from sound waves into an electrical response. When the piezoelectric diaphragm stretches as a sound wave hits, the distances between ions are increased, creating small electric dipoles in the new most energetically stable ionic arrangement. The lack of a centre of symmetry in the crystal’s unit cell means no equivalent dipoles are formed on the other side of a centre of symmetry (which would cancel out, to leave no net dipole). The cumulative effect of all of these tiny dipoles across the crystal is the generation of a voltage, which varies in time as the strain in the crystal varies.
Changing times There have been multiple acoustic-sensor designs since the carbon microphone was first developed by Emile Berliner (left, courtesy Granger Historical Picture Archive/Alamy Stock Photo), Thomas Edison and David Hughes in the late 19th century, including electret condenser microphones (middle, courtesy CUI Devices) and micro-electromechanical system capacitive microphones (right, courtesy CUI Devices).
Compared with capacitor acoustic sensors, piezoelectric devices have the distinct advantage of containing just a single layer, meaning they do not trap dirt, air or rain and so are much more durable. The devices are also self-powered, meaning the range of applications, particularly when there is limited room for a battery, is much wider.
However, thin-film devices like these – and the capacitive designs – tend to be quite difficult to make. “You need a high or ultrahigh vacuum,” explains Judy Wu, a physicist at the University of Kansas in the US, “and you need to select a good substrate because [otherwise] you will not be able to get epitaxial growth.” Epitaxial growth is what happens when a thin film grows as a single crystal with one orientation of the unit cells. This is needed so that the dipoles formed under mechanical strain all point in the same direction. “You have to really raise the temperature,” Wu continues, “to give the thermal energy and the mobility when you put the atoms on the substrate [for them] to find the minimum energy position to form a perfect lattice.”
As Vesper has shown, these conditions can be produced, but they do limit the device applications. For instance, growing a thin film of a single crystal on a flexible substrate is difficult, since single crystals have to grow on an ordered structure to be ordered themselves and most flexible materials are not crystalline. “You cannot provide a perfect lattice there – it’s just amorphous material,” explains Wu.
However, Wu and her team are working on a potential solution. They have used graphene in solution to grow piezoelectric zinc oxide nanowire arrays for a strain sensor (ACS Applied Nano Materials3 6711). As the graphene is flexible but crystalline, the nanowires grown are still piezoelectric crystals. The difficulty is that it is very delicate. The researchers overcame this by using a solution to grow the nanowires, so as not to destroy the graphene’s perfect structure with sputtering techniques, which would reduce its conductivity. Not only this, but the ambient pressure and relatively low temperature used (90 °C) mean the process is very cheap.
Their strain sensor works by detecting changes to graphene’s conductivity, which occur as a result of the extra surface charge that develops on the zinc oxide nanowire array when it is mechanically strained. Wu says they are also working on a flexible version of the sensor, encased in PET plastic. The research is still in fairly early stages, and the sensor does not have a definite application just yet, but in the hope of filling some niche function needing a sensitive, flexible sensor, they have patented the graphene process. “We want to do something the ceramic sensor cannot do,” Wu explains, “[Our sensor] might recognize your skin, or recognize your voice, because it’s very sensitive to acoustics.”
Following nature
Adding to the whirlpool of ideas in the voice-recognition field, Keon Jae Lee and his team at the Korea Advanced Institute of Science and Technology (KAIST) have been developing a new piezoelectric sensor design (Advanced Materials 32 1904020) that mimics human hearing. Speaking to Physics World, Lee light-heartedly explained his faith in the concept, “If nature is doing it, it’s probably the most efficient way.”
Their piezoelectric sensors have a similar shape to the basilar membrane in our ear (see box “How ears have inspired a new kind of voice-recognition device“), thereby allowing about twice as much information to be harvested than conventional capacitor sensors. This advantage comes from the fact that, rather than collecting a single signal containing all the frequencies and analysing that to figure out frequency amplitudes, many signals (in Lee’s case, seven) are analysed from various positions along the membrane. This wealth of information makes voice predictions more accurate. Lee and colleagues found their 2018 design exhibited 97.5% accuracy in speech recognition; a 75% improvement on a reference MEMS condenser microphone. “I think the two advantages are accuracy and sensitivity,” Lee concludes. “We can pick up sound from a long way away and recognize individual voices.”
The tricky part of their research is analysing the data from the channels to give the relative amplitudes of different frequencies, since amplitudes are modulated by the resonance behaviour of the channel. It’s why Lee thinks so few research groups have taken up the idea. But his group seems to have cracked it, and even founded a spin-off company manufacturing its unique sensors, Fronics, in 2016. Lee is optimistic for the future of the design commercially and believes the team has found the right number of channels for the sensor. It’s a fine balance, he explains, between improving your accuracy by collecting more data, and needing a bulky machine to process it all.
How ears have inspired a new kind of voice-recognition device
(Courtesy: Claus Lunau/Science Photo Library)
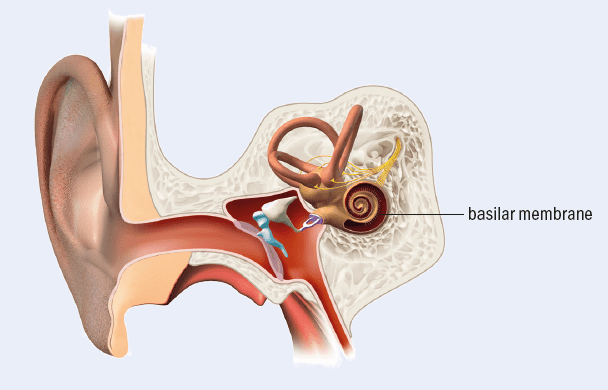
Keon Jae Lee and his team at Korea Advanced Institute of Science and Technology are developing a new voice-recognition sensor that draws inspiration from hearing in nature. It has a piezoelectric membrane that mimics the basilar membrane found in ears, which in humans is curled into a spiral inside our cochlea. Lee’s design, however, is more similar to the straight membrane found in the ears of many birds and reptiles.
Shaped like a trapezium when viewed from above, a basilar membrane is tapered: it is narrow and thick at the base (located in the centre of the spiral in our ears) and becomes wide and thin. The membrane can be thought of as a series of oscillating strings lying perpendicular to the axis of symmetry of the trapezium, except that the strings really form a continuous spectrum that waves can pass between.
An incoming sound creates a travelling wave that passes down the membrane, beginning at the wide, thin end. Essentially a superposition of individual waves of different frequencies, as each wave travels down the membrane, it will reach one of the oscillating strings that has a resonant frequency equal to the wave’s own frequency and will vibrate most strongly here. The membrane is covered by more than 10,000 hair cells, which transmit information to the brain about the amplitude of the frequency at their position along the membrane.
Ears are more complex than this membrane alone: for example the hair cells also amplify the “correct” frequency for that position on the basilar membrane. But the concept of a collection of resonating sections of a membrane is the key to Lee’s design.
Neck sensors and COVID-19
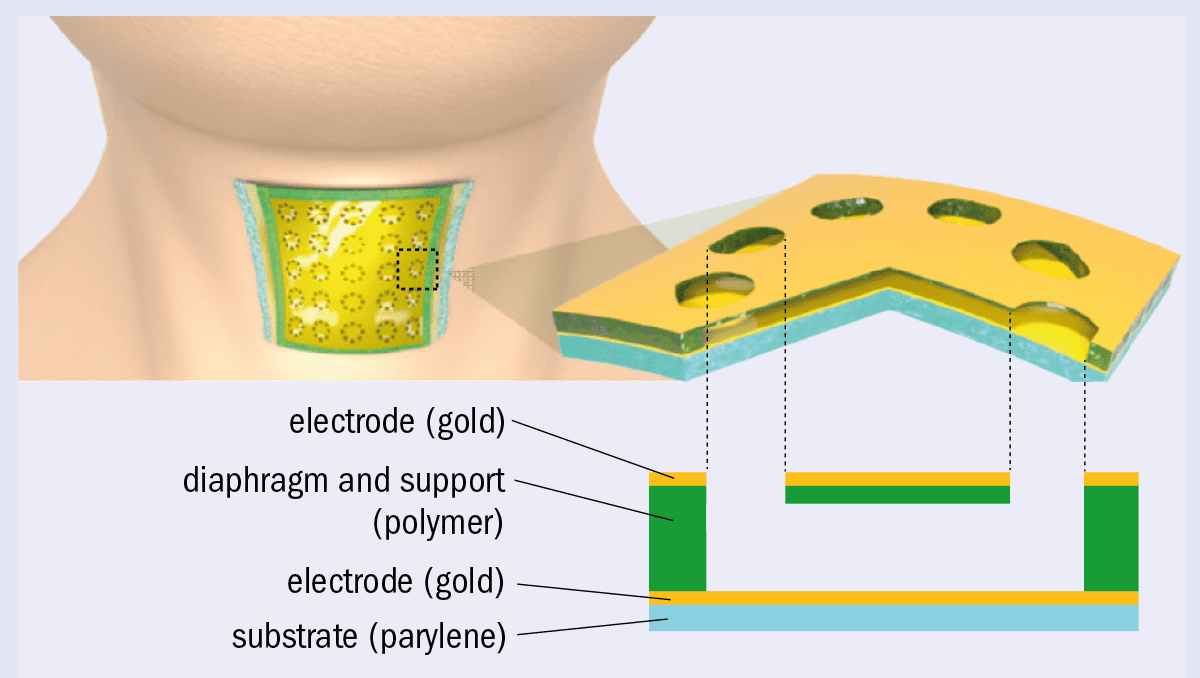
Voice-recognition technology is not limited to a device sitting in the corner of your room or in your pocket. Sensors that work using neck vibrations, instead of sound waves travelling though air, would be very useful where sound propagation is almost entirely prohibited, such as noisy industrial environments or when people have to wear bulky equipment like gas masks. A breakthrough occurred late last year when Yoonyoung Chung and his team from Pohang University of Science and Technology, South Korea, reported creating the first flexible and skin-attachable capacitor sensor, which can solve this problem by perceiving human voices through neck-skin vibrations on the cricoid cartilage (part of the larynx). Demonstrating that skin acceleration on the neck is linearly correlated with voice pressure, they realized that they could measure the variation of voice pressure in time by designing a device that detects skin acceleration through changes in capacitance (Nature Communications10 2468).
The sensor Chung’s team has created is less than 5 μm thick and the diaphragm is made from epoxy resin (figure 1). “We wanted to develop a flexible microphone sensor, so it was natural for us to use a polymeric material, which is intrinsically flexible,” explains Chung. The individual sensor panels are small enough that any neck curvature is negligible in them and will not affect vibrations – a bit like how the Earth’s curvature seems small enough to ignore from our perspective, since we occupy such a small proportion of its surface.
1 Electronic skin The throat sensor developed by Yoonyoung Chung and colleagues at Pohang University of Science and Technology in South Korea, illustrated above, consists of a crosslinked ultrathin polymer with a hole-patterned diaphragm structure. (CC BY 4.0 Nature Commun.10 2468/CC BY Christian Rambow)
What’s also vital for capacitive sensors is that they have a “flat frequency” response. This means that no frequencies appear falsely high in amplitude because of a resonance in the device, and it makes electrical signals much easier to analyse. In order to achieve this, the diaphragm must have a narrow resonance peak that lies well above the frequency range of the human voice. Chung achieved the narrow width by making the diaphragm from a fully cross-linked epoxy resin with a low damping ratio. Cross-linking prevents the movement of molecules past each other and the oscillation and conformational flip of the phenyl rings, which would all lead to friction between molecules. The second condition, a high resonant frequency, could be achieved by either a high stiffness or a low mass. The snag is that a device that’s less stiff is actually more sensitive because the diaphragm’s vibrations are bigger. Chung has found a solution to this stiffness dilemma: instead of reducing the stiffness of the bulk material, he added holes to the diaphragm. The holes reduce the diaphragm’s mass to satisfy the high resonant frequency, while keeping stiffness low to increase sensitivity. “This solution has also been commonly used in the silicon MEMS area in order to reduce the air resistance,” adds Chung.
The group has submitted patent applications for the design and is collaborating with several industry partners, though Chung is careful to note that commercialization is still in the early stages, since there is more research to be done in the lab. “We are now trying to make a sensor interface circuit on a flexible substrate so the entire sensory system can be attached on the neck skin without any difficulties,” he explains. The current design has a rigid circuit board, which can cause occasional problems by suppressing neck vibrations.
Throat sensors like these could also be used to diagnose illnesses like COVID-19, which have symptoms that manifest themselves in the vocal cords. Researchers from the Massachusetts Institute of Technology in the US have found that COVID-19 changes our voice signals by affecting the complexity of movement of the muscles in the throat (IEEE Open Journal of Engineering in Medicine and Biology1 203). They hypothesized this to be due to an increased coupling between muscles, preventing them from moving independently. Sensor devices paired with an app could provide early-stage screening to alert people to seek further testing for COVID-19. “It can also be used as a cough detector to diagnose people,” speculates Chung, while considering clinical uses for sensors like his. Even Vesper, though its current designs are not flexible, has shown interest in this potential outlet for innovation. “Our team is already brainstorming new ideas such as acoustic respiratory health monitors,” wrote its chief executive Matt Crowley in a blog post in March about the pandemic.
An advantage of sensors being repurposed from a voice-recognition context is that there is money available for developing the technology. Well-resourced tech companies are always on the lookout for technology that has exciting prospects for smart devices – such as sensors like Lee’s and Chung’s, which are sensitive enough to recognize individual voices in lieu of a password or fingerprint. And given the human need, as a result of the pandemic, to quickly detect respiratory illnesses on a mass scale, throat-monitoring devices will likely be on a fast-track to becoming a viable diagnostic technology. It will be interesting to see how both of these areas of innovation evolve over the next few years following the pandemic. Likewise, the debate between capacitive and piezoelectric sensors will continue to change, possibly as a result of manufacturing improvements, or the changing demand for certain features, like flexibility and resistance to harsh environments.Perhaps, one crisp December morning as you wait for the Brussels sprouts to boil, you might ask your smart speaker for an update.
Uranus and Neptune are the least-explored planets in our solar system. Apart from the Voyager 2 spacecraft, which flew past them in the 1980s, no human-built probe has ever ventured near them. They are also small and far away, covering just 3.8 and 2.3 arc-seconds of the Earth’s sky, respectively. That makes it hard for even the best telescopes to pick out their features. Indeed, one of the few things we do know is that much of our knowledge about their appearance is no longer accurate, because they are not static. Instead, they are incredibly active worlds, with convective clouds that rise up like thunderheads and send streamers flying through their slushy atmospheres and giant storms that last for years.
The other thing we know about Uranus and Neptune is that planets of this type are very common. According to Heidi Hammel, vice-president for science at the Association of Universities for Research in Astronomy (AURA), most of the exoplanets discovered so far are in “the Neptune to sub-Neptune range” in terms of their size, yet these so-called “ice giants” have never been thoroughly investigated. “We’d like to change that,” Hammel told audience members at the annual Appleton Space Conference, which was held virtually this year on 3 December.
During her talk, Hammel laid out numerous reasons for sending spacecraft back to these icy outer worlds. The ice giants, she explained, have interiors that differ fundamentally from those of rocky planets like Mercury, Venus, Earth and Mars. But they aren’t composed of hydrogen like Jupiter and Saturn. Instead, they are made of ices, which in astronomical terms are mixtures of various frozen stuff. Theoretical models suggest that both planets have cores composed of iron, nickel and silicates, but “The bottom line is, we don’t know what the interior is,” Hammel said.
Limited knowledge
Hammel went on to explain that our knowledge of Uranus is especially limited because of the timing of the Voyager 2 flyby. For reasons that are not fully understood, but likely stem from an impact early in its formation, Uranus’ rotation is tilted at 90 degrees with respect to its orbit. This is very unusual for a planet, and unfortunately it meant that Uranus was in its southern solstice when Voyager 2 made its nearest approach. In this configuration, the planet’s northern hemisphere is completely dark – meaning that Voyager 2 couldn’t image half its surface (or half of its moons), and that half of it was not receiving any energy from the Sun.
Another view of Uranus A 2006 image taken by the Hubble Space Telescope shows bands and a new dark spot in Uranus’ atmosphere. (Courtesy: NASA/Space Telescope Science Institute)
This lack of sunlight helps to explain why images obtained during the 1986 flyby were, in Hammel’s words, “fairly dull”, with only 10 features visible. By 2004, when the 10 m diameter ground-based Keck telescope was trained on Uranus, it was a different story. With the planet now side-on to the Sun, Hammel noted, “funny things happened: the planet turned on”. Instead of a smooth, pale-blue dot, the Keck images showed popcorn-like clouds similar to the ones the Cassini spacecraft saw on Saturn. Similarly, an image obtained by the Hubble Space Telescope in 2006 showed dark bands that were absent when Voyager 2 made its historic visit.
Neptune, in contrast, was plenty active during its Voyager 2 flyby in 1989. At the time, it exhibited a huge dark patch on its flank that observers likened to the “Great Red Spot” on Jupiter. Within five years, though, images obtained by Hubble showed that Neptune’s dark spot had vanished. (Jupiter’s spot, in contrast, has been around for at least 400 years.) The dark spot was still absent in 2011, when Neptune was imaged again, but by 2016 it – or, rather, something like it – had reappeared.
The star of the Uranus–Neptune system, though, is Neptune’s moon Triton. This icy chunk of rock is a twin of the dwarf planet Pluto, and it was probably captured from the Kuiper belt by the pull of Neptune’s gravity. Unlike Pluto, though, Triton has active cryovolcanoes, and Voyager 2 flew past during an eruption that sent a plume of material 8 km into the moon’s tenuous atmosphere before the winds captured it. That makes Triton one of only five moons in the solar system known to be geologically active, and thus an attractive target for a space mission like the ones sent to explore the others: Saturn’s moons Enceladus and Titan (Cassini) and, soon, Jupiter’s moons Io and Europa (JUICE).
Visual aid Heidi Hammel answers a question about Uranus’ rings during her Appleton Space Conference talk with the help of a stuffed toy model. (Courtesy: Margaret Harris)
At present, no mission is scheduled for either of the ice giants. Though a Uranus orbiter was discussed during the last decadal survey for planetary science – a prioritization exercise conducted every 10 years by the US National Academy of Science, Engineering and Medicine on behalf of NASA – it wound up third on the list, behind missions to Mars and Europa. Several missions have, however, been proposed for the next decadal survey, including a Triton-only mission called Trident and a wider system explorer called Neptune Odyssey. And with the results of that survey due out in 2023, it’s certainly not too early for lobbying. Speaking with stuffed toy versions of Uranus and Neptune displayed prominently in the background, Hammel reminded her audience that Uranus’ rings are a particular mystery. It has grown new ones since the Voyager 2 flyby, and we know they are coloured red, blue and grey. But what are they made of? Where do they come from? So far, the answer isn’t clear. “We must send a spacecraft there to really study the rings in detail,” Hammel concluded. “We are all hoping that this is finally the era for going back to the ice giants.”
Just as topological insulators provide protection to electrons travelling along their edges and surfaces, photons can also be topologically protected. This can occur when photon scattering modes are associated with just one spin state. Now, researchers in India and the Netherlands have found that spin-selective or spin asymmetric scattering modes can be observed using a twisted nematic-liquid-crystal-based spatial light modulator. Their work indicates that liquid crystals can host topological states by controlling the interaction between disorder of the material and the spin-orbit interaction of light.
Topology goes photonic
Topology is the field of mathematics concerned with geometric objects that do not change when continuously deformed. Properties that are invariant when deformed are said to be topological. Recently, physicists have become more and more interested in applying topological principles in physical systems with a view to exploiting topological invariance whereby particles are not affected by local perturbations. A spin-polarized current of electrons, for example, can flow without scattering in topological materials that could have significant technological applications. Although much of the research focus has been on electronic, many research groups are now turning their attention to photonics.
In the case of photons, topological protection can arise when photons travelling through a medium are controlled so that their spin is “locked” to a particular propagation direction. This can be achieved by controlling the interplay between the spin angular momentum of the beam (its circular polarization) with its orbital angular momentum. When travelling through certain materials, it is thought that a Gaussian beam can be manipulated so that its scattering modes are spin selective.
Shining a light on anisotropic materials
In their recent study, published in Physical Review A, Ankit Kumar Singh and colleagues at the Indian Institute of Science Education and Research Kolkata and Delft University of Technology have demonstrated a method for producing spin-selective scattering modes in the Fourier spectrum of a Gaussian beam passing through a liquid crystal-based modulator.
Their experiment used a helium-neon laser to produce a Gaussian beam which was spatially filtered and then linearly polarized. The beam then passed through the medium — a transmission spatial light modulator made of a liquid crystal. This had properties that could be controlled using an applied voltage, resulting in a random phase distribution. Following this, the beam was passed through a polarization state analyser consisting of a quarter wave plate and another polarizer. This enabled researchers to measure the distribution of left circularly polarized and right circularly polarized light once the beam was focused onto a photodetector.
They found that randomly scattered modes were only observed for the right circularly polarized projection, whereas the left circularly polarized projection showed no scattering modes. From this, they concluded that the randomly scattered modes only occur for one spin state of the light, while the other travels through the medium mostly unaffected by the disorder of the system.
The future of photonics
Though still in its infancy, the field of topological photonics provides exciting possibilities for the future of light-based technologies. Potential applications of spin-controlled photon systems range from high-resolution imaging techniques to microparticle trapping. Understanding the topological properties of light as it interacts with different materials will enable researchers to develop more robust technologies in the future.
The Japanese space agency, JAXA, has successfully retrieved a 16 kg capsule that is hoped to contain flecks of an asteroid. The capsule landed in Australia’s remote outback following a six-year mission by the $250m Hayabusa 2 mission to retrieve samples from the asteroid Ryugu. Scientists will now study the contents of the capsule to find out about the origin of the asteroid’s organic matter and water and how these are related to life and ocean water on Earth.
Hayabusa 2 is a successor to Japan’s original Hayabusa craft, which returned with the first-ever samples from an asteroid back in 2010. Japan’s second asteroid sample-return mission was launched on 3 December 2014 from the Tanegashima Space Centre in Japan. It arrived in 2018 at Ryugu – an almost spherical carbon-rich asteroid that is 920 m in diameter and is thought to contain organic matter and hydrated minerals.
I hope this will shed light on how the solar system was formed and how water was brought to Earth
Hiroshi Yamakawa
The original Hayabusa mission managed only to scrape the surface of the asteroid Itokawa bringing back miniscule grains of rock. Hayabusa 2 instead released a 2 kg impactor months before touching down on the body, which it managed to do in November 2019.
The impactor hit the asteroid’s surface and make a small crater several metres in diameter allowing fresh material to be exposed. After collecting samples, Hayabusa 2 then headed home in November 2019, releasing the capsule from an altitude of about 200 km on 5 November 2020 when it returned to Earth via parachute.
The capsule was located by officials and then flew by helicopter for analysis at the Woomera Test Range – a weapons testing facility in South Australia. JAXA noted that the sample container was properly sealed and the team also carried out preliminary gas-sampling but this was inconclusive. The capsule was then flown to Japan from Woomera Airport where it will be transported to a JAXA research facility for further analysis.
“I hope this will shed light on how the solar system was formed and how water was brought to Earth,” JAXA’s president Hiroshi Yamakawa told a news conference.
A new label-free optical imaging technique based on unscattered light can detect nanoparticles as small as 25 nm in diameter. The technology overcomes several limitations of other advanced methods for imaging tiny particles, and its developers at the University of Houston and the University of Texas M D Anderson Cancer Center in the US say it might be used to study viruses and other structures at the molecular level.
Imaging nanoscale objects via optical techniques is difficult for two reasons. First, the objects’ small size means that they scatter little light, making it hard to distinguish them from the background. Second, individual nano-objects within a close-packed group tend to be separated by distances that are smaller than the diffraction limit for visible light (around a few hundred nanometres) making it impossible to resolve them with conventional methods.
Surface plasmons
In recent years, researchers have developed techniques that go some way towards overcoming these problems. For example, methods such as surface plasmon resonance (SPRI) imaging and localized surface plasmon resonance imaging (LSPRI) rely on propagating light-excited plasmons rather than photons. Plasmons are collective oscillations of the conductive electrons on the surfaces of nanoparticles, and they allow the particles to act like tiny antennas: absorbing light at certain resonant frequencies and efficiently transferring it to nearby molecules so that they shine brighter.
These plasmon-based methods work by detecting the minute changes in the refractive index of an object placed on a metallic thin film. Since most materials have a refractive index that is higher than the ambient medium (usually water or air), SPRI can detect features of the object without having to label them with tracers such as the fluorescent dyes routinely employed in conventional optical imaging.
SPRI, however, still suffers from diffraction-limited resolution in the direction across the sample. This is due to the propagating-wave nature of surface plasmons, which “smears out” the image produced. LSPRI is better in this respect because it relies on non-propagating surface plasmons, which are localized in metallic nanostructures and nanoparticles that are roughly the same size as (or smaller than) the wavelength of the light being used to excite them.
Until now, researchers have mainly used LSPRI in conjunction with dark-field microscopy, which only collects light that is scattered by the sample onto a cone centred around the instrument’s optical axis. While this scattered light produces a bright image of the sample’s features, in contrast to the dark background, the technique often transmits insufficient light. This means it can “miss” some features and be “blind” to anything outside the sensing near-field.
Monitoring changes in the unscattered light transmitted
The new technique, developed by Wei-Chuan Shih at the University of Houston and colleagues, addresses the issues currently blighting SPRI and LSPRI. Known as PANORAMA (for PlAsmonic NanO-apeRture lAbel-free iMAging), it uses a glass slide covered with gold nanodiscs. This setup allows researchers to monitor changes in the unscattered light transmitted by the sample (in this work, an ensemble of polystyrene nanospheres) through the slide. They can thus determine characteristics of the sample, such as the number of particles in it and the size of individual particles.
With PANORAMA, Shih notes that there is no need to label a sample since the technique does not rely on detecting the light scattered from a nanoparticle. Another important advantage is that it uses a standard bright-field microscope commonly found in any laboratory. This means it can simultaneously image everything within the objective’s depth of focus with a single (tungsten-halogen) lamp source and a single camera, he explains.
True to its name, the new technique also provides a panoramic view of a sample in both lateral and longitudinal directions, overcoming the lack of imaging depth in both SPRI and LSPRI and insufficient lateral sampling in LSPRI, Shih adds. The bright-field approach also provides much higher light throughput compared to dark-field microscopy.
Smaller than 25 nm?
The researchers think the resolution of their techniques may be even smaller than 25 nm. They say they stopped at this size only because that is the smallest polystyrene nanoparticle they could buy.
The team, which includes researchers Nareg Ohannesian and Ibrahim Misbah in Houston and Steven Lin at the M D Anderson Cancer Center, now plans to employ PANORAMA to analyse functionalized single biological nanoparticles (such as proteins, viruses and extracellular exosomes) for diagnostic applications.
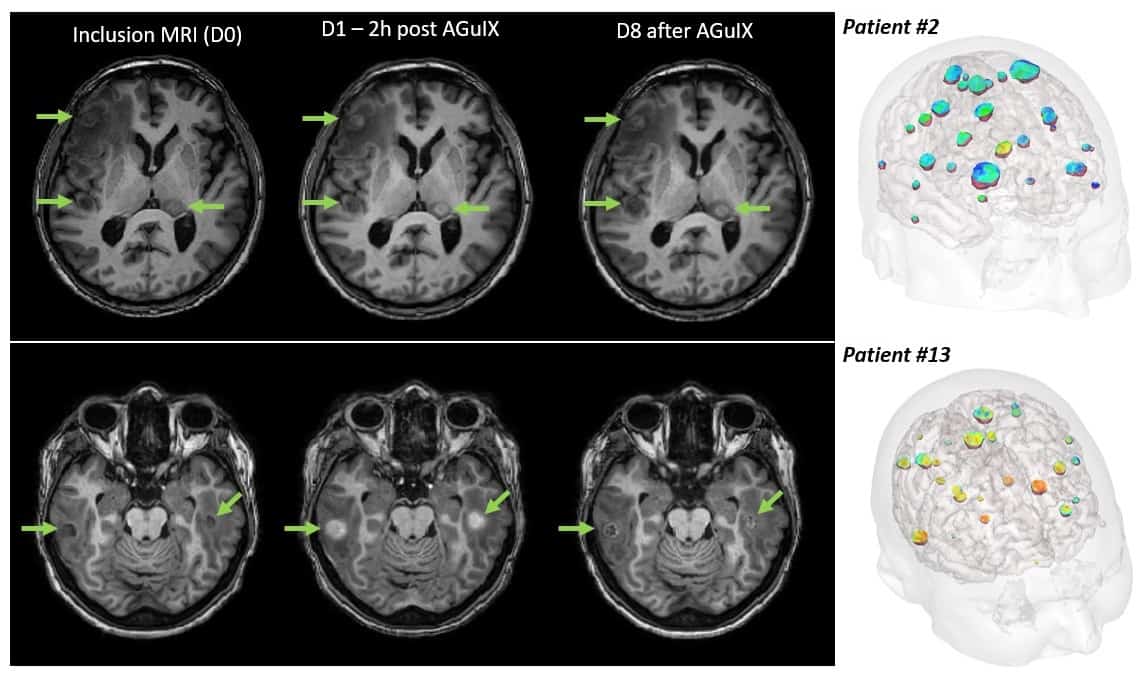
MR images showing uptake of AGuIX nanoparticles in brain metastases for two patients in the NANO-RAD1 study. The far-right images show 3D colour-coded reconstructions of metastases containing AGuIX. (Courtesy: Camille Verry)
Radiotherapy plays an essential role in the management of cancer, but unwanted irradiation of healthy tissues can lead to adverse side effects and limit the deliverable tumour dose. Radiosensitizers, which preferentially sensitize tumour cells to irradiation, can increase the therapeutic window and enable higher target doses without increasing normal tissue damage.
One approach under investigation to improve the effectiveness of radiotherapy is the use of nanoparticles as radiosensitizers. And at the recent ESTRO 2020 congress, attendees heard about some of the latest developments and clinical studies in this field.
Dual-purpose particles
At an ESTRO session focused on novel technologies, Camille Verry from Grenoble Alpes University Hospital described the first-in-man study of gadolinium-based AGuIX nanoparticles as radiosensitizing agents. AGuIX nanoparticles, which are around 4 nm in size, are also MRI contrast agents, enabling visualization of their localization.
Camille Verry from Grenoble Alpes University Hospital.
In a phase I study, NANO-RAD1, the researchers treated 15 patients with multiple brain metastases from melanoma, or lung, breast or colon cancer. After intravenous injection with the nanoparticles, the patients received a 30 Gy dose of whole-brain radiotherapy in 10 fractions. The team used five AGuIX dose levels, from 15 to 100 mg/kg, to determine the maximum tolerated dose.
“The study design is simple, we give one injection on the day of the first radiotherapy fraction,” explained Verry. “Two hours after the injection, we perform MRI for each patient to see the nanoparticle distribution, and then perform the radiotherapy.”
MR images showed that AGuIX localized in all of the metastases, regardless of primary tumour type, with no nanoparticles seen in healthy brain tissues two hours after injection. The results also revealed that the nanoparticles were safe at all dose levels. “There was good immediate tolerance, no pain, no systemic reactions and no local complications,” said Verry. “So we can treat with 100 mg/kg, which is now the recommended phase II dose.”
The team also noted that at seven days post-injection, AGuIX was still present in all the brain metastases, albeit at a lower level. “That’s good news if you want to perform dose enhancements with daily radiotherapy,” added Verry.
Of the 14 evaluable patients, 12 experienced a clinical benefit from the treatment, with a decrease in tumour volume. The overall survival was approximately 5.5 months and roughly one third of patients were alive at 12 months.
The researchers also analysed each metastatic lesion (255 in total) before and 28 days after treatment. They observed a correlation between AGuIX uptake and tumour response, with increased AGuIX in the tumour leading to a greater clinical response one month after treatment.
Verry described two example case studies. In the first, a male with lung cancer and eight metastases that had not responded to chemotherapy, radiotherapy with AGuIX at 15 mg/kg reduced the tumour volume from 45 to 15 cm3 three months after treatment. In a second example, a woman with pulmonary adenocarcinoma and 28 metastases was treated with whole-brain radiotherapy plus AGuIX at 100 mg/kg. This led to a large reduction in the number of metastases at up to nine months after treatment.
“We have performed the first administration in humans of AGuIX,” Verry concluded. “The immediate tolerance of this treatment is good and the nanoparticle distribution is favourable, with very important tumour uptake without nanoparticles in healthy brain.”
The next steps are to demonstrate the efficacy of this approach, optimize AGuIX administration and learn about any long-term toxicities. To achieve this, the team had launched a phase II clinical trial, which is currently recruiting in 15 French hospitals. The trial will include 100 patients with multiple metastases not suitable for stereotactic radiotherapy or surgery, randomized to receive whole-brain radiotherapy with or without AGuIX nanoparticles.
Dose enhancement
Speaking in the same ESTRO session, Christophe Le Tourneau from Institut Curie described the use of radiotherapy-activated hafnium oxide nanoparticles for treatment of head-and-neck squamous cell carcinoma (HSNCC). The standard-of-case for patients with unresectable locally advanced HNSCC is concurrent chemoradiation. But chemotherapies do not confer much benefit in older patients and their prognosis is poor, with a median overall survival of 12-13 months.
To address this shortfall, Le Tourneau and collaborators aim to use the non-toxic hafnium oxide nanoparticle NBTXR3 to boost the effects of intensity-modulated radiotherapy (IMRT).
Christophe Le Tourneau from Institut Curie.
“NBTXR3 is designed to trigger cellular destruction, first by multiplying the number of electrons that are produced when they are irradiated, and also to prime the immune response,” said Le Tourneau.
With these nanoparticles present, he explained, the dose delivered during radiotherapy is multiplied by nine times at the cellular level compared with irradiation alone.
The team’s Phase I dose escalation study (performed in five centres in France and Spain) included 19 elderly patients with stage III or IVa HNSCC who were older than 65 and ineligible for chemotherapy. The investigators tested four nanoparticle dose levels, calculated as 5, 10, 15 and 22% of the primary tumour volume.
Patients received a single intra-tumoural injection of NBTXR3, followed by 35 2-Gy radiotherapy fractions over seven weeks. The study participants experienced no dose-limiting toxicities or serious adverse events (SAEs) related to the nanoparticles. As such, the team defined the recommended dose as 22% of baseline tumour volume. “Interestingly, nine out of 13 evaluable patients treated at a dose of 10% of volume or more had a complete response of the treated tumours,” said Le Tourneau.
Next, the researchers performed a dose expansion study including 44 patients from 12 centres across Europe. Patients had a median age of 70 and many comorbidities. In this group, 7% of patients had at least one SAE due to injection procedure or the nanoparticles. There were also 21 SAEs related to radiotherapy, but these toxicities were as expected with IMRT alone. Overall, 67.7% of the patients had complete response of their primary tumour.
“The intra-tumoural administration of NBTXR3 prior to IMRT is well tolerated and safe in frail HNSCC patients with multiple morbidities,” Le Tourneau concluded. “We saw an objective response in 83.9% of patients who were evaluable. Recruitment into the dose expansion trials is now being finalized. And based on these promising results, a global randomized phase III trial is being planned.”
Johannes Handsteiner explains the principles of quantum key distribution (QKD) and why – in theory – it is significantly safer than classical secure communication protocols. While working at the Institute for Quantum Optics and Quantum Information (IQOQI) in Vienna, Austria, Handsteiner tested a form of QKD based on entangled photons.
The interview was recorded in 2019 before the COVID-19 pandemic. Handsteiner now works at Quantum Technology Laboratories, a company involved in contract research using QKD.
A simple miniature thermometer that can quickly and accurately measure the temperature of ultracold microwave-based devices has been built by Joel Ullom and colleagues at the National Institute of Standards and Technology (NIST) in Boulder, US. The device works by monitoring temperature-sensitive shifts in the frequency of a superconducting microresonator – rather than measuring changes in electrical resistance, which is how most conventional electronic thermometers operate. The team believes that its thermometer could soon be used to monitor the temperatures of cryogenic microwave devices including superconductor-based quantum processors.
From superconducting qubits to kinetic inductance detectors in telescopes, a growing number of microwaves devices must be maintained at sub-Kelvin temperatures to operate effectively. However, there are many ways that heat can get into these devices, so it is critical to monitor devices’ temperatures in real time. This can be done using existing low temperature thermometers, but integrating these devices in ultracold systems requires a connection to room-temperature electronics, which can introduce heat or otherwise adversely affect device operation.
Two-level systems
The new NIST thermometer instead uses existing microwave connections to monitor temperature. The device was made by coating a superconducting niobium microwave resonator with silicon dioxide. This creates “two-level systems” (TLS), which are quantum states that interact with the photons in the resonator. Crucially, the presence of the TLS changes the resonant frequency of the resonator – and this frequency shift is a function of temperature. Therefore, the temperature of the resonator can be determined by simply measuring its frequency.
Ullom and colleagues used their TLS thermometer to measure the temperature of a microwave device called a kinetic inductance travelling-wave parametric amplifier. After achieving strong coupling between the thermometer and the microwave cable used to feed the amplifier, they showed that the thermometer can measure temperatures between 50-1000 mK – with a uniform sensitivity across this range. By using the existing microwave cable to read out the thermometer, there was no need for a connection to room-temperature electronics.
Measuring just 2.5×1.15 mm in size, the thermometer can be mounted onto a chip, and can make measurements in around 5 ms – a significant improvement on the 100 ms times possible with existing thermometers.
“The thermometer allows researchers to measure the temperature of a wide range of components in their test packages at very little cost and without introducing a large number of additional electrical connections,” says Ullom.
The team says that the thermometer could be mass-produced and could soon be used to monitor temperature in a range of applications including superconductor-based quantum processors and quantum sensors.