New map pinpoints US power lines susceptible to space weather super-storms

A new geoelectrical hazard map covering two-thirds of the United States has been released by the US Geological Survey (USGS). The map shows the voltages liable to be induced on the US power grid in the event of a once-in-a-century magnetic super-storm and it could help power companies better protect their infrastructure and reduce the risk of future blackouts.

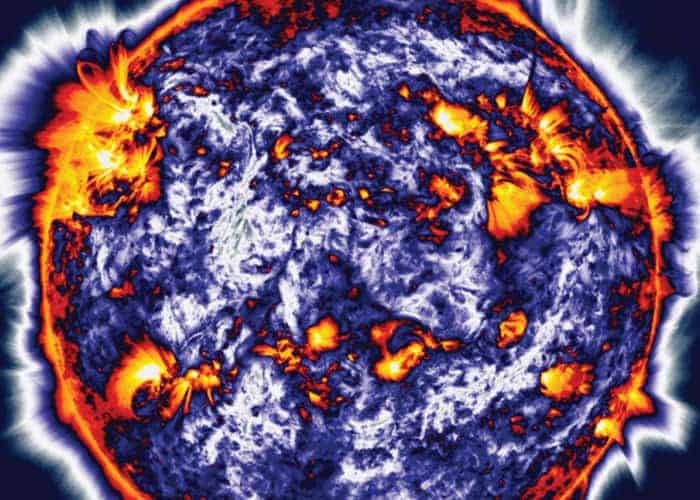
Geomagnetic storms are rare disturbances of the Earth’s magnetic environment that begin with large ejections of charged particles from the Sun that boost the intensity of the solar wind. When these particles reach Earth, they interacts with the magnetosphere and ionosphere to create a magnetic storm. If the original coronal mass ejection is large enough, the result is a magnetic super-storm.

These storms generate electric fields in the Earth’s crust and mantle — which have the potential to disrupt electric power grids and even cause large-scale outages. In the March of 1989, for example, a storm caused a 9 h blackout in Quebec, Canada. Larger events — like the storms that struck in May 1921 and “Carrington storm” of 1859 — caused stunning aurora and widespread disruption to telegraph networks, even setting some telegraph stations on fire.

Huge economic cost

According to the US National Academy of Sciences, were a super-storm of similar intensity to the Carrington event to strike the US today, it would cause widespread blackouts, significant infrastructure damage and cost the US economy some $2 trillion.

In their study, Jeffrey Love and colleagues at the USGS analysed magnetic measurements – both long-term monitoring of geomagnetic disturbances by ground-based observatories during 1985-2015 and magnetotelluric surveys of the local electrical conductivity of the Earth.

They combined these with the most recent public maps of America’s high-voltage transmission lines. The geographical limits of the study were constrained by the fact that, to date, only the upper two thirds of the US mainland has been magnetically surveyed.

Four regions at high risk

The team identified four areas of the US that would be particular vulnerable in the event of a geomagnetic super-storm: the East Coast; the Denver metropolitan area; the Pacific Northwest; and the Upper Midwest. In some areas, transmission line voltages could approach 1000 V in the event of a super-storm, they found.

“It is noteworthy that high hazards are seen in the northern Midwest and in the eastern part of the United States – near major metropolitan centres,” Love told Physics World. These areas of increased hazard are the result of three factors, he explained – “the level of magnetic storm activity, the electrical conductivity structure of the solid Earth, and the topology of the power grid”.

The research demonstrates the importance of underlying geological structures on the intensity of storm-induced voltages in given areas. In areas of more electrically resistive rock, it is difficult for currents to flow through the ground in response to a storm-induced geoelectric field. Instead, huge and destructive currents are driven along power lines – a scenario that played out in Quebec.

Long lines are more susceptible

In addition, the team note that regions full of long transmission lines – such as might connect geographically sparse centres of population — might be particularly susceptible to geomagnetically-induced current. “Long transmission lines tend to experience greater storm-time voltage because voltage is the integration of an electric field across a length — in this case the length of the transmission line,” Love explained. “Whether or not this voltage, however, translates to a problem for the power grid depends on the parameters of the grid: line resistance and interconnectivity.”

“The new voltage map is a critical step forward in our ability to assess the nation’s risk to geoelectrical hazards,” said USGS director Jim Reilly. “This information will allow utility companies to evaluate the vulnerability of their power-grid systems to magnetic storms and take important steps to improve grid resilience.”
“One of the main challenges for risk analysts when it comes to space weather hazards has been the lack of data available to help establish worst-case scenario,” commented Edward Oughton, a data scientist from the University of Oxford’s Environmental Change Institute. “This uncertainty holds back effective decision making, and leads to a non-optimal allocation of limited resources.”

With their initial study complete, the researchers are now awaiting the completion of the magnetotelluric surveying of the outstanding, southwestern, part of the contiguous United States – a project for which funding has recently been legislated. When this has been completed, Love said, the team will combining these measurements with observatory data to complete the mapping project.

The research is described in the journal Space Weather.
How does respiratory motion impact pencil-beam scanning proton therapy?

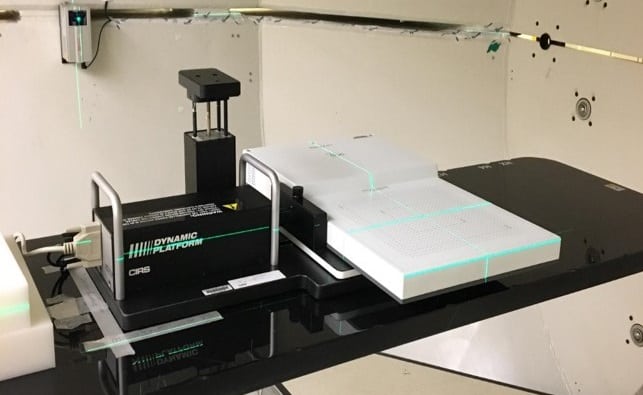
Measurement set-up

Intensity-modulated proton therapy (IMPT) delivered via proton pencil-beam scanning (PBS) is one of the most precise methods available to target tumours with high radiation doses while minimizing the impact to surrounding healthy tissue. However, the interplay effect, caused by interaction of respiratory-related tumour motion and the motion of the proton beam, can negatively affect radiation dose distribution.

Much research has been published about the interplay effect. A measurement-based study of symmetric and asymmetric breathing patterns from the University of Cincinnati College of Medicine has now reconfirmed that standard fractionation can be used to treat moving targets with symmetric motion amplitude less than 5 mm, and that using a higher fractionation regimen will help minimize interplay effect-caused degradation of target dose. But the study also found that this is not the case for small tumour targets affected by large motion and irregular breathing patterns  (J. Appl. Clin. Med. Phys. 10.1002/acm2.12846).

By measuring beam delivery of up to 15 treatment fractions, with different symmetric and asymmetric breathing patterns, the researchers determined that irregular motion causes systematic errors that cannot be recovered by increasing fractionation. For patients with irregular breathing, patient-specific motion management is needed to ensure effective dose delivery to the target tumour and to reduce toxicities to surrounding healthy tissue.

Principal investigator Eunsin Lee and colleagues quantified the dosimetric influence of the interplay effect for different target sizes, motion amplitudes and pencil-beam spot sizes. They did not use any simulation models or treatment delivery logfiles, but rather delivered an actual fractional dose of 200 cGy multiple times for a specific number of fractions.

Eunsin Lee

“In PBS proton therapy, each layer is delivered in a series of discrete pencil beam spots. The scanning magnets are used to reconfigure the system to deliver dose in the subsequent position,” explains Lee. “This is not an instantaneous process. In the presence of tumour motion due to respiration, the spot can be delivered in an incorrect position. This makes scanning proton beams inherently sensitive to motion, because in addition to the motion of the tumour, the beam itself is also moving during the delivery.”

“The effect is random, so if a desired dose is delivered in a small fractional dose in multiple days, the interplay effects can be mitigated,” he adds. “We wanted to quantify how differently fractionation mitigates the interplay effect by utilizing a conformity index and a homogeneity index and as a function of fractionations.”

The team generated treatment plans to mimic 3- and 10-cm diameter spherical targets, at 1 and 5 cm depths in a solid water phantom. All target volumes were covered by 95% isodose line. They simulated respiratory motion ranges of ±0.5, ±1.0 and ± 2.0 cm, using sine and cosine4 waves to represent sinusoidal symmetric and realistic asymmetric breathing patterns, respectively.

The researchers delivered a dose of 200 cGy per fraction in 1, 5, 10 and 15 fractions. For the small 3 cm target, they used an energy spectrum of eight layers with 119 spots at the shallow depth, and nine layers with 296 spots at the deeper depth. For the larger 10 cm targets, they used 22 layers with 1488 spots at 1 cm and 23 layers with 4615 spots at 5 cm.

They then evaluated the dose conformity and uniformity of each measurement dataset at the centre plane of each moving target. They determined that breathing patterns had a larger impact on dose distribution conformity, but less impact on homogeneity. Dose homogeneity was impacted to a greater extent by intrinsic beam spot characteristics.

Based on their actual measurements, the researchers reconfirmed findings of prior studies that the interplay effect decreased as the numbers of fractions delivered increased. However, increasing fractionation did not improve dose conformity or homogeneity in cases of relatively large motion, such as deep breathing by a patient when a small tumour was being targeted.

“Our study was limited to investigating PBS interplay effect with a simple geometric shape of a moving target in a homogeneous water phantom and evaluating the motion-affected dose in 2D plane measurements,” says Lee. “We recognize that the interplay effect on PBS delivery with irregular target geometry, under realistic patient-specific breathing motion and with the high heterogeneity of a real patient body may be much more complicated to quantify.”

Next, the team plans to investigate interplay effects on several real patient cases using anthropomorphic phantom studies such as breast, lung and liver that require motion management techniques such as respiratory gating and breath hold.

Backpack computers for small animals, decade of LHC physics in numbers, post-manuscript-submission press conference

Looking out of my window at the garden during this lockdown, I am a bit envious of the birds that are free to come and go as they please. But what if I wanted to know what the fat wood-pigeon gets up to when it is not feasting on my newly seeded lawn.

Simon Ripperger and colleagues at the Ohio State University have created a tiny wireless backpack computer  that can be used to track animals in the wild (see figure). The device was created to study the social habits of the vampire bat, but I’m guessing that it would also work on a pigeon.

Has it really been 10 years since the Large Hadron Collider (LHC) at CERN started taking data? To celebrate a decade of achievement, Sarah Charley has charted progress at CERN in numbers.

Did you know that since 2010, exactly 2947 summer students have worked at CERN? They probably played a role in drinking the 10 million cups of coffee served at CERN restaurants in the past decade and hopefully had a hand in producing 2725 scientific papers.

Collisions at the LHC produced about eight million Higgs particles, at least according to the Standard Model, and physicists had to sift through 278 petabytes of data to find a few Higgs to study.

Another figure that Charley came up with is the total mass of all the protons that have whizzed around the LHC since 2010. Any guesses?

You can find the answer in “10 years of LHC physics, in numbers”, which appears in Symmetry.

A few weeks ago, I shared a video by the Irish medical researcher Ciaran Fairman that imagined a post-game analysis of a talk at a scientific conference. Now, Fairman is back in the above video with a similar take on the submission of a scientific paper for peer review. I like his comments on a certain referee, “you’re going to have to reference their work, there’s really no point in arguing with them”.

Online Demo: 10 years of PeakForce Tapping – Imaging in Liquid

View on demand

In this online demonstration you can learn about the theoretical and practical PeakForce technology for imaging in liquid. This webinar will introduce PeakForce Tapping technology with Scan Asyst mode for liquid measurement. A short introduction will describe the PeakForce principle and what probes can be used. Live measurement samples will be studied and relevant parameters will be explained.

Who should attend:
– Everyone who has interest in AFM
– PeakForce Tapping users who want to extend their knowledge

Presenters:


Dr Samuel Lesko
Senior Application Development Manager


Dr Udo Volz
Application Scientist

Quantum computing meets particle physics for LHC data analysis

An international collaboration is exploring how quantum computing could be used to analyse the vast amount of data produced by experiments on the Large Hadron Collider (LHC) at CERN. The researchers have shown that a “quantum support vector machine” can help physicists make sense out of the huge amounts of information generated at CERN.

Experiments on the LHC can produce a staggering one petabyte per second of data from about one billion particle collisions per second. Many of these data must be discarded because the experiments are only able to focus on a subset of collision events. Nevertheless, CERN’s data analysis now relies on close to one million CPU cores working in 170 computer centres around the globe.

The LHC is currently undergoing an upgrade that will boost the collision rate. The computing power necessary to process and analyse the additional data is expected to increase by a factor of 50–100 by 2027. While improvements in current technologies will address a small part of this gap, researchers at CERN will have to find new and smarter ways to address the computing challenge – which is where quantum computing comes in.

Quantum collaboration

In 2001, the lab set up a public–private partnership called CERN openlab to accelerate the development of new computing technologies needed by CERN’s research community. One of the several leading technology companies involved in this collaboration is IBM, which is also a major player in the field of quantum computing research and development.

Quantum computers could, in principle, solve certain problems in much shorter times than conventional computers. While significant technological challenges must be overcome to create practical quantum computers, IBM and a handful of other companies have built commercial quantum computers that can already do calculations.

Federico Carminati, a computer physicist at CERN and CERN openlab’s chief innovation officer, explains the lab’s interest in a quantum solution: “We are looking into quantum computing, as it might provide a possible solution to our computing power problem.” He told Physics World that CERN openlab is not looking to try to implement a powerful quantum computer tomorrow, but rather to play “the medium–long game” to see what is possible. “We can try to simulate nuclear physics, the scattering of the nuclei, maybe even simulate quarks and the fundamental interactions,” he explains.

CERN openlab and IBM started working together on quantum computing in 2018. Now, physicists at the University of Wisconsin led by Sau Lan Wu, CERN, IBM Research in Zurich and Fermilab near Chicago, are looking at how quantum machine learning could be used to identify Higgs boson events in LHC collision data.

Promising results

Using IBM’s quantum computer and quantum computer simulators, the team set out to apply the quantum support vector machine method to this task. This is a quantum version of a supervised machine learning system that is used to classify data.

“We analysed simulated data of Higgs experiments with the aim of identifying the most suited quantum machine learning algorithm for the selection of events of interest, which can be further analysed using conventional, classical, algorithms,” explains Panagiotis Barkoutsos of IBM Research.

The preliminary results of the experiment were very promising. Five quantum bits (qubits) on an IBM quantum computer and quantum simulators were applied to the data. “With our quantum support vector machine, we analysed a small training sample with more than 40 features and five training variables. The results come very close to – and sometimes even better than – the ones obtained using the best known equivalent classical classifiers and were obtained efficiently and in short time,” says Barkoutsos.

Seeking out new physics

Discovering the Higgs boson in the LHC data is often compared to “finding a needle in a haystack”, given its very weak signal. Indeed, most of the vast amount of computing time used by LHC physicists so far went to the Higgs boson analysis.

An important goal of the LHC is to test the Standard Model of particle physics to the breaking point in a search for new physics – and quantum computing could play an important role. “This is exactly something we are aiming for, the very fine analysis of complex data that would produce anomalies, helping us to improve the Standard Model or to go beyond it,” concludes Carminati.

The team has not yet published its results, but a manuscript is being finalized. Work is also underway using a greater number of qubits, more training variables and larger sample sizes.

Chemical characterization of heterogenous polymeric materials on the nanoscale using photothermal AFM-IR

View on demand

View this webinar to learn how Photothermal AFM-IR can provide new insights into your polymer research. This webinar will cover numerous applications in the field of polymer characterization both in academia and industry. In order to illustrate the broad applicability, we will discuss selected examples in detail, ranging from phase separation in polymer blends/block copolymers, reverse engineering in multilayer films, fibres and thin-film characterization. Photothermal AFM-IR can provide nanoscale chemical information with highly resolved IR spectra, that directly correlate to FT-IR transmission spectroscopy.

Presenters:


Dr Miriam Unger
NanoIR Application Scientist


Dr Hartmut Stadler
Application Scientis

Nanoindentation of Metallic Samples

View on demand

Nanoindentation of metallic samples is closely related to hardness testing methods such as Vickers. The Vickers hardness test requires an imaging method to determine the size of the indentation cup. This implies that the Vickers hardness test is limited to larger indentation cups. Nanoindenation not only eliminates this shortfall by determining the size of the indentation cup from measurements of load and displacement, it also is much easier to automate the nanoindentation testing and the analysis of mechanical data.

This session contains an introduction into hardness testing, the indentation analysis following Oliver and Pharr (1992) and demonstrates the benefits of hardness testing at nanoscale for metallic samples.

Presenters:


Dr Ude Dirk Hangen
Nanomechanical Application Manager


Dr Rhys Jones.
Nanoindentation Product Sales Specialist

Remembering Philip Anderson, meeting an extragalactic astronomer who advises the government

In this episode of the Physics World Weekly podcast we look back on the life of the prodigious condensed-matter physicist Philip Anderson, who died age 96 on 29 March.

We also have an exclusive interview with Professor of Extragalactic Astronomy at the University of Bath, Carole Mundell, who talks about her research on gamma-ray bursts. Mundell is also Chief Scientific Advisor to the UK’s Foreign and Commonwealth Office and explains how she translates science into scientific advice on issues of national importance.

We round off the programme by laughing along with a few physicists who have admitted to doing some pretty stupid things.

Critical research hit as COVID-19 forces physics labs to close

The physical sciences have not evaded the disturbance of daily life as a result of COVID-19 – the disease caused by the SARS-CoV-2 virus that is sweeping the globe. Government laboratories have either shut down or required employees to work from home while closing to visitors. The schedules of forthcoming space missions have been put at risk. Administrators of major telescopes have restricted or postponed critical observations. And individual postgraduates and junior scientists have seen their career paths put on hold as universities shut their doors.

In the US, national laboratories overseen by the Department of Energy (DOE) have suffered significant disruption. That occurred initially as a result of geography, with the virus having made its first deadly impact in the state of Washington. Most staff at the DOE’s Pacific Northwest National Laboratory in Richland, for example, have been working at home since early March. California’s Bay Area also emerged as an early hotspot.

A directive from California Governor Gavin Newsome that prohibited inessential travel and meetings led the SLAC, Berkeley, Lawrence Livermore National Laboratories, and the local branch of Sandia National Laboratory effectively to shut down, with most of their employees now working remotely at home too. There are exceptions, however. The Berkeley Lab is currently in a “safe and stable standby” status, with only critical work occurring on-site and most staff working remotely. This week, the lab’s Advanced Light Source began operating a limited number of beamlines for three days a week for users that are developing therapeutics to help combat the SARS-CoV-2 virus.

Other DOE labs have either restricted visitors, operated largely off-site or closed down as the virus created fresh hotspots. New York and New Jersey soon followed Washington state in exposure. The Princeton Plasma Physics Laboratory shut down on 13 March,  requiring all its employees to work at home. A week later, Brookhaven National Laboratory responded to New York Governor Andrew Cuomo’s order that employees in “non-essential” jobs should stay at home. A subsequent order by Illinois Governor J B Pritzker also forced the Argonne and Fermilab facilities to restrict their operations. Meanwhile, the Oak Ridge National Laboratory in Tennessee and the Idaho National Laboratory have closed to visitors, researchers and the general public alike.

‘Heroes’ work’

NASA has been similarly affected, with greater impact on specific missions. On 19 March NASA administrator Jim Bridenstine announced plans to put all the agency’s centres under “stage 3 status”, which requires all but “mission essential” staff to work remotely. “We are going to take care of our people,” Bridenstine said. “That’s our first priority.”

An immediate result of NASA’s announcement was the temporary closures of the Michoud Assembly Facility in New Orleans and the nearby Stennis Space Center in Mississippi when the number of COVID-19 cases rose in the area. A result of the closures, Bridenstine noted, would be “temporarily suspension of production of the Space Launch System and Orion Hardware” – key components of the agency’s plan to land astronauts on the Moon in 2024. Analysts had already questioned the viability of that schedule under normal conditions, but it now seems even more doubtful.

A more immediate mission – Mars 2020 – remains on schedule. The $2.5bn project, which includes the newly named Perseverance rover, has a 20-day launch window that starts on 17 July. Failure to meet that window would delay the flight by two years. The mission has “the very highest priority”, Lori Glazer, head of NASA’s planetary science division, told a virtual meeting. “We’re going to ensure that we meet that launch window in July.” The project’s engineers are doing “heroes’ work” in maintaining that schedule, said NASA’s science head Thomas Zurbuchen.

The schedule of another prestige project, the James Webb Space Telescope (JWST), is less certain. California’s state-wide lockdown has applied to Northrop Grumman Aerospace Systems in Redondo Beach, which had been carrying out shaking tests on the $8.8bn observatory. A successor of the Hubble Space Telescope, JWST has already suffered numerous delays and is unlikely to meet its current launch date of March 2021.

Several observatories belonging to the Event Horizon Telescope have also closed down owing to the coronavirus, with the organization having cancelled its observing campaign planned to take place from late March into April. “We will have to wait for March 2021 to try again,” the organization said in a statement. Elsewhere in the world of astronomy, the Atacama Large Millimetre/submillimetre Array in Chile has suspended operations, as has the Association of Universities for Research in Astronomy, which has stopped  observations at several of the telescopes it oversees and halted construction of the Vera C Rubin Observatory in Chile.

Meanwhile, the Laser Interferometer and Gravitational-wave Observatory sites in Hanford, Washington and Livingston, Louisiana, suspended observations on 27 March as did the Virgo detector in Italy. However, operations at the Kamioka Gravitational Wave Detector in northern Japan are still ongoing.

Moving online

The need for social distancing has impacted events organised by scientific societies too. The American Physical Society, which called off its March meeting at short notice, has cancelled its April meeting, but is planning some remote sessions. And the American Astronomical Society has converted its early June meeting to a fully virtual event.

Academic institutions face their own coronavirus issues. Many research universities have moved to virtual operation. Those decisions have put particular pressure on postgraduate students who need to be on-site to perform their research. Some institutions, such as Brown University and the University of Alabama at Birmingham, have frozen hiring. In late March, a group of four organizations representing universities and medical colleges called on Congress to increase spending on research by government agencies.

The $2 trillion rescue package that President Donald Trump signed on 27 March includes some relief. It grants $100m to DOE labs, $75m for National Science Foundation grants, $66m for programmes of the National Institute of Standards and Technology as well as a fund worth $14bn for universities. Observers suggest that those amounts, while welcome, are too small. But the likelihood that Congress will pass another rescue package gives the scientific community some hope of extra support.

European impact

The impact of COVID-19 is, of course, not just impacting US labs. Most labs in Europe have also closed their doors too. The CERN particle-physics lab near Geneva has now reduced all activities on-site to those that are essential for the safety and security of the lab. CERN was moving to the latter parts of a long shutdown in preparation for a major upgrade to the lab’s Large Hadron Collider. Those activities have now been reduced, with officials at CERN working out how the impact will affect the timeline of the upgrade project, which was due to be complete in the mid 2020s. The CERN Council also announced in late March that it has postponed the release of the European strategy update that was due to be released in May.

Yet, a few major projects are still continuing to some degree. Mission controllers at the European Space Agency’s European Space Operations Centre in Darmstadt, Germany, are planning to test instruments on the agency’s Bepicolombo mission to Mercury as it completes a fly-by of Earth on 10 April – albeit with limited personnel. The ITER fusion experiment being built in Cadarache has cancelled all on-site visitors and onsite meetings, but is continuing with “critical responsibilities and functions”. Indeed, the project is still managing to undertake some construction tasks and has taken delivering of magnet components that have arrived from member states. Yet it looks likely that the SARS-CoV-2 virus will put back the start of operations that are currently planned for 2025.

The European Spallation Source, currently under construction in Lund, Sweden, has also put in place measures for staff to work remotely as well as cancelling visits to the site. Yet work is still continuing, with workers having recently installed the water tanks that are used for the proton target. Other neutron and X-ray synchrotrons facilities in Europe have closed such as the Institut Laue–Langevin and the European Synchrotron Radiation Facility, both in Grenoble, France, as well as the ISIS neutron source in Oxfordshire, UK.

Yet some facilities remain open for scientists to carry out research on the SARS-CoV-19 virus. These include the Paul Scherrer Institute in Switzerland, the UK’s Diamond Light Source and the MAX IV synchrotron in Sweden, which are all fast-tracking relevant proposals.

Titanic stellar explosion scrambles magnetic fields

An unusually energetic gamma-ray burst (GRB) has prompted astrophysicists to rethink the role of magnetic fields in these enormous stellar explosions. Observations made in the burst’s immediate aftermath show that key features of its associated magnetic field mysteriously vanished – a phenomenon that cannot be explained by current theories of how such fields form and evolve.

On 14 January 2019, NASA’s early-warning Swift satellite spotted a flash of gamma rays from an exploding massive star in a galaxy 4.5 billion light years away. Such flashes occur when a star’s iron core collapses into a stellar-mass black hole, producing two relativistic beams of strongly-magnetized particles. These beams generate gamma rays through synchrotron radiation, and as they shoot outwards from the collapsing core, the particles in them collide with circumstellar material shed by the star in the run-up to its explosion. The resulting shock creates an optical afterglow that can linger for months.

As soon as Swift detected the burst, which was designated as GRB 190114C, it automatically alerted a host of telescopes on the ground. Within 32 seconds, the MASTER telescopes in the Canary Islands and South Africa were in position and recording the burst’s afterglow.

This fast response has become standard within GRB astronomy, but the data proved anything but. Based on previous observations, astrophysicists expected the afterglow light to be polarized — perhaps by as much as 30 per cent, although the exact figure depends on the strength and structure of the GRB’s magnetic field. The polarimeters on the MASTER telescopes, however, initially measured a polarization of only 7.7 percent. A minute later, when the Liverpool Telescope in the Canary Islands began taking data on the burst, the polarization had dropped to just two percent, and it remained at this marginal level for the remainder of the observations.

That wasn’t the only odd feature about GRB 190114C. When another facility in the Canary Islands, the MAGIC telescopes, began taking data on the afterglow, it measured incredibly energetic emissions – in the tera-electron-volt (TeV) range – from inverse Compton scattering, which occurs when photons collide with electrons in the circumstellar material. This is the first time such emissions have been detected at such high energies in a GRB.

Shock physics

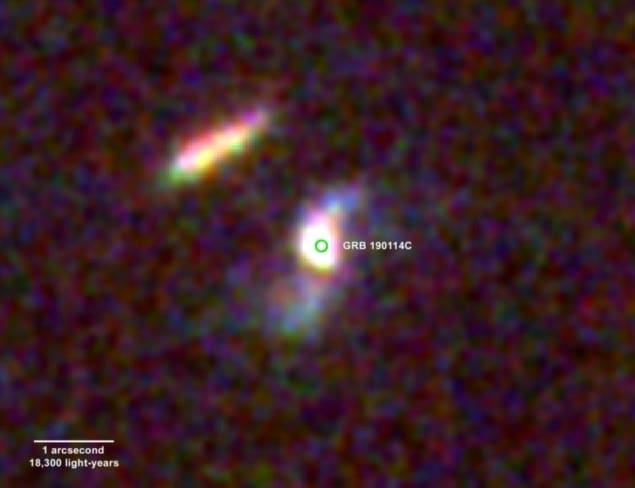
Image showing two galaxies as bright, pixellated streaks against a black background

In a paper published today in The Astrophysical Journal, researchers led by Nuria Jordana of the University of Bath, UK, propose a partial solution to the mystery surrounding GRB 190114C. “We speculate that the low polarization is caused by the catastrophic dissipation of magnetic energy, which destroys the order of the magnetic fields and powers the afterglow,” Jordana tells Physics World.

The picture she and her colleagues paint is one of shockwaves bouncing around the circumstellar material. At some point in the 31 seconds before observations began, the blast wave from the stellar explosion struck this material. Pure kinetic energy allowed the jet and much of the forward shock to pummel through, but part of the wave was reflected, forming a so-called reverse shock.

Since localized disturbances scramble the forward shock’s magnetic field in random orientations, the forward shock is never polarized. The reverse shock, however, should still carry the magnetic field ejected by the newly-formed black hole.

In the case of GRB 190114C, something seems to have caused that magnetic field to catastrophically dissipate and dump its energy into the emission from the afterglow – which would explain the unusually high TeV energies. Jordana and colleagues infer that the weak polarization measured between 52 seconds and 109 seconds after the burst was the remnant of the large-scale magnetic field ejected from the black hole.

Looking for causes

The exact cause of the magnetic field collapse remains uncertain. According to Jordana, although the findings hint at a “universal role” for magnetic fields in GRBs, “the survival of the jet’s magnetic field must depend on additional, as yet unknown, physical factors”. She also points out that the polarization of the early optical afterglow has so far been measured in only a handful of GRBs. A larger sample will, she says, be needed to better understand the mechanisms that drive it.

Andrew Levan, an astrophysicist at Radboud University in the Netherlands who co-authored an earlier paper describing the TeV emission, says that the apparent lack of polarization is “a little surprising”, especially given what he describes as the “very early and sensitive observations” of the GRB’s afterglow. Levan’s group found that GRB 190114C occurred in the central region of a galaxy that is interacting with another galaxy – an unusual location, since GRBs tend to be caused by the destruction of massive stars with low abundances of heavy elements, and these are usually only found in less chemically-evolved galaxies. Levan says it’s “plausible” that GRB 190114C’s environment and unusual characteristics could somehow be linked. However, he adds, “it’s a very difficult problem to explain exactly how the field may have collapsed in this case”.

Copyright © 2025 by IOP Publishing Ltd and individual contributors