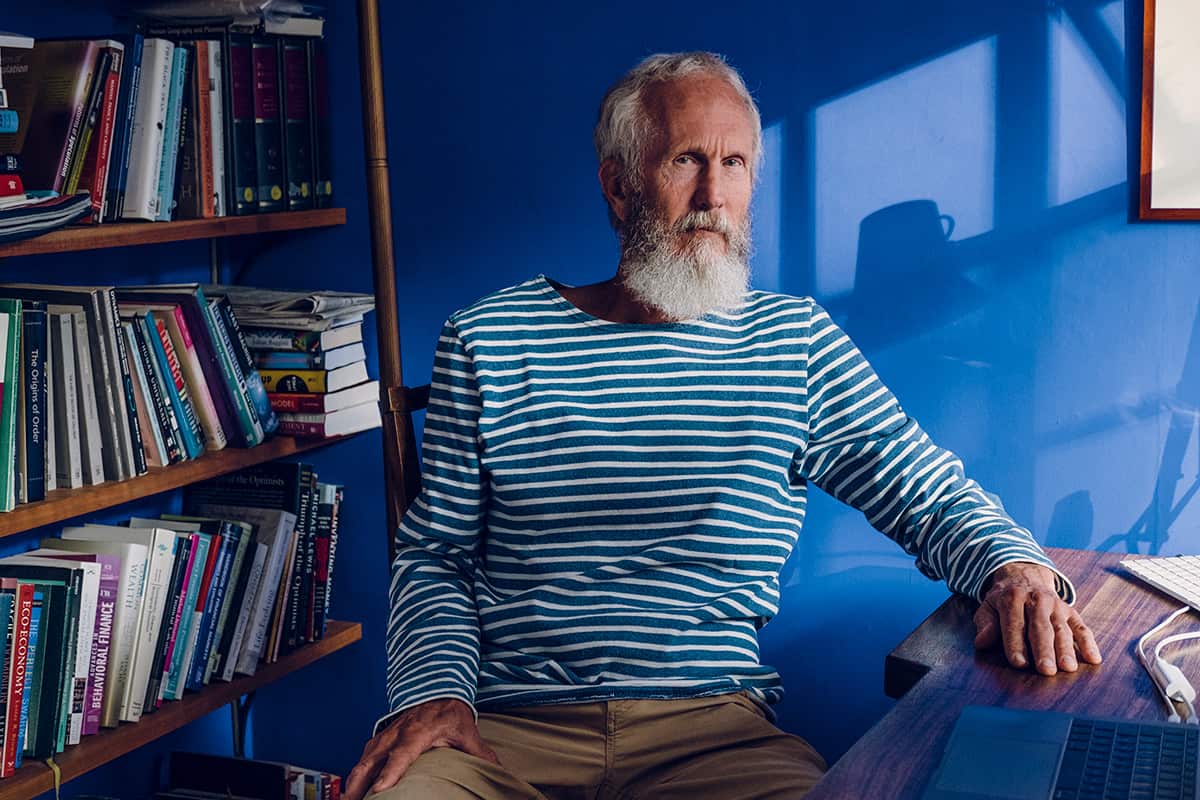
Forecasting the impact Based at the University of Oxford, J Doyne Farmer is concerned that the COVID-19 pandemic is increasing economic disparity between rich and poor. (Courtesy: Carlotta Cardana)
As an American living in the UK, how do you think the US has handled the economic response to the pandemic?
I can’t help but wonder what drugs US stock market investors are taking. Stock prices have been ridiculously high since Donald Trump was elected and now we are seeing the consequences of that coming to roost with his complete mismanagement of the pandemic. I think the long-range economic situation is worse than the stock market seems to think it is. There has been no co-ordination in the management of the pandemic at a national level and it remains unclear when things will stabilize. The US has not frozen the economy by keeping workers in place, as most European countries have done.
What are the consequences of this?
There is a dangerous “Keynesian” feedback loop running. If people become unemployed then they don’t spend. If they don’t spend, products don’t sell and more people become unemployed. To prevent this from happening again the US government needs to take firm action. While there have been large stimulus packages, I don’t think they are large enough and they have been implemented in a very inefficient way.
You recently presented a new model of the economic impact of the current COVID-19 crisis. Were there any unexpected results?
We worked together with IHS Markit – a leading data provider – to build a model that could predict the impact of the crisis on different industries. We saw some surprising network effects. For example, we discovered that opening more industries can actually make things worse if the wrong industries are opened (arXiv:2005.10585). This problem happens because during the lockdown period many industries were not able to produce at full capacity. If the demand for the products of an industry is more than it can supply, it becomes necessary to ration its output
How might this happen?
Suppose industry A produces a critical input for industry B, and industry B produces critical inputs for other industries as well. Then if industry C is opened, and industry C uses the product of industry A as well, industry A may now supply even less of its product to industry B. And if industry B supplies products to many different industries, this can reduce the output of the whole economy. So in any partial reopening of the economy, it’s important to open the right industries. Our model allowed us to investigate questions like this and make detailed recommendations. We are now waiting for government reports and other data that will allow us to test our results and find out how we did.
What can be done to minimize risks of reopening certain parts of the economy that harbour more epidemiological risk?
Let me begin by saying that we aren’t epidemiologists. We were able to use detailed data about the tasks performed by occupations and we knew which occupations are employed in each industry. Combining this with epidemiological studies allowed us to estimate how much the infection rate was likely to go up by opening a given industry. Broadly speaking, we predicted that the increase in the infection rate from industries that supply other industries is substantially smaller than it is for consumer-facing industries. Our recommendation was to open business-to-business industries, but restrict consumer-facing industries. This was roughly in line with what the government did in the beginning.
My hope is that the pandemic makes inequality so intolerable that people will rise up, take action and implement some lasting changes.
But you are not supportive of the UK government reopening higher-risk consumer-facing industries such as pubs as it did last month?
I’m fairly sceptical. The UK has not got the epidemic under control in the same way that most European countries have. It will make a huge difference if we really have an aggressive track-and-trace system with free and widely available testing. But so far we don’t have that.
Do schools present a similar risk as reopening consumer-facing industries?
The effect of opening schools is difficult to predict and it depends on how it is done. Many schools are coming up with creative ways to partially reopen, like organizing students into bubbles or having the students quarantine at regular intervals. Of course, because so many people depend on schools for childcare, this cannot be separated from reopening the economy.
Do you think this crisis is going to increase the disparity between the rich and the poor?
In the short term, the pandemic is definitely making inequality even worse than it already is. We saw this in our first paper, where we predicted who could work from home and who couldn’t, and who is in essential and non-essential industries. The conclusion is that the poor are bearing the brunt of the pandemic because they can’t work from home and they’re less likely to work in essential industries. So in the short term the pandemic is clearly making things worse.
And in the long term?
It’s putting pressure on the system, it’s making people more aware and it may be a catalyst for change. There are a lot of changes we can make to fix the problem. We need to tax the rich more, we need to give workers more power to organize and we need a higher minimum wage. My hope is that the pandemic makes inequality so intolerable that people will rise up, take action and implement some lasting changes.
In 1963, a Tanzanian schoolboy called Erasto Mpemba was making ice cream when he noticed something strange: hot water sometimes freezes faster than cold water. Though Mpemba was not the first to wonder about this phenomenon, his report nevertheless captured the scientific imagination. The so-called “Mpemba effect” has remained contentious ever since – not least because the complex matrix of interactions at work when freezing a cup of hot water, coupled with water’s many anomalies, make it difficult to reproduce.
Researchers at Simon Fraser University in Canada have now overcome this problem with a simplified experimental model of a hot system relaxing to equilibrium with a colder heat bath. According to team leader John Bechhoefer, the technique he developed with PhD student Avinash Kumar enabled them to replicate the Mpemba effect in a reliable way, making it possible to pin down the precise conditions it requires.
A simplified model system
The definition of the Mpemba effect has been hotly debated. Is it concerned with the time it takes for water in a container to start to freeze, completely freeze (both of which are hard to observe accurately in practice) or simply to reach freezing temperatures? To complicate matters further, a similar effect has also been observed in magnetic systems, for other phase transitions. However, these systems, although simpler than water, are still too complex to pin down precise parameters for the effect.
Bechhoefer and Kumar’s experiments start with a beaker of water, but they don’t change the water’s temperature in real terms. Instead, they release a tiny glass bead in the beaker thousands of times from different positions across the width of a sample that defines the effective container size for their experiment. The locations where they release the bead are determined according to a probability distribution defined by thermodynamics and Boltzmann statistics for the system’s chosen initial “temperature”.
As the bead falls it is bombarded by water molecules, resulting in Brownian motion, but the researchers also subject it to a “virtual potential profile” using a feedback optical tweezer system. This changes the probability distribution of the bead’s position – effectively creating a change in the system’s “temperature”. This virtual potential profile has two dips in it, in line with the double potential well of water’s free energy landscape: one dip where water can “supercool” to liquid water at subzero temperatures, and a lower dip where water freezes. By measuring the probability distribution of the released beads’ positions after a set time, and establishing how much that distribution differs from an equilibrium probability distribution, the researchers gain information about how quickly the system is equilibrating – an analogue to how quickly a cup of water would approach freezing temperatures.
While all this may sound more complicated than popping a cup of water in an ice box, Bechoefer says it actually makes it a lot simpler to determine what conditions are required to produce the Mpemba effect. The idea arose out of a visit to the University of Maryland, where Zhiyue Lu and Oren Raz were then working on a theoretical framework for a simplified model of the Mpemba effect. During the visit, Lu and Raz button-holed Bechhoefer and persuaded him that his specialist feedback optical tweezer system – which allows finer, non-diffraction-limited control over the virtual potential landscape than regular optical tweezers – would make a great way of testing their model. Thanks to this system, Bechhoefer and Kumar could work with a sample that had an effective width of just 0.4 µm, making experimental runs much faster.
Reliably reproducing the Mpemba effect
Bechhoefer acknowledges that his team’s system is an “abstract” and “almost geometrical” way of picturing the Mpemba effect. Nevertheless, he and Kumar were able to identify parameters for which hotter “initial temperatures” cooled faster than chillier ones. “It sort of suggested that all the peculiarities of water and ice – all the things that made the original effect so hard to study – might be in a way peripheral,” he says.
Although the double potential well played a crucial role in producing the effect, Bechhoefer and Kumar found this alone was not enough to trigger it. The system also needed the barrier between the two potential wells to be offset from the midpoint between them. When the distance to the deeper well is greater than the distance to the shallower well, the researchers found that the number of starting positions for which the bead will fall directly into the deeper well (rather than entering the shallower well first and then jiggling around until Brownian motion eventually nudges it into the deeper one) is greater.
While the Mpemba effect is not typical behaviour, Bechhoefer and Kumar’s study suggests that it is not limited to specialized conditions that would make it impossible to reproduce in a reliable way. “What this shows is that there are systems where you can reproducibly not just observe, but in some sense create, engineer and control the effect,” Bechhoefer says.
Controlling the Mpemba effect could have important practical implications too, for example in the heat removal systems that keep electronics cool. Lu and Raz’s theoretical treatment also suggests that there should be a “reverse Mpemba effect” for heating systems, and Bechhoefer and Kumar have their sights set on replicating this in future experiments.
“This work extends the Mpemba phenomenon,” says Changqing Sun, whose research at Singapore’s Nanyang Technological University focuses on properties of water that relate to the Mpemba effect. However, while Sun asserts that the work “certainly contributes to the knowledge for general situations of heat removal” he thinks further caution may be needed when applying it to water. In water, he adds, “the microscopic mechanism may differ, such as the higher thermal diffusivity and lower specific heat of water surface and the manner of hydrogen bond (O:H-O) energy exchange.”
Innovations in batteries take years to formulate and commercialize, requiring extensive experimentation during the design and optimization phases. We approached the design and selection of a battery electrolyte through a black-box optimization algorithm directly integrated into a robotic test stand. We report here the discovery of a novel battery electrolyte by this experiment completely guided by the machine-learning software without human intervention.
Motivated by the recent trend toward super-concentrated aqueous electrolytes for high-performance batteries, we utilize Dragonfly – a Bayesian machine-learning software package – to search mixtures of commonly used lithium and sodium salts for super-concentrated aqueous electrolytes with wide electrochemical stability windows.
This webinar presented by Venkat Viswanathan, will help the audience to:
Learn about the importance of robotic experimentation
Learn about machine-learning guided design of experiments
Learn about the frontier of remote experimentation
Venkat Viswanathan is an Associate Professor of Mechanical Engineering at Carnegie Mellon University. He received his PhD from Stanford University working on lithium-air batteries. His current research focus is on understanding and developing novel electrochemical devices for energy storage and utilization.
A model that predicts when and where large solar flares will occur has been developed by a team led by Kanya Kusano at Japan’s Nagoya University. Their technique works by monitoring regions of high magnetic activity on the Sun’s surface and focusses on the instabilities triggered by reconnecting magnetic fields. Called the “κ-scheme”, their model could soon be part of an early warning system for incoming solar storms.
Solar flares are bright flashes on the Sun’s surface and are among the most dramatic and fascinating events in the solar system. Although the conditions that trigger them are still unknown, flares are often associated with the “active regions” close to visible sunspots. These regions contain strong magnetic fields that store vast amounts of energy. When the topologies of these fields change suddenly, this energy is violently released; often resulting in powerful bursts of X-rays, plasma, and energetic particles.
Known as coronal mass ejections, these bursts can trigger powerful solar storms if they interact with Earth’s upper atmosphere – risking the safety of astronauts, spacecraft and satellites, as well as electrical grids and radio communications on Earth. It is critical, therefore, that we can predict precisely when and where solar flares will occur. Currently, however, early warning systems are limited in their efficacy because they rely on empirical models that cannot fully capture the complex, multi-scale processes associated with solar flare formation.
Double-arc loop
Kusano’s team has taken a new approach based around the process of “double-arc instability”. In their κ-scheme model, two surface regions with opposite magnetic flux are connected by two current-carrying loops of magnetic field lines. Due to shearing, these loops become crossed and reconnect with each other, forming a single, double-arc loop. This field line then moves upwards as the instability grows, allowing further, smaller pairs of loops to reconnect underneath it. Over time, this creates a positive feedback loop that ultimately releases vast amounts of energy.
To test κ-scheme, Kusano and colleagues used the model to analyse 205 active regions on the Sun that were monitored by NASA’s Solar Dynamics Observatory between 2006-2019. Overall, seven of these regions were responsible for solar flares powerful enough to trigger long-lasting storms on Earth. By monitoring the location and time evolution of each region, the κ-scheme accurately predicted when most of these flares would occur, up to 24 h in advance.
The model failed in its prediction of just two flares, which came from one specific active region that produced large flares without any accompanying mass ejections. Kusano’s team now hope to improve the κ-scheme’s predictions through upcoming observations from the 4 m Daniel K Inouye Solar Telescope, which first began operation in December 2019. The instrument will measure the Sun’s magnetic field structures and dynamics with unprecedented resolution, potentially allowing the team to produce far better forecasts of when and where flares will occur.
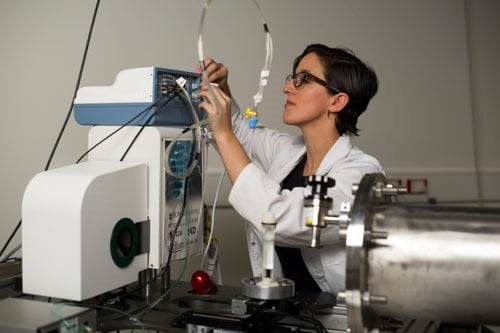
Freda Werdiger in the lab with the X-ray velocimetry system. (Courtesy: Freda Werdiger)
The ability to quantify and localize spatial variations in lung function could help doctors more effectively diagnose, monitor and treat many respiratory diseases. A multidisciplinary team of researchers in Australia has developed a novel tool for measuring regional lung function and used it to detect and characterize a disease in mice similar to cystic fibrosis (CF).
CF is a hereditary disease that causes the body to make abnormally thick and sticky mucus. This mucus can hinder breathing and lead to severe lung infections and permanent damage. CF progressively reduces quality-of-life and ultimately leads to premature death. Lung damage caused by CF is often heterogeneous, or non-uniform, so local treatments targeting patches of damaged tissue can slow the progression of the disease to preserve quality-of-life and lengthen overall survival.
The best method for assessing lung function consists of measuring how much air a patient can inhale and exhale, in addition to how quickly this volume of air is exhaled – a technique called spirometry. This information is then used to identify breathing patterns commonly associated with respiratory conditions, like CF. Critically, spirometry only assesses the global health of the entire lung and cannot localize subtle, non-uniform deficiencies.
XV is a combination of high-speed imaging and post-processing analysis that produces a detailed ventilation map of the lungs.
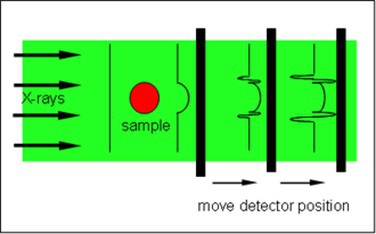
To achieve high-speed image acquisition, Werdiger and her team utilized propagation-based phase-contrast X-ray imaging (PCXI). Unlike conventional radiography, which relies solely on X-ray absorption, PCXI additionally leverages the diffraction of X-rays at material interfaces.
The interference pattern that enables edge enhancement in propagation-based phase-contrast X-ray imaging. (Courtesy: CC BY-SA 3.0/Mcm222)
By placing the detector further from the sample than is typical for radiography, diffracted X-rays can interfere with the un-diffracted X-rays. This produces an interference pattern that highlights structural boundaries. This results in enhanced image contrast and enables high-resolution images to be acquired in a brief time.
When combined with tomography methods, PCXI can rapidly generate detailed, three-dimensional images of fine lung structures.
The post-processing analysis for XV involved the multiple tomographic PCXI images acquired throughout the breathing cycle. The researchers used a computational method known as particle image velocimetry to calculate displacement vectors between consecutive images and determine the three-dimensional speed and direction of lung motion throughout the breathing cycle. This provided an entirely non-invasive way to calculate the volume of air that flows through the individual airways of the lungs.
Characterization of CF-like disease in mice
The researchers tested the feasibility of using XV to acquire reliable and quantitative measures of respiratory function in a cohort of mice with CF-like lung disease and their healthy littermates. Their results were recently published in Scientific Reports.
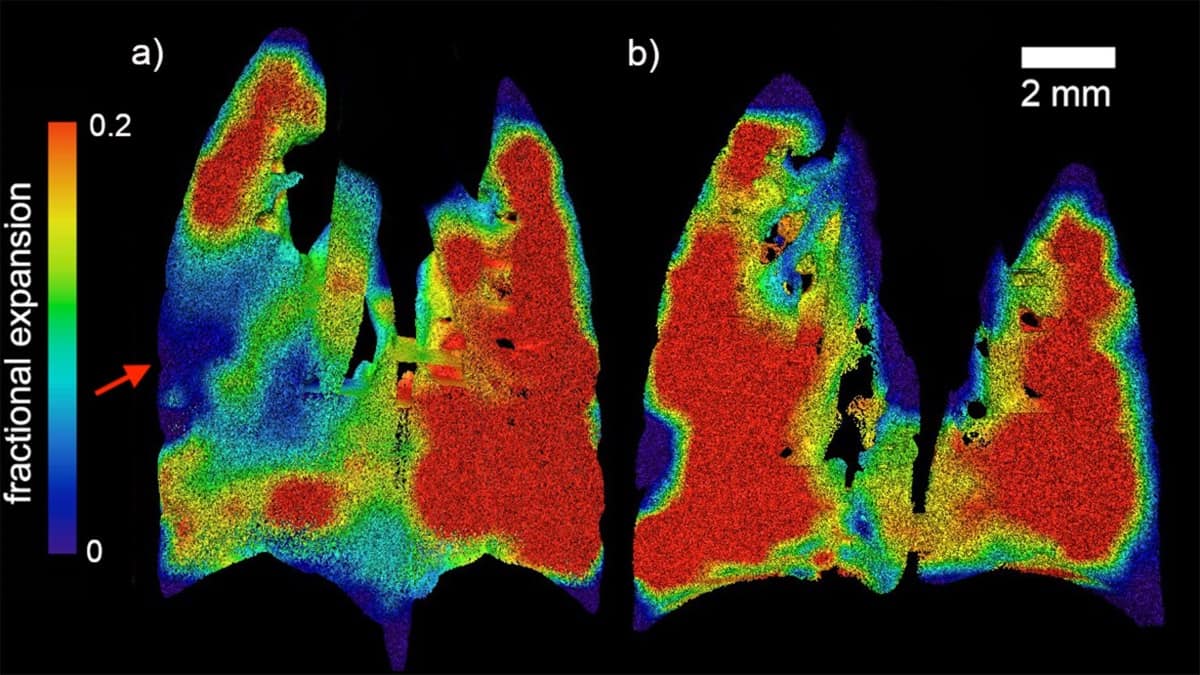
First, they generated maps of regional lung expansion for both healthy and diseased mice. These maps clearly showed the presence and location of confined areas of airflow deficits in the diseased animals, a characteristic of the patchy nature of CF.
Map of the fractional regional lung expansion at peak inspiration relative to the lung volume at base exhale. Coronal slices for (a) a mouse with CF-like disease and (b) a healthy littermate. The red arrow indicates a region of airflow deficit. (Courtesy: Monash University)
Next, the researchers developed a method to quantify the distribution of disease in individual mice. Their novel quantification correlated well with measurements by the conventional forced oscillation technique, while offering a higher level of specificity.
“This study shows how researchers from many different backgrounds can come together in collaboration and work together to improve the lives of people living with this terrible disease,” says Werdiger. “I hope to see XV being used to diagnose and monitor many different diseases,” she added, a wish that is likely to be realised. With its recent commercialization by Andreas Fouras of 4DMedical, this technology is well positioned to assist in global research and clinical care that could improve the length and quality-of-lives of people with CF and other respiratory diseases.
How do materials that are normally insulators manage to conduct electricity without resistance? Physicists have been debating this basic question about cuprates – ceramic compounds made up of layers of copper and oxygen atoms, interleaved with atoms of other elements – for more than three decades and have yet to come up with a satisfactory answer. Now, however, researchers in the US have put forward a model that at least provides clues as to what such an answer might look like, based on studies of so-called “overdoped” cuprates.
In 1986, Georg Bednorz and Alex Müller discovered that, by tweaking cuprates’ chemical composition, they could make these normally-insulating materials superconduct. What is more, the superconducting transition temperature of the doped cuprates far exceeded those of previously-recognized metallic superconductors – meaning that the established Bardeen–Cooper–Schrieffer (BCS) theory of low-temperature superconductors must be incomplete.
This finding led to much excitement, and subsequent studies succeeded in pushing the cuprates’ superconducting transition temperature up to around 150K. More recently, other materials – hydrides subject to very high pressure – have been found to superconduct at even higher temperatures. Yet the dream of room-temperature superconductivity remains elusive, and – frustratingly – physicists still haven’t agreed on a theory to explain the source of cuprates’ superconductivity.
Jumping electrons
Multiple studies have shown that cuprates superconduct when their electrons jump from one copper atom to another. Because electrons strongly repel each other, however, they usually exist in a static formation, with one electron sitting immobile on each atom. Undoped, therefore, cuprates remain in an insulating, antiferromagnetic state known as a Mott insulator, with neighbouring electrons having opposite magnetic spins.
When a cuprate is doped with atoms of other elements such as lanthanum, strontium or yttrium, some of its electrons are replaced with holes, freeing the remaining electrons to flow without resistance. Too much doping, though, and the effect reverses: beyond a specific concentration of dopant atoms, the cuprate’s transition temperature drops until it eventually becomes a metal. The latest research focuses on these “overdoped” cuprates, putting forward a model that aims to reconcile some apparently contradictory experimental results.
Contradictory behaviour
According to BCS theory, metals become superconducting when electrons partially overcome their mutual repulsion by creating what are known as Cooper pairs. These pairs form thanks to vibrations in the metallic crystal lattice: when one electron draws slower-moving ions towards it as it passes through the lattice, it generates a small concentration of positive charge that then pulls another electron in behind it.
Since electrons are fermions, they obey the Pauli exclusion principle, forming a Fermi gas in which the system’s energy levels fill from the bottom up with one electron per lattice site and spin. The boundary between the highest occupied energy level and the next is known as the Fermi surface, and the electrons that form Cooper pairs are those nearest this surface.
In a metallic superconductor, all electrons contribute to superconductivity, not just those bound up as Cooper pairs. In practice, this means that the density of superconducting electrons should be similar to the overall electron density. However, in 2016 Ivan Božović and colleagues at the Brookhaven National Laboratory in the US showed that this is not the case for overdoped cuprates. Instead, after devising a new way of preparing overdoped copper oxides (which are chemically unstable), they found that the density of superconducting electrons in these materials is actually far lower than would be expected from BCS theory.
Explaining the disparity
The new model seeks to explain this disparity. In doing so, it takes inspiration from work carried out by Japanese physicists Yasuhiro Hatsugai and Mahito Kohmoto. In the early 1990s, Hatsugai and Kohmoto proposed a way of overcoming the apparent contradiction between the statistics of a Fermi gas (which stipulate one electron per lattice site and spin) and a Mott insulator (which allow just one electron at each site). Their solution was to introduce what is, in effect, a new repulsive interaction that prohibits two electrons with opposite spins from occupying the same momentum state.
Philip Phillips and colleagues at the University of Illinois at Urbana-Champaign have now revised this model by adding a further interaction that draws electrons together to create Cooper pairs. As they report in Nature Physics, this model includes a Fermi surface, but also a much-reduced density of superfluid electrons compared with a normal Fermi gas – bringing it more in line with the observations made by Božović and colleagues at Brookhaven.
Jan Zaanen of the University of Leiden in the Netherlands, who was not involved in the present work, points out that the Urbana-Champaign team’s modelled density falls off more gradually with increased doping than was observed in the Brookhaven experiment. Nevertheless, he believes that the new scheme provides a “proof of principle” for showing how a non-Fermi liquid could have a Fermi surface.
Since both Hatsugai and Kohmoto’s model and the Phillips’ group’s adaptation posit new interactions between electrons, while also describing those electrons as waves rather than particles, Zaanen acknowledges that it is hard to envisage them as real physical descriptions of what is taking place. However, he points out that a similar problem occurs in the well-established theory of Lev Landau that describes helium-3 and other systems in terms of strongly-interacting fermions.
As Zaanen explains, Landau’s scheme relies on emergent physics involving highly collective quasiparticles. A similar logic, he concludes, may be needed to understand overdoped cuprates. “Although nonsense on the microscopic scale,” he says, “the Hatsugai-Kohmoto interactions may spring into existence in the collectivization process to become eventually literal on the macroscopic scale”.
Ryan Newman must have been feeling pretty good as he rounded turn four on the last lap of the Daytona 500 on 16 February this year. The 42-year-old NASCAR driver was not only poised to break a 104-race winless streak, he was about to do it at the season’s most prestigious race.
Then everything changed.
Newman’s car was hit from behind and turned. It slammed into the outside track wall so hard that it flipped over, then slid – upside down – back into traffic, where an oncoming car smashed it into the air. After landing, Newman’s battered #6 car slid a couple of hundred metres on its roof before finally coming to a stop.
No NASCAR driver has died or been permanently injured in any of its top three series since 2001. As Newman was helicoptered off by emergency personnel, I couldn’t help but fear that this streak was about to end. But 42 hours later, Ryan Newman walked out of the hospital. It wasn’t until NASCAR cleared him to race again at the end of April that he revealed he remembers almost nothing about the crash. Three months and one day after his accident, Newman finished 15th in the first race since the coronavirus shut down NASCAR in March.
The risk in racing
The National Association for Stock Car Auto Racing – NASCAR – grew out of the illegal liquor trade in the south-east US. Moonshine runners who had souped up their “stock” cars to outrun the law started racing each other. Today, NASCAR’s top level, the NASCAR Cup Series, runs 36 races each season at ovals and a few road courses. The shortest tracks are about 800 m and the longest 4.1 km, with race lengths ranging from 500 to 965 km. The racecars themselves have gone through six generations of development, each featuring major changes and improvements from its predecessor. However, since its founding in 1947, some 32 NASCAR drivers have died during racing, qualifying, practice and testing in the top three series – 28 in the Cup Series alone.
In the past, NASCAR was mostly reactive when it came to safety, and some of the most vocal opposition to safety innovations came from drivers themselves. That changed after four deaths over a 10-month period in 2000–2001. The string of tragedies started with Adam Petty, the fourth generation of a legendary NASCAR family, and ended with Dale Earnhardt’s death at the 2001 Daytona 500. As NASCAR then started developing its fifth-generation racecar following Earnhardt’s death, the newly created NASCAR R&D Center was charged with making safety a top priority.
Nowadays, Newman – a Purdue University-educated engineer – is one of NASCAR’s most vocal safety advocates, especially when it comes to superspeedways like Daytona. The 4 km tri-oval (a cross between a triangle and an oval) has long straightaways and 31° banked turns that make it one of the fastest tracks in NASCAR. In fact, it’s a little too fast. At high speed and high yaw angle (the angle between the front of the car and the direction the car is heading), the laws of aerodynamics make stock cars behave more like aeroplanes than automobiles. Over the years, eight NASCAR Cup drivers have died at Daytona, including Earnhardt – more than at any other track.
After Bobby Allison’s car became airborne and almost went over the catchfence at Daytona’s sister track, Talladega Superspeedway, in 1987, NASCAR mandated “restrictor plates” at both tracks. These limit airflow into the engine, which in turn restricts how much fuel can combust, therefore capping the car’s speed. But even with the engine throttled back to about 410 kW (550 horsepower), the cars routinely reach speeds of 320 km/h (~200 mph).
When packs of cars travel centimetres from each other at speeds above 300 km/h, even one tiny misjudgement can set off a massive chain-reaction crash
Yet, this is still not fast enough for racers. The only way to get more speed out of a car with a restricted engine is to follow another so closely that air flows over both cars as if they were one. The decrease in net drag from this “drafting” lets two cars move 5–8 km/h (3–5 mph) faster than either car could alone. But when packs of cars travel centimetres from each other at speeds high enough to traverse a football field in the blink of an eye, even one tiny misjudgement can set off a massive chain-reaction crash.
Racecar crashes are more dangerous than street-car accidents because racecars have so much more kinetic energy. A typical passenger car going 110 m/s (~70 mph) has 0.5 MJ of kinetic energy. A NASCAR racecar at top speed carries 12 times that – about the energy stored in 1.4 kg of TNT.
When a racecar stops, all this kinetic energy must be converted to other forms of energy. This happens over a timescale of seconds when a car comes in for a pitstop. Kinetic energy changes into heat (e.g. in tyres and brakes), sound (squealing brakes and screeching tyres) and light (glowing brake rotors). In a crash, energy is converted over a much shorter period of time, which leads to higher peak forces. In addition to heat, light and sound, energy may go into deforming the car, or producing rotational motion like spinning or flipping. Managing that energy is the key to keeping drivers safe.
A science experiment on wheels
When NASCAR started, racecars were made by putting roll cages inside ordinary road vehicles. As speeds increased and aerodynamics became more important, it was easier (and safer) to build the car around the roll cage. The fifth-generation racecar marked the first time NASCAR sent a computer-aided design file of the chassis to teams. While each team was allowed to individually develop features such as suspension set-up, NASCAR specified the dimensions, positions and wall thicknesses of every single tube in the chassis to ensure safety standards were kept across all teams. Each of the couple of dozen chassis a team makes over the course of a season is inspected by NASCAR using digital indexing arms and 3D laser scanning. Those that pass are certified with tamperproof radio-frequency identification (RFID) tags that are checked each time the car is presented for competition.
The strongest tubes in the chassis are closest to the driver, allowing the parts of the car furthest away to crush first. The front section is designed to push the engine downward instead of into the driver’s compartment in the event of a collision. The four horizontal doorbars on each side are staggered so that the top bar crushes first, then the next one down and so on, and they’re covered by a metal anti-intrusion plate.
The car’s “greenhouse” (the windscreen, side and rear windows, roof, and the structure supporting it all) poses a more formidable challenge. The driver needs a clear field of vision and an ability to escape the car quickly in the event of fire. That requires a design providing maximum strength with a minimum number of structural components. The windows themselves are made of high-strength laminated polycarbonate. While they can fracture, they are very hard to break, and because there is a layer of polymer film between the two sections, and adhesive mylar tear-offs on the front, any broken pieces can’t go flying too far.
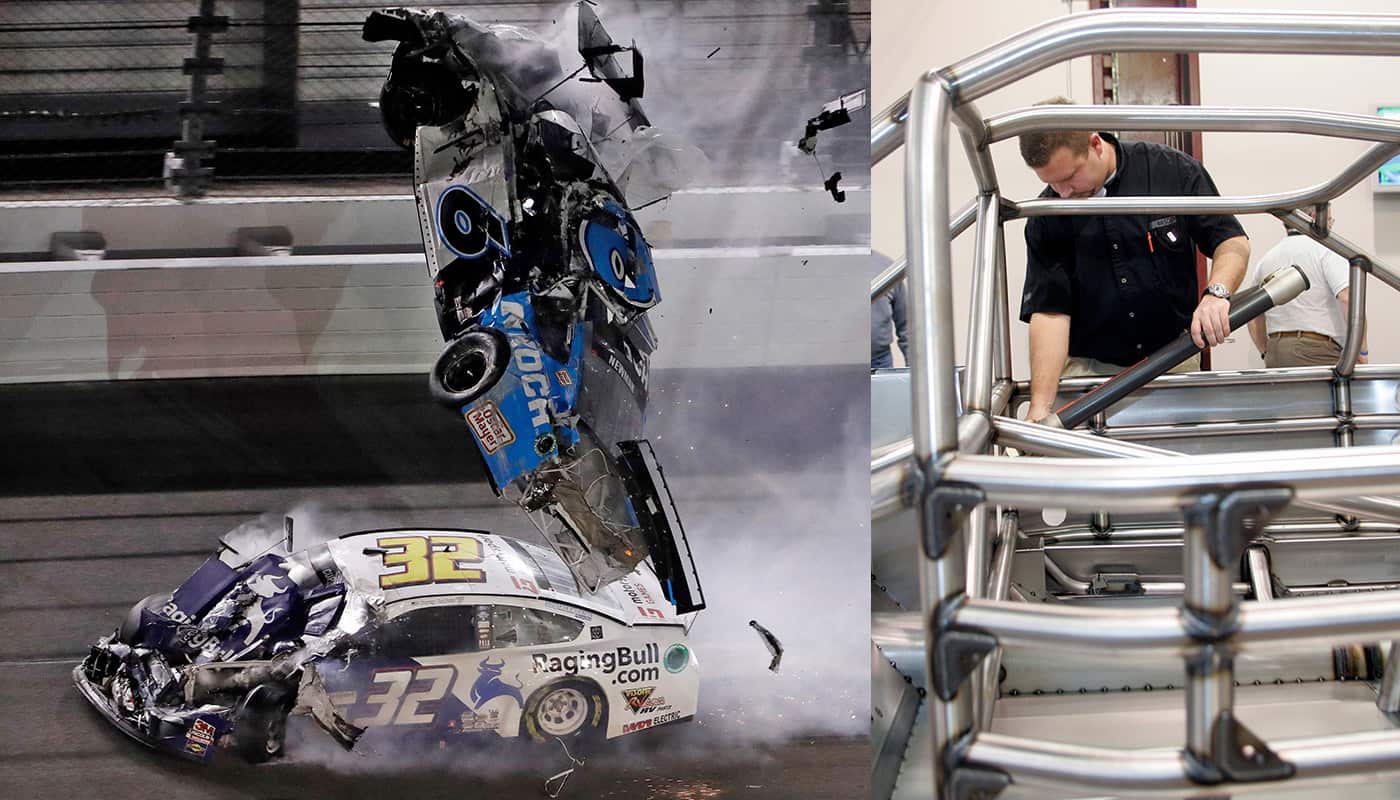
Luck or tech? Ryan Newman survived a major crash in February 2020 (left) thanks to safety features in NASCAR such as the Newman Bar in the chassis (right). (Courtesy: Chris O’Meara / AP / Shutterstock; Terry Renna / AP / Shutterstock)
An “Earnhardt Bar” was mandated after a 1996 Talladega crash in which another car’s nose crashed through Earnhardt’s windscreen and broke his sternum. This bar runs vertically down the centre of the windscreen, preventing anything large – like the nose of another car – from getting into the driver’s cockpit. The current Gen-6 car, introduced in 2013, also features a “Newman Bar” that provides extra roof reinforcement. The bar was named after Newman, who was vocal in calling for stronger roofs after going airborne twice in one year at Talladega. It then helped saved his life in the Daytona 2020 crash. The Gen-6 car also enlarged the greenhouse to put more distance between the roof and the driver’s head. The driver’s seat was moved 5 cm away from the door for extra protection against T-bone crashes, in which the nose of one car perpendicularly impacts the driver’s-side door of the other.
NASCAR chassis are built from magnetic steel, rather than materials like titanium aluminides to keep the cost down, but there are plenty of hi-tech materials protecting the driver. The thermoplastic composite Tegris (made by the US materials manufacturer Milliken & Co.) was first used for the newly introduced “splitter” on the fifth-generation car. Jutting out from the bottom of the front bumper and creating higher pressure on top than on the bottom, the device “splits” the air. The increased force on the car’s front end provides more friction – or “grip” – between front tyres and the track. A spoiler accomplishes the same task in the rear.
Tegris starts out as a cold-drawn, polypropylene oxide (PPO) tape yarn that is then woven into sheets. Unlike carbon-fibre composites, Tegris doesn’t require resin. The drawing process produces a highly oriented PPO core surrounded by an amorphous coating. Because the amorphous material melts at a lower temperature than crystalline PPO, the amorphous sections fuse together when the fabric is heated under pressure. Although Tegris has about 70% the strength of carbon fibre, it is more impact-resistant, lighter and about a tenth of the price. A sheet of Tegris on the driver’s-side door over the chassis frame prevents anything from getting through the doorbars and into the cockpit.
Before the exterior sheet metal goes on, blocks of energy-absorbing IMPAXX – a highly engineered, extruded thermoplastic foam – are fitted over the doors. In contrast to squishy foams that extend the time of collision and decrease the peak force, IMPAXX is rigid. Rather than temporarily storing energy, the stiff foam deforms, absorbing energy equal to the applied force multiplied by the foam’s displacement. The energy used to crush the foam is energy that never reaches the driver.
The final layer of protection
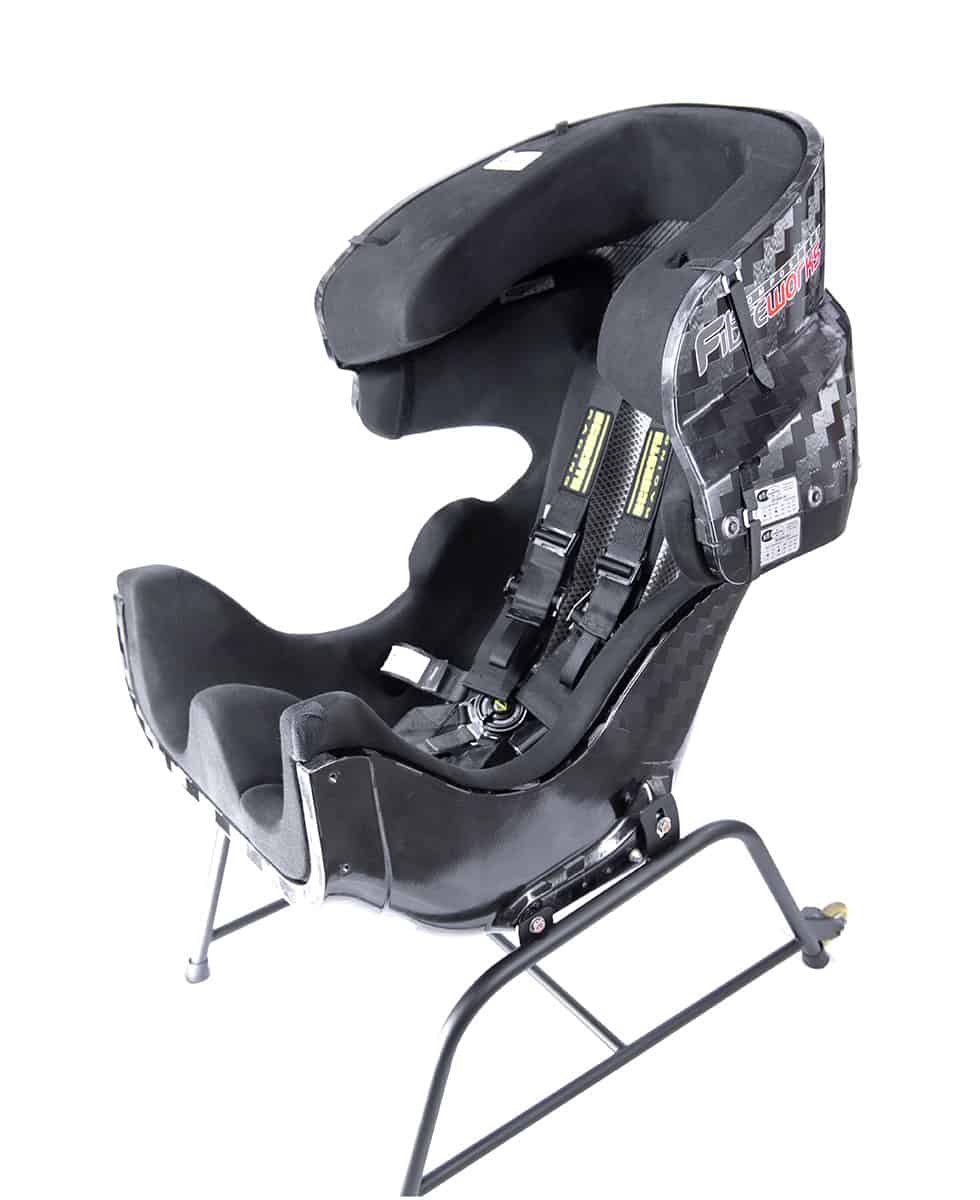
Everything inside the car is also optimized to manage kinetic energy. In fact, today’s aluminium or carbon-fibre driver-containment seats look more like something you’d find on a rocket than in a car. Custom-poured resilient-foam inserts conform to the driver’s body and padded arms wrap around the driver’s shoulders, pelvis and head to minimize side-to-side and backward motion.
One thing seats can’t protect against, however, is forward motion. NASCAR requires a six-point driver restraint harness, with wider belts than on a street car to distribute force better. One polyester belt runs over each shoulder, another two hold the pelvis, while two further belts go around the legs to prevent “submarining” – the driver slipping under the belt in an impact. Racing restraint belts are sturdier than passenger-car belts because they must tolerate higher forces, but they still stretch a little in an impact to lengthen the time over which the driver comes to a stop.
Restraining action NASCAR driver seats comprise foam inserts that conform to the driver’s body and a six-point body harness. (Courtesy: Mary Paulk / HMS Motorsport)
In the 1990s restraint belts had been improved so that they held drivers’ bodies tightly to their seats during a crash, but there wasn’t anything holding their heads. A typical human head weighs around 4.5 kg. Combine that with a 1.3 kg helmet, and in a 40g collision (deceleration at 392 m/s2), that head can snap forward at an acceleration of 107g (almost 1050 m/s2) – more than enough to break the driver’s neck. Basilar skull fractures – caused by a driver’s head whipping forward – became one of the most common causes of on-track deaths, including that of Earnhardt.
Since 2001 NASCAR has mandated the use of head-and-neck restraints. These devices consist of a harness worn around the chest or on the shoulders, with tethers that connect to the helmet. When the car stops suddenly, the tethers stop the head from snapping forward and instead slow it down gradually.
Solving one problem, however, often uncovers others. In the last few years, Dale Earnhardt Jr – the late Earndardt’s son who retired from NASCAR racing in 2017 – has raised awareness of crash-induced concussions, which has caused many drivers to re-examine their helmet choice. In fact, the 2020 Daytona 500 was only the second race in which Ryan Newman was using a new type of helmet. His head gear came from Arai, a company specializing in the more demanding needs of motorcycle racers, who have only their helmet between them and the track.
Helmets must serve a range of purposes: they need to be fireproof, cushioned to minimize forces on the head, and hard enough to prevent anything from piercing or crushing them. They also need to be as light as possible. Arai uses a proprietary combination of fibres and resin to create a fibreglass that is 30% stronger than traditional fibreglass but weighing just 0.5–0.6 kg rather than the 1.3–1.5 kg of a typical motorsports helmet.
Newman’s helmet also incorporated a layer of Zylon (a thermoset liquid-crystalline polyoxazole) around the crown area. Zylon, which has a tensile strength 1.6 times that of Kevlar, is just starting to appear in NASCAR, although Formula 1 has used Zylon tethers since 2001 to prevent wheels that come off cars in crashes from becoming projectiles. Indeed, Formula 1 also requires Zylon reinforcement in all helmets after a 700 g spring came off another car and hit driver Felipe Massa’s helmet in 2009, penetrating the headgear and fracturing his skull.
Newman and his team made his car as safe as possible. But there’s one more element that played a big role in helping him survive the accident.
SAFER tracks
Originally, concrete racetrack walls and the wire catchfences that followed were designed to keep cars out of the grandstands rather than to protect drivers. But by 1998, a staggering 41 drivers had died at Indianapolis Motor Speedway (which is not just used for NASCAR) through collisions with walls and other cars – some of the latter caused by track walls redirecting the car back into the traffic. Tony George, then-president of IndyCar (another US racing series) and owner of the speedway, set out to make the track safer.
The probability of two cars crashing into the same spot within moments of each other on a motorway is low, so barriers that cushion an impact by breaking or permanently deforming are sufficient. But they won’t work on a racetrack, where a dozen cars may be involved in a single accident. In addition, a racetrack barrier must be quickly repairable (and quickly cleaned up) so the race can continue.
The first instinct was to make the walls softer. Many tracks still use bundled-up old tyres, which works well for lower-energy impacts, but not the high-speed collisions at Indianapolis. In 1998 IndyCar tested40 cm-diameter, high-density polyethylene (HDPE) tubes that were placed in front of the speedway’s existing concrete walls and covered by inch-thick overlapping HDPE plates. Known as the Polyethylene Energy Dissipation System (PEDS), it allowed the car’s kinetic energy to move the plates and deform the cylinders. Unfortunately, although the PEDS successfully decreased the accelerations the drivers experienced when hitting the wall, it scattered debris all over the track. The HDPE also tended to “grab” a car when it hit, stopping it instead of slowing it down.
Absorbing impact The SAFER barrier, which combines hard steel and soft foam, is now mandatory at NASCAR and IndyCar tracks. The newer version of the barrier uses wedge-shaped foam inserts instead of the original flat pieces. (Courtesy: UNebraska)
IndyCar engaged Dean Sicking (an engineer and inventor who was then at the University of Nebraska) to redesign the PEDS, but he realized the problem wasn’t the concept, it was the material. So instead of using plastic, Sicking proposed steel. After overcoming plenty of scepticism that a harder material would provide better protection – and with funding from Indycar – he started work on the Steel And Foam Energy Reducing (SAFER) barrier. When NASCAR joined the project a few years later, he had to modify the design because the two types of cars carried different amounts of kinetic energy. Any barrier had to work for both.
The track-facing part of a SAFER barrier has five hollow-steel tubes, each with a 20 cm2 cross section and 0.5-cm-thick wall, stacked one atop another and stitch-welded together. High-strength nylon straps connect the impact surface to the track’s existing concrete wall. The space between the two walls is filled with 50-cm-thick wedges of foam, with the wedges’ narrow ends closest to the track.
When a car hits the SAFER barrier, its kinetic energy is used to move the massive steel wall and crush the foam wedges. The wedge shape helps the wall respond to the different kinetic energy scales of different cars. Indy officials routinely saw 100g and greater peak accelerations when cars hit concrete walls. The SAFER barrier brought most hits down to the 60–65g range. Today, SAFER barriers are mandatory on all IndyCar and NASCAR tracks (except Eldora Speedway, a small dirt track). The walls aren’t exactly soft, but they do save lives.
I would never deny that there was an element of luck involved in Ryan Newman being able to walk away from a spectacular crash with minimal injury. But most of the credit goes to the scientists and engineers – and the drivers – who refuse to accept that death is an inevitable part of racing.
Over the course of just one year, the bright X-ray corona surrounding a supermassive black hole dipped dramatically in brightness, before steadily recovering its initial luminosity. The event was observed by an international team of astronomers, led by Claudio Ricci at Diego Portales University in Chile, who suggest that the dimming could have been caused by a wayward star being torn apart by tidal forces. The team’s findings could lead to a better understanding of how X-ray coronas form in the first place.
Most normal galaxies are centred on a super massive black hole that creates an active galactic nucleus (AGN) – an extremely bright source of radiation created as matter accelerates into the black hole. AGN’s are known to host bright coronas of X-rays within their inner accretion disks. While the processes by which these structures form are not fully understood, they are thought to involve tangled magnetic fields situated close to the black hole. As these fields interact with hot electrons in the accretion disk, energy is transferred to surrounding photons to create high-energy X-rays.
In March 2018, Ohio State University’s All-Sky Automated Survey for Supernovae programme detected that an AGN 100 million light-years away called 1ES 1927+654 had surged to around 40 times its usual brightness at optical and ultraviolet wavelengths. This prompted Ricci’s team to closely monitor the object’s X-ray corona for any subsequent changes. To do this, they took frequent, measurements of the AGN using NASA’s NICER telescope, located aboard the International Space Station.
Dramatic drop
Following the initial brightening event, NICER’s measurements showed that the AGN’s corona plummeted in brightness by a factor of 10,000 in less than two months. In one instance, its brightness dropped by a factor of 100 in just 8 h. Then, after reaching its dimmest point at about 200 days after the first optical observation in March, the corona steadily increased in brightness; almost reaching pre-outburst levels around 300 days after the beginning of the event – signalling that the structure had re-formed.
Until now, astronomers had thought that such dramatic variations could only play out over thousands, or even millions of years – leading Ricci’s team to propose an updated theory. Their calculations suggest that the event could have been triggered by a star that wandered too close to the black hole and was ripped apart by gravity.
Afterwards, debris from the star would have knocked away material in the AGN’s inner accretion disk, causing much of it to suddenly fall into the black hole. This would destroy the tangled magnetic field lines, abruptly switching-off the power supply that drives the X-ray corona. Afterwards, material in the disk would be replenished, allowing the X-ray corona to return.
If this theory is correct, it would have important implications for astronomers’ understanding of how AGN coronas form; suggesting that only magnetic fields within their tidal disruption radii could be responsible for creating the structures. Ricci’s team will now continue to monitor 1ES 1927+654 for any further variations in brightness, which will enable them to constrain their predictions further.
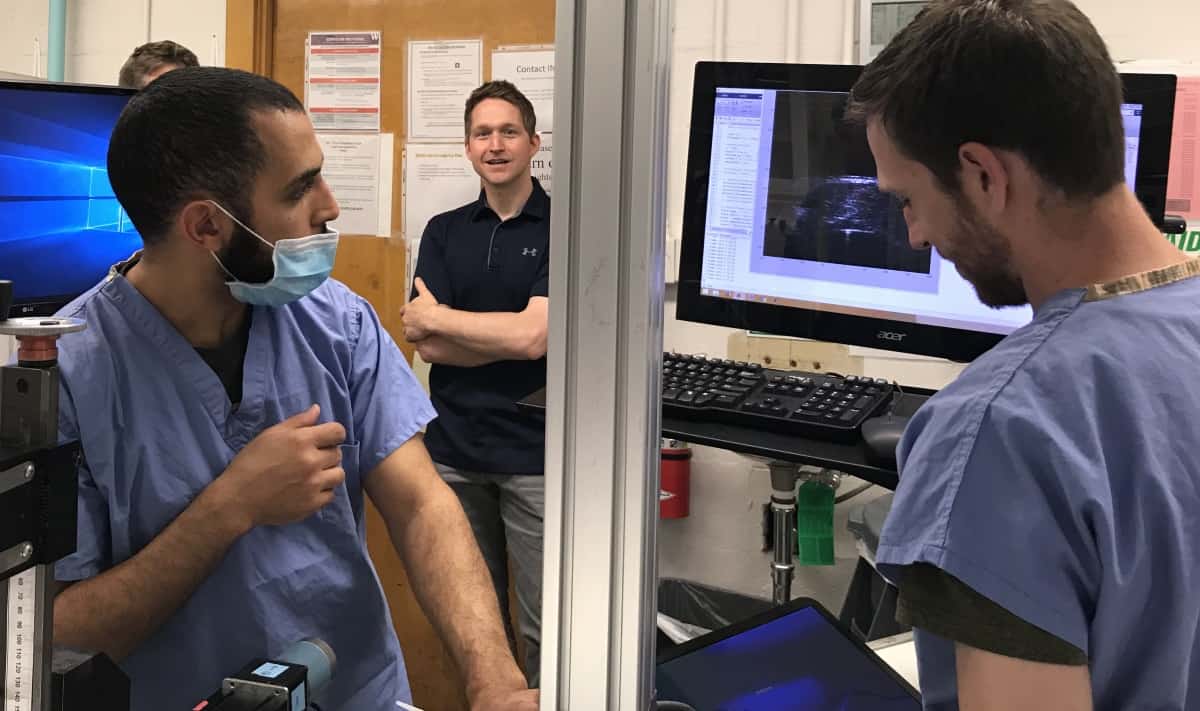
Left to right: first author Mohamed Ghanem, colleague Brian MacConaghy and co-author Adam Maxwell. (Courtesy: Center for Industrial and Medical Ultrasound/APL/University of Washington)
Acoustic tweezers that allow the remote manipulation of internal objects from outside the body could one day be used to expel urinary stones or control ingestible cameras. Researchers at the University of Washington and Moscow State University demonstrated the technique by trapping 3-mm glass beads in vortex-shaped beams of ultrasound. By steering the beams electronically, or by simply moving the ultrasound transducer, they directed the beads along complex 3D paths within a water tank and in the bladders of live pigs.
Optical tweezers have been used by physicists for decades to confine and manipulate microscopic objects. The technique is based on the fact that light refracted by a dielectric particle imparts a sideways kick, pushing the particle back when it deviates from the axis of a laser beam. This force keeps the particle at the centre of the beam where the light intensity is greatest. Acoustic tweezers work differently in that the trapped particle can also scatter the ultrasound beam. The particle therefore becomes trapped when the centre of the beam hosts a region of low intensity.
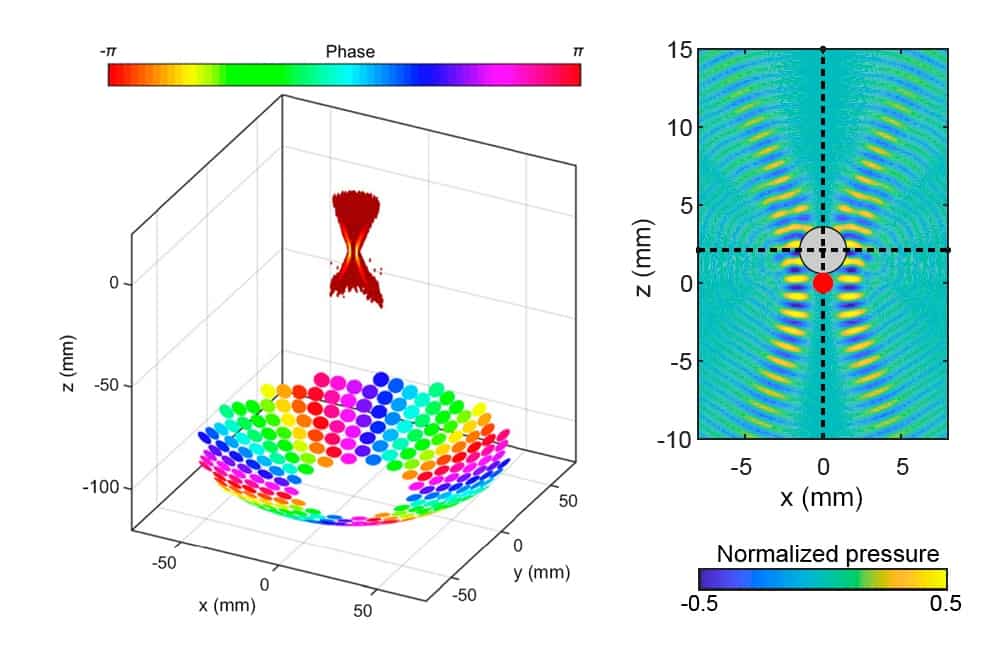
To create an ultrasound beam with such a configuration, Mohamed Ghanem, at the University of Washington, and colleagues configured a circular, 256-element ultrasound transducer such that the phase of each element varied according to its angular position on the array. This arrangement caused the sound waves to interfere destructively along the axis of the beam and constructively at the edge, generating a hollow, hourglass-shaped intensity pattern at the beam’s focus.
Left: the hourglass-shaped intensity pattern and the 256-element transducer array. Right: the intensity pattern with the beam focus (red spot) and the position of the glass sphere (grey circle) for one of the beam configurations. (Courtesy: PNAS 10.1073/pnas.2001779117)
The researchers used this intensity pattern to capture a glass bead resting on a membrane within a tank of water. Once captured, they moved the bead in the x–y plane (perpendicular to the array axis) by either moving the transducer or – at the risk of deforming the potential well and losing the bead – by steering the beam electronically.
As the bead was trapped just beyond the waist of the hourglass, the team could push it away from the transducer by extending the focus of the beam. By arranging the experiment so that the beam was directed upwards into the water tank, they used gravity as the returning force, allowing full control over the bead’s motion in the z direction.
In their in vitro setup, the researchers also experimented with different phase patterns and beam powers. They found that increasing the rate of phase variation around the transducer array produced a larger beam diameter and a deeper potential well for a given power output. Reversing the direction of this phase change shifted the helicity of the beam’s wavefront from clockwise to anti-clockwise or vice versa, arresting any rotational motion that could otherwise lead to the particle escaping from the trap.
To test the technique in vivo, Ghanem and colleagues implanted beads in the urinary bladders of three anaesthetized pigs. Directing the beam upwards into the pigs’ abdomens while the animals lay on their sides, the researchers moved the beads along complex paths several millimetres long. They point out that such distances are shorter than the 1–3 cm typically required to clear kidney stones or kidney stone fragments, but add that they are working on a system capable of steering particles along longer paths.
After the procedure, none of the animals showed any signs of injury caused by the ultrasound beam, though the researchers note that the rate of energy absorption – specifically, the ISPTA (spatial-peak temporal average intensity) – exceeded the safety limits defined for diagnostic ultrasound imaging.
“The ISPTA is conservatively set based on thermal tissue damage for developing embryos,” says Ghanem. “It is quite difficult for therapeutic techniques to come under such a threshold, but our tissue evaluation shows no tissue damage due to the ultrasound exposure.”
Apart from conducting further investigations into the technique’s safety, Ghanem and colleagues intend to test it under a range of conditions on randomly shaped targets with different acoustic properties. They also foresee it being used beyond the medical realm, with possible applications in zero-contamination manufacturing or laboratory environments.
From combustion to aerodynamics, a deep understanding of physics has always been at the heart of car design. Today, physics-based technologies are playing an even greater role, as the electric car market expands and vehicles become increasingly autonomous. This video introduces some of the key themes of the August 2020 issue of Physics World – a special issue on physics and cars.

 Motivated by the recent trend toward super-concentrated aqueous electrolytes for high-performance batteries, we utilize Dragonfly – a Bayesian machine-learning software package – to search mixtures of commonly used lithium and sodium salts for super-concentrated aqueous electrolytes with wide electrochemical stability windows.
 Venkat Viswanathan is an Associate Professor of Mechanical Engineering at Carnegie Mellon University. He received his PhD from Stanford University working on lithium-air batteries. His current research focus is on understanding and developing novel electrochemical devices for energy storage and utilization.