The impact of the coronavirus lockdown on the economy has already been profound. According to forecasts from the International Monetary Fund (IMF), the world’s overall gross domestic product (GDP) will be 6.5% smaller by the end of next year than it predicted in January 2020. The IMF reckons the UK, which earlier this month officially went into recession, will borrow more than £400bn in two years as the coronavirus recession decimates public finances. In fact, Britain will suffer the fifth biggest downturn of all G7 nations, with only France and Italy doing worse.
One slice of good news is that those same forecasts say that although UK GDP will fall 10.2% this year, it will grow by 6.3% in 2021, providing a stronger recovery than in eurozone nations. The IMF also notes that the UK government’s response to the crisis has been one of the strongest. It introduced a widely applauded stimulus package, including a “furlough” scheme whereby companies can apply to receive a large part of their salary bill to avoid having to lay off staff.
Nine million people were furloughed in June and the UK’s 2020 budget deficit is expected to be £270bn – a figure that will only halve next year as the economy struggles to recover from lost output. In fact, the IMF has urged all governments to continue with further stimuluses. “Once the pandemic is under control, broad-based fiscal stimulus to support the recovery could focus on public investment, including on physical and digital infrastructure, healthcare systems, and the transition to a low-carbon economy,” it said.
Now that lockdowns are easing, every business leader, owner or manager will have one question on their mind: “How can we make this business work?”
Businesses are essentially simple. They need sales. They have costs. And they need to generate a profit to survive. They grow when demand is rising and shrink when they fail to innovate or don’t switch to products or services that are more in demand. In reality, business life is complex and any pause in sales can be devastating. Jaguar Land Rover’s closure of its car-assembly lines during lockdown, for example, has cost it about £1bn a month, while its new-car sales plummeted by more than 30% in the three months to the end of March.
But now that lockdowns are easing, every business leader, owner or manager will be working through sales data, cash-flow forecasts and profit-and-loss projections with one question on their mind: “How can we make this business work?”. Unfortunately, all the usual seasonal variations and trends can no longer be relied on; COVID-19 has changed everything.
With so little certainty, the one short-term thing that company directors can do to make a profit is cut costs. So unless they can raise external finances, businesses will have to fire staff, reduce their fixed costs or – more likely – do both. Some firms will be forced into administration and some will try to start again. It’s horrible for all concerned: UK unemployment figures have already doubled to 3 million during the lockdown, with some surveys indicating that a quarter of all those on furlough losing their jobs by the end of the year.
The businesses that survive will be those that adapt, innovate or reinvent themselves. Scottish textile manufacturer Don & Low, for example, has switched production to make up to 1.5 million personal-protective equipment gowns per month. Chemical giant Ineos plans to build new factories to produce a million bottles of hand sanitizer a month, while Scottish independent brewer BrewDog used its distillery in Aberdeen to make hand sanitizer. French luxury-goods maker LVMH is also switching its perfume factories to make hand sanitizer.
Clear and rapid responses like these to changing market conditions are the key to commercial survival. In fact, the ways in which businesses have fought the problems from COVID-19 can and should be part of all corporate thinking. Companies have to challenge their assumptions about what customers want and focus on being competitive. What can be automated or done online? Act, and act fast. Doing nothing will only leave you with bigger debts and problems to manage.
Act, and act fast. Doing nothing will only leave you with bigger debts and problems to manage
Take the classic British pub, which my friends and I were discussing on a recent Zoom drinks evening. The pub has been the same forever. It’s a room with a bar, with someone on one side selling alcohol and someone on the other wanting to buy it. But how can pubs survive if drinkers have to stay socially distanced? Well, you could just restrict customer numbers, but how about an app where you book a table and order your food and drinks, which someone then brings to you.
As one of our Zoom group quickly pointed out, British pub giant Wetherspoons developed just such an app in 2017 and several other pub chains followed suit. App-less pubs will struggle to catch up. Of course, some companies happen to be in the right place at the right time. The Zoom video-conferencing business, for example, grew its UK user base from 660,000 at the start of the year to over 13 million by April.
Or take one of the firms I work for, which makes sensor systems to check on old and vulnerable people who cannot leave their homes. Before lockdown, everyone liked the idea and there were plenty of trials, which showed you could save a lot of money. But inertia and habit meant there was no urgency in actually installing such systems. Now, though, with many carers unable to visit patients, the question is how fast it can be done.
That’s the essence of business: meeting market demand and solving a customer’s problem. This might seem too simplistic for us physicists, but it’s commercial reality. So if you want your business to survive, innovation is the answer.
Researchers from the University of Houston have developed a new form of bioelectronics known as “drawn-on-skin” (DoS) electronics, in which multifunctional sensors and circuits can be drawn directly onto the skin with a specialized ink pen. Their study, published in Nature Communications, shows that information collected using DoS electronics is more reliable and consistent than that obtained with electrodes commonly used in wearable bioelectronics.
“[The circuits are] applied like you would use a pen to write on a piece of paper,” says senior author Cunjiang Yu. “We prepare several electronic materials and then use pens to dispense them. Coming out, it is liquid. But like ink on paper, it dries very quickly.”
Senior author Cunjiang Yu.
Yu and colleagues used three different inks to draw the various elements of the bioelectronic platform (conductors, semiconductors and dielectrics) into the outlines of a stencil. Any imperfection can be corrected by simply drawing on top of it. Once dried, the drawn structure can deform with the skin and collect a wealth of physiological signals.
Conventional wearable bioelectronics generally suffer from motion artefacts that lead to data misinterpretation and misdiagnoses. These artefacts mainly arise when weak adhesion or imperfect conformability create an inconsistent interface between the electronics and the skin. When drawn on the skin, however, DoS electronics form an ultra-conformal, robust and stretchable interface that is immune to the skin’s motion.
A wealth of physiological signals
The team investigated the various measurement possibilities offered by the sensors. For example, by tracking variations in the sensors’ resistances, the researchers found that they could detect tissue deformations or changes in ambient temperature. Further experiments also revealed that DoS sensors are able to record skin impedance, from which hydration levels of the skin layers could be extrapolated, even under strain.
Of the various measurable features, however, none might be more important than electrocardiograms (ECG) as they can help to predict and prevent imminent cardiovascular events such as arrythmia. DoS sensors not only provide a clear ECG signal but can also track changes in heart rate, which highlights their potential as monitoring tools.
When compared against a hospital-grade gel electrode and an ultrathin serpentine-mesh electrode, the DoS sensor was the least affected by the presence of sweat and was the only sensor able to provide a robust ECG signal over a 7-hr period. Interestingly, ECG recordings obtained from the DoS sensor showed no abnormal deviations when undergoing regular intervals of stretching, compressing and releasing of the skin at their site of deposition, in contrast to the two other sensors.
Additional studies revealed that the sensors could also capture electromyographic signals – the electrical activity of muscles. Throughout all these experiments, DoS sensor signals were not subject to motion artefacts, which constitutes a major improvement over standard wearable bioelectronics.
Better than a bandage?
The most fascinating feature of this novel sensor, however, might be its ability to speed up wound healing. Pulsed electrical stimulation of the skin has been shown to accelerate wound recovery and the researchers tested whether their DoS sensor could induce such a process. They surgically created a 1 cm wide skin wound in mice and then drew electrodes only on the top half of the wound. After five days, the scab width on the treated side had reduced by an average of 8 mm whereas the scab on the untreated half had only decreased in width by 4 mm, on average. Such devices could be of great use, for example, in low-resource environments or on battlegrounds.
DoS electronics are simple to fabricate without requiring dedicated equipment. They can construct active electronics, with multi-functional devices and sensors, and are inherently immune to motion artefacts. As such, they represent a promising technology to keep an eye on in the field of bioelectronics and personalized point-of-care treatments.
The coffee ring effect can be suppressed in 2D-crystal ink droplets by using a specific mixture of alcohols as a solvent. That is the conclusion of an international research team led by Tawfique Hasan at the University of Cambridge. It has found that Marangoni flow in the drying droplets suppresses the capillary flow that creates rings. The study could lead to better techniques for printing nanoparticles onto substrates for the manufacture of electronic and photonic devices.
Nanoparticles and 2D nanocrystals such as graphene have unique electronic and optical properties that can be very useful for creating new technologies. The tiny particles can be suspended in a solvent and the mixture used as an ink to pattern a substrate to create a device. However, this process is hindered by the coffee ring effect – which is also responsible for the dark ring at the edge of a dried coffee stain. This ring forms because the outer edge of a coffee droplet dries faster than the interior. This drives a capillary flow of liquid and coffee particles from the centre of the droplet to the edge. Once the liquid has evaporated, a concentrated ring of coffee particles is left behind.
This effect can be suppressed in 2D crystal printing using material additives, but these introduce irregularities that limit the electrical performance, scalability, and reproducibility of devices. In previous research, Hasan’s team discovered that the coffee ring effect can be inhibited by using specific mixtures of alcohols as ink solvents. In droplets containing black phosphorous flakes they found that these mixtures could induce Marangoni flows, which are driven by gradients in surface tension.
Alcohol cocktail
In their latest research, the researchers explored the drying mechanisms of the process in more detail using several different types of flakes including graphene. Through a series of experiments, they determined how the uniformity of crystal depositions varied between inkjet-printed droplets with different alcohol mixtures. Using high-speed micro-photography to map out the trajectories of the suspended particles, they discovered that a high degree of uniformity could be achieved through inks containing a certain mixture of isopropyl alcohol and 2-butanol.
As they dried, Marangoni flows in these droplets prevented the droplet contact lines from pinning to the surface, allowing the droplets to spread out over larger areas. This action suppressed the capillary flows that cause the coffee ring effect, allowing crystal flakes to be evenly deposited across the glass substrate as the droplets dry. Hasan’s team could print micron-scale arrays of 4500 nearly identical devices onto both silicon wafer and plastic substrates. They also demonstrated a near indistinguishable performance in the devices as gas sensors and photodetectors.
The technique could be used to create inexpensive electronic and photonic devices, as well as catalysts, solar cells, batteries, and functional coatings.
Researchers in the US and Italy have identified a second critical point in two realistic theoretical models of water. This finding, which draws on state-of-the-art computational methods and supports a hypothesis first put forward more than 25 years ago, suggests that water exists in two distinct liquid phases, one of which is less dense and more structured than the other.
The central role of water in life as we know it makes it easy to forget just how unusual it is. Unlike most other liquids, water is denser at ambient pressure than the ice it forms when it freezes. It also exhibits negative thermal expansion (meaning that it expands on cooling, rather than contracting), becomes less viscous when compressed and boasts no fewer than 17 crystalline phases.
But the list of oddities doesn’t end there. In 1976, Austen Angell and Robin Speedy discovered that water’s behaviour becomes even more atypical when it is cooled below its freezing point while remaining in liquid form – a “supercooled” state that occurs naturally in high-altitude clouds. Then, in 1992, a computational study by Peter Poole and colleagues at Boston University in the US suggested an even more tantalizing possibility. According to their simulations, supercooled water undergoes an additional phase transition between two liquid phases, with a liquid-liquid critical point (LLCP) occurring at pressures 2000 times higher than atmospheric pressure at sea level.
“The presence of the critical point provides a very simple explanation for water’s oddities,” says Pablo Debenedetti, a professor of chemical and biological engineering at Princeton University. For this reason, he adds, “the finding of the critical point is equivalent to finding a good, simple explanation for the many things that make water odd, especially at low temperatures.”
Seeking definitive proof
Since 1992, scientists have garnered much evidence to support the existence of an LLCP and an associated liquid-liquid phase transition (LLPT). However, no-one has yet produced definitive experimental proof, and computational research has been hampered by the extreme difficulty of performing calculations on water’s behaviour at deeply supercooled temperatures. Indeed, previous computational studies have only found evidence for an LLPT in the so-called “ST2” model of water, which does not fully capture the material’s characteristic geometric structure (which is tetrahedral, with four water molecules clustered around a fifth in the centre).
Debenedetti and colleagues Gül Zerze at Princeton and Francesco Sciortino of the Sapienza University of Rome have now observed LLCP behaviour in two models of water, TIP4P/2005 and TIP4P/Ice, that are far more realistic. To do this, they performed molecular dynamics simulations lasting tens of microseconds – a long time, given the large number of molecules being simulated (300 in one experiment) – and used the results to collect statistics on the density of liquid water and its thermodynamic energy fluctuations. They then used statistical mechanics to predict the behaviour of these density and energy fluctuations across a range of temperatures and pressures. Finally, they fit the statistics of the fluctuations to theoretical predictions made using the 3D Ising model of magnetism, which can be used to describe the behaviour of fluids close to their ordinary vapour-liquid critical point.
The team. Courtesy: David Kelly Crow, Francesco Sciortino and Gül Zerze
From this constrained fit, the researchers obtained values of water’s critical temperature and pressure. They also computed a quantity called the static structure factor, which relates to the way the density of a fluid varies as a function of distance from a central molecule – something that Debenedetti notes can also be measured experimentally, for example with X-ray scattering.
The Princeton team extract two quantities from this information: water’s isothermal compressibility, which quantifies how sensitive its density is to changes in pressure; and its correlation length, which quantifies the distance over which density fluctuations are correlated. Both quantities become infinite at a critical point, and the dramatic growth in their numerical value leading up to that point is expected to follow precise mathematical expressions, Debenedetti explains.
“We observed a very pronounced growth in the compressibility and the correlation length for both of the water models we studied,” he says. From the form of this growth, he adds, he and his colleagues were able to locate the hypothesized second critical point at around 170 K in one model and 190 K in the other.
Consistent values
Debenedetti says that the results of their simulations are consistent with pronounced density fluctuations occurring on all length scales close to the critical point. Such behaviour is characteristic of the 3D Ising “universality class”, where a universality class is the collection of models (or actual experimental systems) that exhibit the same scale-invariant behaviour near a critical point. Since the behaviour of fluids close to their ordinary vapour-liquid critical point shows similarities with the 3D Ising model of magnetism, the growth of the correlation length close to this new liquid-liquid critical point should obey the same mathematical equation: a power law with the same, universal exponents. “We have now observed this behaviour close to the liquid-liquid critical point in the TIP4P/2005 and TIP4P/Ice models of water,” he tells Physics World.
The difference between the two liquid phases observed in the model is subtle but important, Debenedetti says. Whereas the local arrangement of molecules around a given water molecule is tetrahedral in the low-density liquid phase, in the high-density phase a sixth molecule squeezes in to disrupt this arrangement.
Alternative computational approaches
Debenedetti stresses that actual verification (or otherwise) of a second critical point in real water must come from experiments, not just simulations. He and his colleagues, who report their work in Science, hope their work will further motivate experimentalists’ quest to prove or disprove its existence. “For our part, we are now investigating even better models,” he adds. “We are particularly interested in machine-learning-based approaches that combine quantum-level accuracy while avoiding the high computational cost associated with explicit quantum calculations.”
Ultrahigh dose rate radiation therapy (FLASH) is currently one of the hottest topics in radiotherapy research. Several animal studies (and recently, a first-in-human case report) have shown that the probability of radiotherapy side effects can be greatly reduced when the radiation dose rate is ramped up from the standard 0.1 Gy/s to 40 Gy/s or more.
In order to use such high dose rate treatments safely, it is imperative to continuously monitor where and how much dose is really being deposited in the patient. This is currently only possible for tumours on or close to the skin surface where dosimeters can be placed easily. Researchers at the University of Michigan have now proposed a new method to measure dose, even deep within a patient, while simultaneously obtaining images of the radiation target and surrounding tissue. They have published the details of their study in Medical Physics.
Radiation dose can be “heard”
The basis for the proposed imaging method is the thermoacoustic effect. As ionizing radiation deposits energy in the patient, the temperature increases in the tissue receiving this radiation dose. This causes thermal expansion, leading to a pressure wave that propagates outward. In conventional radiotherapy, these waves are extremely weak: each radiation pulse delivered by the accelerator leads to a pressure wave on the order of 10 mPa (about ten million times smaller than standard atmospheric pressure).
But with FLASH dose rates of 40 Gy/s or more, the pressure of the generated sound waves can be as high as several pascals per pulse. At this level, the signals are easily detected by conventional ultrasound probes placed on the patient’s skin. The team call this technique ionizing radiation acoustic imaging.
Overcoming equipment limitations
Since regular medical linear accelerators (linacs) are not built to deliver FLASH treatments, first author Ibrahim Oraiqat, senior researchers Issam El Naqa and Xueding Wang, and colleagues first had to modify a regular linac to enable the delivery of 6 MeV electrons at FLASH dose rates. Their experimental setup consisted of a gelatin phantom (to simulate human tissue) and ultrasound probes, both immersed in water. Since the same ultrasound probes were used for both acoustic dosimetry and standard ultrasound imaging, the group needed a way to prompt fast switching between the two probe modes. They accomplished this by using Cerenkov radiation, emitted by the high-energy electrons as they pass through the water, as a trigger to signal to the probes that the beam was on.
The group’s experiments showed that the acoustic imaging signal increased linearly with the dose-per-pulse – a highly desirable property in a dosimeter – and that acoustic dose measurements at different depths agreed with benchmark measurements using commercial film dosimeters. Finally, the group successfully performed simultaneous acoustic dosimetry and ultrasound imaging in a moving tissue-mimicking phantom of a rabbit liver. They could accurately pinpoint where the radiation dose was deposited as the phantom moved and monitor it in real-time, as shown in a supplementary video.
Towards standard clinical use
Since FLASH is still an experimental treatment method, Oraiqat and colleagues are working to also make acoustic imaging accessible for standard radiotherapy. The group’s next steps will include incorporating ultrasound information on tissue properties in the acoustic image reconstruction. This could make it possible to measure how much dose is delivered even if the target is not a homogeneous gel but, say, a patient consisting of various tissue types. This would be another large step towards the first real-time acoustic dose measurement in a patient.
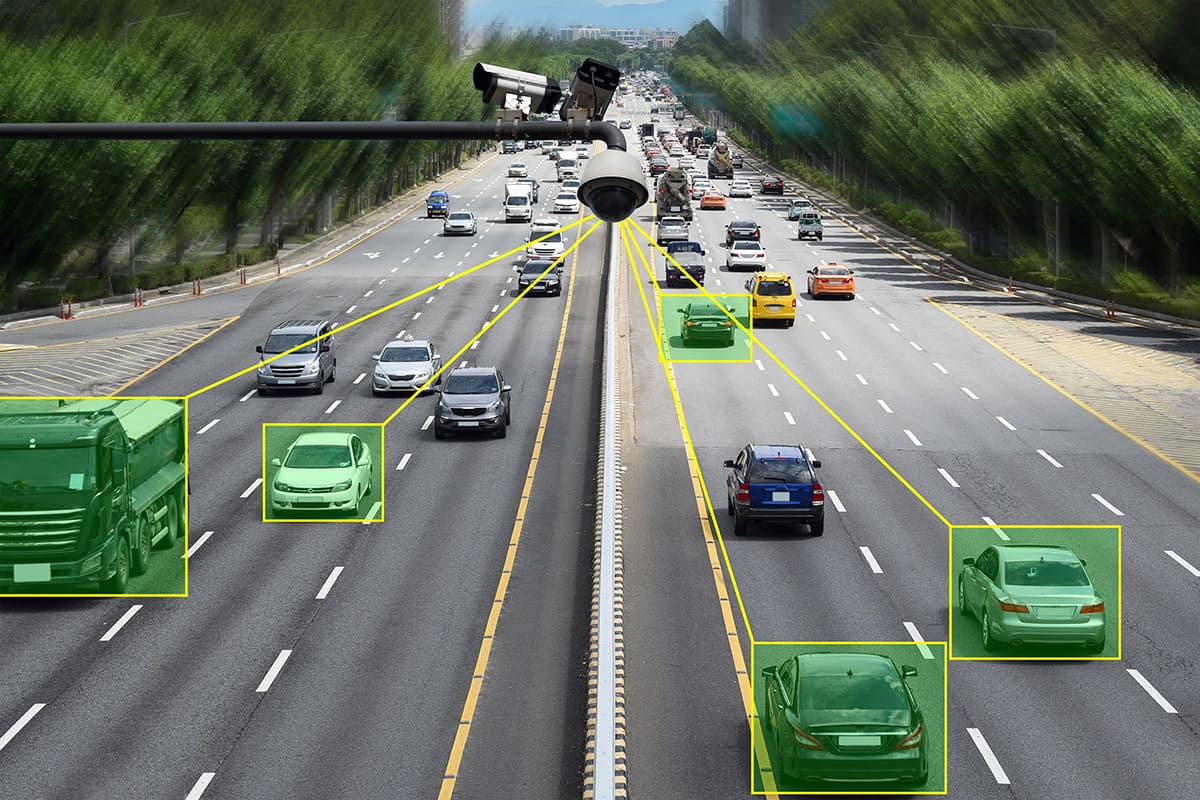
One morning in March 2019, a brand new, cherry-red Tesla Model 3 sat in front of a Sheraton hotel in Vancouver, Canada. Once they were inside the car, Amat Cama and Richard Zhu, both tall and lean twentysomethings, needed only a few minutes. They exploited a weakness in the browser of the “infotainment” system to get inside one of the car’s computers. Then they used the system to run a few lines of their own code, and soon their commands were appearing on the screen.
They’d hacked the Tesla.
Cama and Zhu got the car, but they weren’t thieves. They’re a pair of legendary “white hats” – good-guy hackers who find, exploit and reveal vulnerabilities in devices that connect to the Internet, or other devices. A car packed with self-driving features could be the ultimate prize for hackers who can’t resist a challenge.
Hacking the Model 3 was the final test in the 2019 round of the prestigious Pwn2Own annual hacking event. The competition is lucrative: during the 2019 Pwn2Own, Cama and Zhu, who work together under the team name Fluoroacetate, won most of the hacking challenges they entered and left Vancouver with $375,000. And, of course, the car.
As per the tradition at Pwn2Own, the security flaw was reported to Tesla, and the car company soon issued a patch so that other hackers couldn’t replicate Fluoroacetate’s method. But that’s not to say that the car is invincible, or ever will be. Rigging a car to drive by itself – or use related technologies like self-parking or lane-change monitoring – needs an array of diverse hardware and software to be installed and co-ordinated. It also requires that a car can get online to access traffic data, connect with other cars to make strategic decisions, and download necessary safety patches.
Left unsecured, these “attack surfaces”, as they’re called by researchers who work on autonomous vehicles, offer a veritable cyber-buffet of ways to break into a smart car. “There are so many different systems all communicating with each other in a car,” says computer scientist Simon Parkinson, who directs the Centre for Cyber Security at the University of Huddersfield, UK. “To really understand all the ways that somebody could try to abuse a system is very complex. There will always be a risk.”
Physicists, mathematicians and computer scientists have fortunately built models that simulate some of the possible vulnerabilities but they are by no means exhaustive. “No matter how hard we try and how complex we make the security solutions on vehicles, it is impossible to make something perfectly secure and unhackable,” noted mathematician and security researcher Charlie Miller, now at Cruise Automation in San Francisco, California, in a 2019 essay for IEEE Design&Test.
Self-driving car technologies, say the most vocal proponents, may improve safety and save lives. But the same technology exposes human passengers to new and untested varieties of cyber-threats and risks. Recent studies have shown, not surprisingly, that hacking increases the likelihood of collisions and life-threatening hazards. Skanda Vivek, a physicist from Georgia Gwinnett College in Atlanta, US, has even turned to statistical physics to predict possible outcomes from hacking scenarios, using his findings to develop and propose solutions too. He says any car built with devices that connect to the Internet is vulnerable to a hack, but the threat to autonomous cars is particularly high because computers control so many functions.
So far, car manufacturers have not produced fully autonomous vehicles that can legally and safely drive all the world’s highways. While that’s the dream, it is also the great unknown. The complexity of these cars means researchers don’t know all the possible risks or hacks, which makes it tricky to know how to optimize safety.
“Once you have access to a vehicle, you pretty much have access to any part,” says Vivek, who runs an autonomous vehicle consulting service called Chaos Control. “If you get to one control unit – like the entertainment system, for example – then with some reverse engineering you could control the steering wheel.”
Defining autonomous
The term “autonomous vehicle” is historically ill-defined, but in 2014 SAE International (formerly known as the Society of Automotive Engineers) introduced a classification system for technologies that enable a car to have some self-driving features.
Level 0 systems have no control over the vehicle but may sound warnings or help in emergencies.
Level 1 systems include adaptive cruise control and lane-change assistance. Under some circumstances, the car can control speed or the steering wheel, but not at the same time.
Level 2 systems expand on level 1, allowing the car to take over steering and speed at the same time under some conditions. Self-parking technology falls in this category; so does Tesla’s Autopilot system.
Level 3 systems can drive the vehicle, though a person is required to remain in the driver seat and take control when requested by the car. Audi had originally planned to debut the first level 3 system in 2020, but in April announced it was abandoning the effort.
Level 4 systems are almost completely autonomous. They can drive on prescribed routes under certain conditions – not during inclement weather or at high speeds, for example. But a human driver needs to be available to take the wheel.
A level 5 autonomous car can drive anywhere in the world without requiring human intervention.
The arrival of car computers
For most of their first century on the market, cars were mechanical, physical objects that relied on the most basic ideas of physics to turn fuel into motion. A combustion engine delivered power; the driver used a throttle to control speed; four wheels and a steering wheel turned; disc brakes, some controlled with levers, slowed down the wheels.
But that changed in the 1970s as computer code began to be introduced to car systems. Vehicles started to include electronic control units, or ECUs, to run increasingly complicated electronic systems. Since then, the number of ECUs has soared, with cars sold today including anywhere from 70 to 150 such devices. They monitor the crankshafts and camshafts; they deploy airbags; they receive and relay signals from flat tyres and emptying gas tanks. Importantly – especially to hackers – they talk to each other via the Controlled Area Network, or CAN bus, which essentially functions like a nervous system for the car.
These sophisticated computer systems have made it possible to advance on another unmet dream that’s been around almost as long as cars have been on the roads – the driverless car. In the 1920s engineers first navigated a remote-controlled car through New York City traffic. The Futurama exhibit – brainchild of the American industrial designer Norman Bel Geddes – at the 1939 World’s Fair suggested a future in which people travelled between cities by giant superhighways in autonomous vehicles that could navigate using electromagnetic fields embedded in roads. In the 1940 book Magic Motorways, Bel Geddes also wrote that the cars should drive themselves.
By the early 21st century, self-driving cars seemed less a far-fetched dream and more the inevitable evolution of the automobile. Some developers had begun to regard cars not only as modes of transportation, but as platforms for building new tech applications. And this shift in thinking led some researchers to explore what new vulnerabilities these changes brought with them.
Hacking hall of fame
In 2009 researchers from the University of California San Diego and the University of Washington in the US bought two new cars, laden with complex electronics, and took them to an abandoned airstrip to test the limits of manipulation. (They didn’t identify the make and models of the cars.) They attached a laptop to a port in the dashboard and, using specially developed software called CARSHARK, they began to send their own messages through the car’s CAN bus to see what they could change.
A lot, it turned out. Publishing their results in May 2010 in the IEEE Symposium on Security and Privacy, they had found a way to manipulate the display and volume of the radio. They falsified the fuel gauge, switched the windscreen wipers on and off, played an array of chimes and chirps through the speakers, locked and unlocked the doors, popped the boot open, honked the horn, sprayed windscreen fluid at random intervals, locked the brakes, and flicked the lights on and off. They also wrote a short computer program, using only 200 lines of code, that initiated a “self-destruct” sequence, which began with a displayed countdown from 60 to 0 and culminated with killing the engine and locking the doors.
In August 2011, after critics and carmakers downplayed the threat because the hack was executed from inside the car, the same team showed that they could similarly hijack the CAN bus remotely, through either the Bluetooth or cellular connection. Miller described that demonstration as ground-breaking: it showed for the first time that, in theory, any car could be hacked from anywhere.
Motorway mayhem Researchers have demonstrated they can even hack cars on a motorway from the comfort of their own home. (Courtesy: iStock/Jae Young Ju)
But it still didn’t convince automakers to change anything, Vivek says. In 2012, using a grant from DARPA (the research and development arm of the US Department of Defense), Miller and his colleague Chris Valasek, also now at Cruise Automation, demonstrated how to hack a 2010 Ford Escape and a 2010 Toyota Prius. The hack, like the first one in 2010, required physical access to the car. Toyota responded with a press release noting that it was only concerned about wireless hacks.
“We believe our systems are robust and secure,” the Japanese car giant stated.
In 2014, again using a DARPA grant, Miller and Valasek upped the game. They analysed computer information on a range of cars, looking for one with ample attack surfaces and a fairly simple network structure to allow for widespread mayhem. They settled on a 2014 Jeep Cherokee.
In what’s become one of the most famous hacks of cars, in 2015 they showed how, from the comfort of home, they could take control of the car while it was driving on a highway. Then, to add terror to nightmare, they scanned other nearby cars and found that 2695 vehicles on the road, at the same time, had the same vulnerability. Hacking them all, simultaneously, would not have been difficult.
“In many ways, this was the worst scenario you could imagine,” Miller wrote in 2019. “From my living room, we could compromise one of any of 1.4 million vehicles located anywhere in the United States.”
Safety in the rearview mirror
In the aftermath of the 2015 hack, which was well-publicized, Jeep issued a software patch for its Cherokee. That same year, other groups of white-hat hackers found ways to take control of GM vehicles and disable the brakes of a Corvette. In March 2016 the Federal Bureau of Investigation issued a warning – the first – about the cybersecurity risk to cars.
Back at Huddersfield, Parkinson says he’s seen advocacy groups, government agencies and even some carmakers start to address hacking as a high-profile risk. But the supply chain for making a car is long and complicated, and manufacturers often enlist other companies to build technological features. Cars from Tesla, Audi, Hyundai, Mercedes and others rely on software developed by third parties, which may enlist dozens – if not hundreds – of coders to contribute to the final project. As with other connected devices, the rush to get a gadget to market can railroad efforts to make it safe.
“Functionality takes priority over security because that’s what sells,” says Parkinson. And even if carmakers do address problems as they arise, he says they’re doing so in a reactive manner rather than anticipating problems – and solving them – before the car hits the pavement.
Vivek, in Georgia, says that notable hacks in the past have exposed risks to individual cars, but researchers are still trying to grasp how a multi-car hack might unfold in a real-world situation. He and colleagues from the Georgia Institute of Technology, where Vivek was a postdoc, set out to model a worst-case scenario in which hackers disabled many Internet-connected vehicles at once.
There’s a rich tradition of physicists taking a hard look at traffic. For at least two decades, researchers have been studying traffic flow as a many-body system in which the constituent particles interact strongly with each other. (This is easy to see during rush hour, as the slowing or accelerating behaviour of one car affects those behind it.) They’ve modelled the conditions under which traffic jams form, shown how jams are similar to shock waves described by nonlinear wave equations, and predicted interventions (like keeping ample space between cars) that could boost fuel efficiency. One traffic model, called the Intelligent Driver Model (IDM), simulates drivers who obey equations of motion.
In their work, Vivek and his colleagues used IDM and other models to simulate traffic as an active-matter system including two kinds of “particles” – some driven by humans, and some driven autonomously. They also gave the car-particles the ability to switch lanes, and the motion of individual cars was governed by equations known to accurately represent the real-world conditions of traffic. For lane changing, they integrated a framework that allowed a car to switch lanes if that resulted in the car getting closer to its programmed speed.
Before they introduced hacking into the experiment, they validated the set-up by running simulations on a three-lane road using varying speeds and densities of cars; finding that the results matched observed patterns that emerge on real-world roads. Then, they ran simulations to see what behaviours would emerge as different fractions of cars simply stopped moving as a result of a widespread hack, targeting the cars at random.
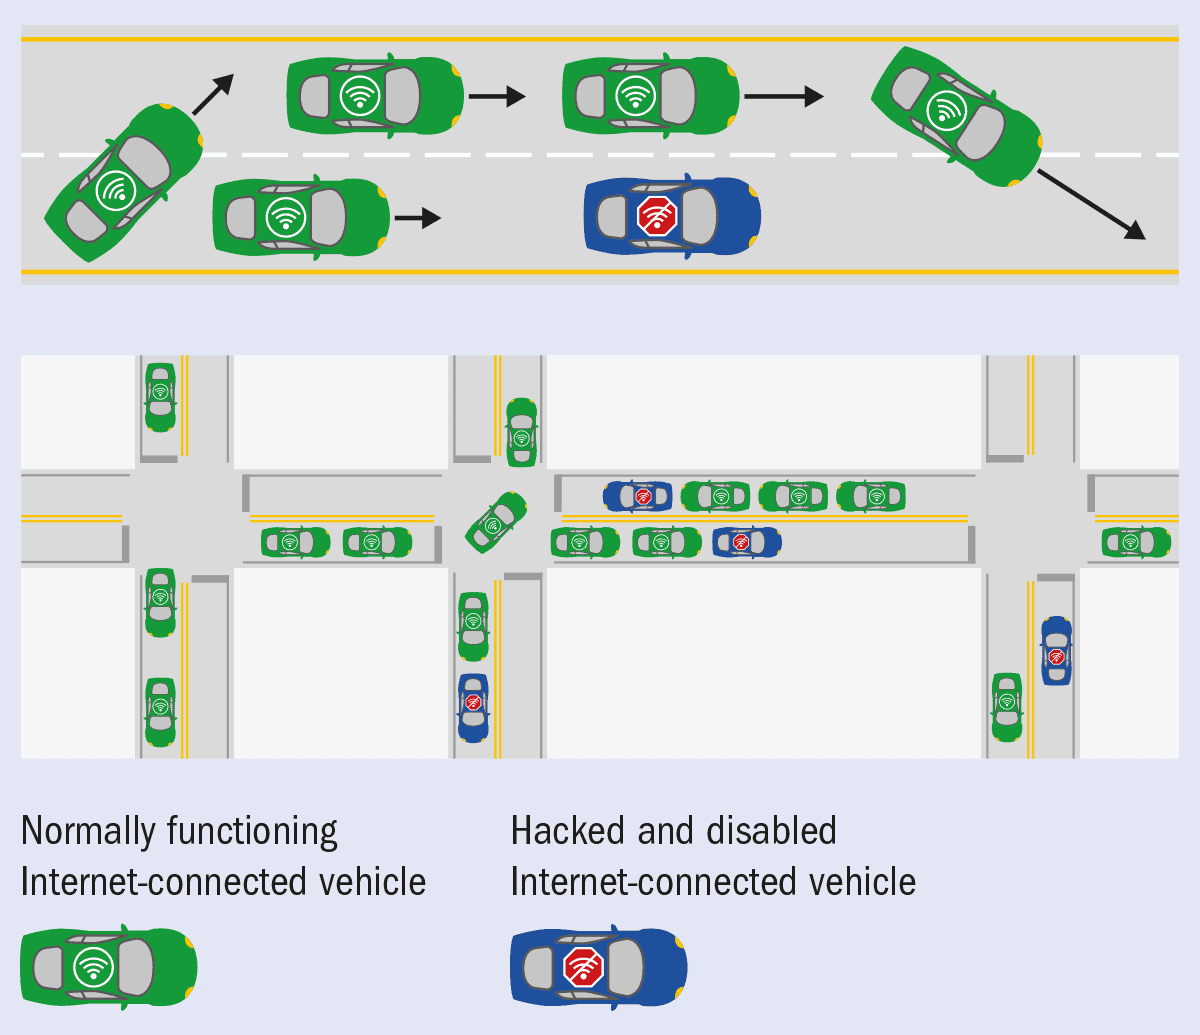
1 Percolated congestion When an Internet-connected vehicle is disabled (blue) other vehicles must navigate around the obstacle. If multiple vehicles are disabled simultaneously it can quickly disrupt traffic flow on a whole network of roads. (Phys. Rev. E100 012316)
In their initial analysis, the researchers tried to determine what would happen if connected cars were all disabled at the same time. In classical models of flow, at least two phenomena lead to congestion. One is clogging, where a small number of particles might stop moving but interactions with other particles produce a gradual slow-down. (In traffic, this can be seen when a car breaks down near the side of the road.) It’s a phenomenon of movement. The other is percolation, a geometrical phenomenon in which some large block simply prohibits motion all at once.
Vivek and his colleagues found that if only 10–20% of cars stop moving during rush hour, half of Manhattan would come to a standstill. The disruption was more like percolation – sudden and geometric – than like clogging. Vivek says the sudden blockage would not only inconvenience drivers; emergency services like fire engines, ambulances and police cars wouldn’tget through either. Most of the scenarios he’s studied, in fact, ultimately lead to a situation where hacked cars stop moving and become major traffic obstacles (figure 1).
His team has continued to run more complicated simulations, like tracking how the effects – even of smaller numbers of hacked cars – change over time. “What we’re finding now is a little more complicated,” he says. “We already knew that just a few vehicles can cause a traffic jam. But now we see that a much lower percentage can cause a significant effect. Even with just 5% of cars hacked, a five-by-five grid could be gridlocked within 15 minutes.”
But he’s also expanded his work to find efficient interventions that could reduce the risk or quickly remedy a hacked-car scenario. For example, Vivek and his collaborators have found that if connected cars in an area don’t all connect to the same network, and instead connect to smaller, more localized networks, then the work of a would-be hacker would increase dramatically.
Spotting a hack
A hack can take many forms, and Vivek says experts likely haven’t found them all. A car with an infected computer might share malware or a virus with another connected car via Bluetooth, wireless or a cell phone connection. Or it might hack the manufacturer’s computer, since connected cars (self-driving or not) regularly download software updates and patches. A hacker might use a centrally located hotspot – which cars use to connect to the Internet – to breach many cars at once. And as with personal devices, malicious software can be unknowingly invited to a car by someone who downloads an unsecured app from the car’s browser.
Parkinson says there’s another risk just waiting to be exploited. For the most part, the people who buy and drive cars with self-driving technology simply don’t understand how they work, which means they won’t recognize the warning signs if something’s gone wrong. “We need to help users understand what normal behaviour looks like,” he says. Over the last few decades computer and mobile-phone users have learned to recognize situations when their devices or data may be compromised – the same thing needs to happen for drivers, Parkinson explains, because in the wrong hands a car becomes a weapon. “The driver may not have time to react to a hack,” he says. And because they open up new surfaces of attack, technologies designed to improve the experience can actually make it more dangerous. He compares the advent of these cars to the introduction of autopilot features in aeroplanes.
“We actually gave pilots more things to be responsible for,” he continues. “They really have to understand the system and be able to take control.” But that’s a high hurdle to expect from every buyer and user of an autonomous car. “Computers understand the code and translate inputs to outputs, but computer code is not optimized for humans to read.”
Meanwhile, benevolent hacks of autonomous cars continue to pile up. Keen Security Lab, which is owned by the Chinese technology giant Tencent, remotely took over a Tesla Model S in 2017 and a Tesla Model X in 2018. In March 2020 the company announced it had also uploaded malicious code into the computer of a Lexus NX300. The 2020 Pwn2Own competition was supposed to include an automotive hack event, but it was scrapped when the conference went online because of the COVID-19 pandemic.
As cars approach autonomy, says Vivek, risks will multiply. Some experts predict that nearly 750,000 autonomous-ready cars will hit the roads in the year 2023, which means they’ll be vulnerable to attack. That represents, by some estimates, more than two-thirds of cars on the road, riddled with attack surfaces both known and not. “If it can be hacked,” says Vivek, “it will be hacked.”
Hack the hack
If you have an autonomous car, here are six ways to lower the hacking risk.
Change your password. The simplest fix might be the most powerful. In April 2019 a hacker called L&M reported a successful hack of GPS tracking apps in tens of thousands of cars and was consequently able to turn the cars off. The hacker’s secret? They used the default password – in this case “123456” – which the users never changed.
Deploy lots of small networks. Physicist Skanda Vivek from Georgia Gwinnett College in the US has shown that if a hacker can break into the network used by connected cars in a city, they can cause gridlock. The risk could be mitigated if cities installed many small networks instead of one big one, so that one hack wouldn’t wreak so much havoc.
Update your software. Drivers can lower their own risk of hacking by using the latest software, which should include patches for all known vulnerabilities.
Make security a priority. App developers have long followed the directive to “Release it now, fix it later,” but that needs to stop, says Simon Parkinson at the University of Huddersfield. Car companies should insist that whoever is designing the app focus on security – and making the apps hack-proof – before they’re ever installed in a car.
Turn off GPS. GPS spoofing is a kind of attack where someone uses a radio signal to interfere with a GPS location system. Until military-grade protections come on the market, the only way to protect against this hack is to use GPS sparingly. Results of a GPS spoofing experiment, released last year, showed that a hacker brought an autonomous vehicle to a halt by convincing the on-board GPS that the car had arrived at its destination.
Get to know your self-driving car. People with ordinary cars can tell when something’s gone wrong, but autonomous vehicles are different. They run on algorithms and software, and malfunctions may be more difficult to see. Self-driving car users should get to know their cars – and find ways to flag problems before they become dangerous.
A theory of quantum gravity that describes the universe as beginning in a “Big Bounce” rather than a Big Bang has succeeded in explaining several anomalies in the cosmic microwave background (CMB) radiation.
Loop quantum gravity (LQG) is an alternative to string theory, and describes space itself as being quantized at the smallest scales, known as the Planck length, about 10–35 m. According to LQG, space cannot be crushed down any smaller than this, and the application of LQG to the broader Universe is known as loop quantum cosmology (LQC).
In standard Big Bang cosmology, were we to run the history of the universe backwards so that it collapses rather than expands, the universe would contract into an unknowable singularity. However, in LQC, the collapsing universe would stop collapsing at the Planck length, and then rebound. This suggests that if LQC is correct, there was no Big Bang singularity, but a Big Bounce resulting from the collapse of a previous universe.
Anomalous features
Now, new research by a team led by Abhay Ashtekar at Pennsylvania State University, has found that LQC can explain several anomalies in the CMB that have eluded explanation by other theories. The research is described in Physical Review Letters and the team includes Penn State’s Brajesh Gupt and Donghui Jeong, as well as Vijayakumar Sreenath of the National Institute of Technology Karnataka in India.
The work addresses two anomalies. One relates to the CMB’s power spectrum, which plots the tiny temperature variations in the CMB against their angular size. The other anomaly studied related to lensing amplitude, which is the degree by which the CMB light has been gravitationally lensed as it has travelled through the universe. Lensing is a result of the distribution and density of matter it passes through, which in turn is related to quantum fluctuations that rippled through the very early universe, prior to inflation.
If LQC is correct, then the Big Bounce should have influenced the properties of the CMB. In particular, LQC describes how, at the moment of the Big Bounce, the curvature of space-time was greater than at any other point in cosmic history.
“Loop quantum cosmology predicts a specific value for the curvature at the bounce,” Ashtekar tells Physics World. “This value is critical to get what we are seeing, namely that there are certain modifications of inflation, precisely at these large angular scales, that come from the specific nature of loop quantum cosmology.”
Imprint of the Big Bounce
The large curvature of space at the Big Bounce imprints specific fluctuations in the CMB that are of a wavelength far greater than the size of the visible universe, and so we cannot directly detect them. However, they also correlate with smaller wavelength modes that have a discernible effect on the CMB, in the form of the apparent anomalies that the Big Bang model cannot adequately explain.
There are six fundamental parameters that determine what we see when we look back at the CMB. Two of these parameters are primordial, relating to the end of inflation, and their values influence the power spectrum of the CMB. Two more relate to the time between the end of inflation, when the universe was about 10–32 s old, and the moment that the CMB light was emitted, some 379,000 years later. The final two parameters describe what happens between the time the CMB was emitted, and now. Although the Standard Model of Big Bang cosmology is able to determine values for these parameters, LQC modifies their values in such a way that the anomalies come naturally tumbling out of the data as products of the imprint of that extreme curvature at the Big Bounce.
“It’s pretty amazing that with these six parameters, cosmologists are able to predict what we see today,” says Ashtekar.
A third anomaly is a hemispherical one – the two hemispheres of the CMB have different average energies. Work by Ivan Agullo, of Louisiana State University, has already been able to address this anomaly in similar fashion, within the constraints of LQC. Agullo describes the work of Ashtekar’s group as “fantastic,” adding that “It proves that physical processes occurring in the remote past, before the inflationary epoch, can leave observable imprints in the sky.”
A fourth anomaly – the tension between measurements of the Hubble constant depending on whether you calculate it based on the CMB or via more local standard candles such as Type Ia supernovae – still awaits an explanation. However, Ashtekar points out that work by Alejandro Perez of Aix–Marseille University in France is taking the first steps at using LQC to solve this.
A few years ago, the physicists Olga Goulko, Damián Pitalúa-García and Adrian Kent proposed the grasshopper problem. Think of a grasshopper that hops a fixed distance in a random direction. If the grasshopper begins at a random position on a lawn, which shape of lawn has the highest probability of retaining the grasshopper?
It turns out that the answer is not a circle or other simple shape, but rather a rich variety of different shapes at different jump sizes. What is more, the work provides useful insight into Bell-type inequalities relating probabilities of the spin states of two separated quantum-entangled particles.
Now, Goulko and Kent have teamed-up with Dmitry Chistikov and Mike Paterson at the University of Warwick to look at the grasshopper problem on a sphere. Again, they found that a variety of shapes emerged as solutions depending on hopping distance. A Bloch sphere is a geometrical representation of the state space of a single quantum bit – so, once again the research provided insights into entangled particles.
Polymer coating
Humans have been making red bricks for thousands of years, but Julio D’Arcy and colleagues at Washington University in St. Louis are probably the first to think of using the near-ubiquitous building material to store electrical energy. By coating the bricks with a conducting polymer, they created a supercapacitor. To demonstrate their device, they used it to power a LED. The team suggests that walls of brick supercapacitors could be used to store energy.
The game of jail dodgeball involves players on two teams throwing balls at each other. When a player is hit, they leave the court of play and move to an adjacent “jail” area. Jailed players can re-join the game if they catch a ball that has been thrown out of play. A team wins when all their opponents are in jail.
Now, Perrin Ruth and Juan Restrepo of the University of Colorado at Boulder have studied the game as a complex system using several mathematical techniques. Writing in a preprint on arXiv, they say their analysis reveals a “rich landscape with different game dynamics occurring depending on the strategies used by the teams, which can in some cases be mapped to scenarios in competitive species models”. Ruth and Restrepo also say that they have used mathematics to “construct a strategy to increase the probability of winning”. I am looking forward to testing this out when our Scout troop can meet again – dodgeball is one of our favourite games.
A new mechanism that could reduce plasma turbulence in stellarators has been identified in computer simulations done by researchers in the US and Germany. A similar effect has already been predicted to occur in tokamaks, which like stellarators, confine hot plasmas using magnetic fields.
A plasma is an extremely hot state of matter in which electrons and ions are no longer bound together. The Sun is a dense plasma where nuclei have enough energy to undergo fusion, unleashing huge amounts of energy. Physicists have long dreamed of achieving controlled fusion on Earth because it would be a source of clean energy.
Stellarators are promising candidates for fusion reactors because they could potentially maintain plasmas for up to 30 min, while tokamaks work in a pulsed regime (10 s pulses on the ASDEX Upgrade tokamak in Garching, Germany). However, turbulent transport – which causes the loss of both plasma particles and energy – can be an obstacle to maintaining confinement.
Turbulence-stabilizing effect
In 2018, Alessandro Di Siena and his co-workers at the Max Plank Institute for Plasma Physics in Garching discovered a new turbulence-stabilizing effect for tokamaks by doing computer simulations of plasmas. The effect involves a resonant interaction between suprathermal (fast) ions – generated via ion-cyclotron-resonance-frequency (ICRF) heating – and turbulence-driving micro-instabilities. For this resonance to occur, according to the analytic model they derived, the frequency of the most unstable, turbulence-driving mode must match the drift frequency of the energetic particles, imposing a constraint over the fast ions’ temperature. At the same time, whether this effect is stabilizing or destabilizing on the turbulence depends on the relative magnitude of temperature and density gradients (the first must be higher than the latter).
Di Siena is now at the University of Texas at Austin and has done this recent stellerator work with team members Alejandro Bañón Navarro, and Frank Jenko in Garching. They performed nonlinear gyrokinetic simulations to study how this mechanism can be used to stabilize the Wendelstein 7-X (W7-X) stellerator at the Max Plank Institute for Plasma Physics in Greifswald. While W7-X does not have an ICRF heating source yet, these latest predictions may help guide the design of the ICRF antenna at the facility.
Exciting results
“We are very excited about these results, and we hope they will help in the design and construction of the ICRF heating system in W7-X,” says Di Siena. “According to our predictions, this resonance mechanism might lead to new advanced scenarios with improved plasma confinement. The next step would be to confirm our findings in stellarator experiments”.
The simulations reveal that, in a plasma with a similar gradients and frequency matching, a dependency exists between turbulence stabilization and the temperature of the fast ions. Therefore, at a given value of temperature, turbulent transport reaches a plateau at lower turbulence levels. This behaviour is dissimilar from what they had previously reported for tokamaks, where a minimum value could be reached at a specific fast-ion temperature.
The distinction derives from differences in the intrinsic designs of the two devices: the tokamak’s magnetic configuration is axisymmetric and can be described at each position via a single magnetic field line. In contrast, the stellarator’s magnetic geometry is more complex and must be defined by multiple field lines. This latest work shows that for each magnetic field line, there is different temperature where turbulence is minimized, explaining the plateau as the combination of all the field line dependencies.
The complicate geometry of stellarator magnets allows researchers to explore many artificial magnetic configurations that could maximize this stabilizing effect. The researchers looked at hundreds of possible geometries for the most unstable field line and described an optimized condition where the turbulent transport could be minimized.
“This work is certainly theoretically interesting, and could be experimentally relevant in plasmas in which a substantial fraction of the thermal energy resides in fast ions,” says Per Helander, head of the Stellarator Theory Department in Greifswald. “Under these conditions, one could experimentally test this theoretical insight, and such a test would shed valuable light on our understanding of turbulence in fusion plasmas. Whether the effect is actually important in the burning plasma of a fusion power plant is another question, and will depend on the operational regime.”
The research is described in a paper that has been accepted for publication in Physical Review Letters.
Evidence-based enthusiast Sasha Sagan on science, traditions and what makes us human. (Courtesy: Brian C Seitz)
Most readers of Physics World will be familiar with the works of astronomer Carl Sagan, and the writer and producer Ann Druyan. The husband and wife duo worked together to write, produce and present the seminal 1980s TV series Cosmos, which was, and still is, one of the most watched and beloved science TV productions ever made. Despite its broad-ranging coverage of many scientific subjects, Cosmos was successful thanks to the perspective it offered to viewers. It deftly showed us – the Pale Blue Dot – our place in the universe.
Indeed, Sagan and Druyan’s productions were celebrated for their art as much as they were lauded for science communication. Following in their footsteps, daughter Sasha Sagan has now penned her first book, For Small Creatures Such As We: Rituals and Reflections for Finding Wonder, in which she attempts to unravel the meaning of life, via the many rituals that we attach to big moments of change in our lives. Where her parents looked to the stars for inspiration, Sasha Sagan’s gaze is more squarely on the human condition. Can those with a secular world-view learn from the rituals mainly practised by those of the different faiths around the world? Sagan, who was herself raised in a secular home, finds that science is at the root of many ritual celebrations in cultures across the globe.
For Small Creatures Such As We explores these rituals and practices we humans punctuate our lives with. From major life events such as births, marriages and deaths, to the more mundane such as eating, sex and atonement (those two are not necessarily linked), the book considers how someone with a secular worldview might find the same solace and celebration without the trappings of religion. Sasha Sagan’s love for her parents, and the inspiration she takes from them, is evident throughout, with the title itself drawn from their writing. Families play a large part in most of life’s events, in one way or another, and Sagan’s writing turns the lens on her own experience as much as it draws from cultures around the world.
Topics include death, fasting, feasting, the seasons, plus weekly and monthly rituals. Sagan’s tone is personal and amusing, as she shares stories that are intimate, open and honest. While she considers many practices from around the world, it is the individual who receives most focus: the personal benefits and pitfalls. It’s clear that the death of her father and the birth of her daughter have played a large part in inspiring Sagan to wonder how people who have no religion might learn from those who do. Learning is not always about how to do something but, on occasion, how not to. There is humour in some of the culturally strange practices, but Sagan writes with neither malice nor judgement. No worldview is presented as worse or better than another – except where that worldview leads to actual and clear damage to human beings.
Considering the burial rituals of people from Vietnam to Madagascar, from the Amazon to the Great Lakes, Sagan turns her thoughts to the funeral of her father, who died in 1998 aged 62. As a 14-year-old in the middle of grief, she tried to shut down her feelings to an extent, to keep the emotions at bay. Writing about the birth of her daughter, Sagan looks back through the lens that life and research into distant communities has given her. She wishes she had let herself experience those feelings in full at the time. It is an emotional passage in a book that, as a whole, deftly navigates weighty topics with humour and a real sense of understanding.
Standing on the shoulders of giants can be a help as much as a hindrance. Without skill, you run the risk of filling your work with clichés. Sagan avoids this adeptly and her writing is imbued with a passion equal to that of her parents. The book sits somewhere between a memoir and an exploration of social history. There is anthropology, science and the human experience. I was left with the feeling that I will turn to it again, for inspiration or reference, and For Small Creatures Such as We now sits on my shelf as a handbook.
In an interview for my podcast TheCosmic Shed, I asked Sagan about her book, and her parents’ legacy.
What was your inspiration for the book?
My parents raised me with awe and wonder for the universe as revealed by science. As a secular home, we had some traditions carried on from our ancestors. The philosophy was wonderful: it fulfilled some deep philosophical and intellectual needs. But what it lacks is celebrations, holidays and rites of passage. I became very interested in that sort of thing. I lost my dad when I was 14, and the question of how you grieve and mourn without the infrastructure of religion became very central to my life. I began researching celebrations and rituals and all sorts of ways that human beings mark change and the passage of time.
I found an astonishing thing, which is that much of what we do is the same around the world. When you peel back the specifics of time and space, when you take away the set design and the script and the elements of theatre, the actual cause for celebration – the changing of the seasons, the equinoxes, solstices, and biological changes like coming of age – these are all scientific events. My book is an exploration of that, and I try to light-heartedly explore some big questions such as science, religion and death but with a little humour in there.
The book considers “rituals and reflections for finding wonder” – tell me a bit more about that
In the recent history of human beings, religion and science have veered apart – we have this sense that the two are opposed. My mother calls it Post-Copernican Stress Disorder. The rituals and rites of passage and these huge moments in our lives; the framework for marking them is often religious. I think that, if you go back far enough, science – in the sense of following the evidence to understand where we are, what we are doing, how things work, how the seasons change, when the crops come, what the animals are doing, what the stars are doing – and the feeling of being part of something grander than ourselves…I think those things are deeply connected and they can be and should be.
We malign facts as “cold and hard” and we have this idea that when we understand something deeply, it takes away the “magic” of it. I think that it is the opposite. I think that the more deeply we study something and understand it, that’s a way of honouring it and celebrating it. We can all have that excitement about the elements of existence we’re curious about and want to understand, if we get this idea that there is beauty and awe and wonder in the way things really are. It’s so powerful.
Change is constant and we live on a planet where nothing stays the same. There are cyclical changes like the seasons and there are permanent changes like birth and death. It is really hard to wrap our minds around them, to process them and come to terms with them. We don’t have to look at life through a religious lens to know that when it is cold and dark, we need to party! We need delicious food and to all come together to get through the time when the days are really short. I think that many of the celebrations that we have created, around the world, are just ways of processing change and whether you believe or not, you still have to process those changes.
Sasha Sagan with her parents Carl Sagan and Ann Druyan. (Courtesy: Sasha Sagan)
One of the biggest changes is the loss of a parent. A lot of people, even those without a strong faith, might find themselves turning to that faith for solace. Can you tell me about that for you?
When I lost my dad he had been sick on and off for two years but I just didn’t think he was really in mortal peril until the last few days. Maybe because I was naive, being so young, or I was in denial, or because my mother is a very optimistic and positive person. I took a really long time to wrap my head around what had happened. I think if you are brought up with faith and then you leave it, there can be a tendency to think, “this is what I can go back to in a difficult time” but because I wasn’t really brought up with it I don’t think that way.
My family is Jewish: we celebrate Jewish holidays, if I take a DNA test it says “you are Jewish”, but not in a theological sense. In the funeral there were some things that we did for my father, for my grandparents, that fit into the religious framework because it’s a recipe for how to deal with things in a situation. But I think that is something different from belief. Everyone has to navigate those traditions for themselves and I think there’s some value in having an idea about what to do when you are really stressed in that moment of grief – where it’s almost happening in slow motion and you’re not really experiencing it in your true self.
The message that I got from my parents about loss and death was that this does not go on forever – that what we are experiencing right now is very hard and painful, but it does go away. In fact, in some way that is what makes this moment so special. There are also other things that are amazing, if you take a step back. I literally carry on my father, thanks to a secret code in my blood that connects me to him, and all these ancestors I didn’t know. When my daughter was born, he lives on in her too, which is so magical. If only genetics was presented as this magical thing, instead of just worksheets you get in seventh grade. My parents wrote a beautiful passage about the written word being a magic trick – a way that someone who has been dead for a thousand years can talk to you inside your head. These things can seem almost supernatural, but require no faith and they give me a lot of solace.
You’ve been a TV producer and are now an author. That certainly follows in your parents’ footsteps but there is one thing that seems to be missing. Did you not want to become a scientist?
I think there may be a word missing from the English language because science is my passion and my worldview. I think of it like this – not every Catholic is a priest. It’s not my job. It wasn’t my strongest subject in school; I was much more of a history and literature person. It is something I read about a lot and it is a source of great inspiration. But I wish there was a word that means my philosophy is evidence-based and science is the lens through which I see the world. If someone says “Do you believe in X, Y or Z?” I often say “My position is I withhold belief without evidence.” I wish someone would invent a word for that philosophy: “I’m not saying there is not a ghost in your attic. I’m just saying that until I have evidence, I will not say I believe in something.”
Is that not scepticism?
Well, scepticism does not have a very friendly connotation. I want this imaginary word to have a joyful enthusiasm about that which is supported by evidence.
OK. I’m going to call it Saganism.
Well, it’s catchy. I’ll give you that.
It sounds a bit like paganism, which is difficult.
Not to mention Satanism [laughs]. I don’t want to get mixed up with that.