Novel microscopy techniques find needles in ‘big data’ haystacks

Most of you are probably familiar with at least some of the “big data” involved in biomedical research. In the decade and a half since the Human Genome Project mapped the sequence of the three billion or so nucleotide base pairs in human DNA, datasets in the study of genomics (both human and other organisms) have expanded into the terabyte regime. These datasets are often handled by specialist “bioinformaticians” – the job title alluding to the central role of maths and informatics it entails – rather than by the biomedical specialists themselves.

In recent years, a variety of imaging methods have joined bioinformatics in the big data era. An ever-expanding panoply of imaging modalities, including various flavours of light microscopy, electron microscopy, X-ray microscopy, imaging mass cytometry and others, are now being put to work on biomedical problems. With these new techniques come new data challenges, including cases where data is produced faster than a standard hard drive can write, and the large-volume, high-resolution images from a single experiment can take up many terabytes of storage. This has created a need for instrument scientists like me, who specialize in developing custom systems and techniques, for times when the one-size-fits-all commercial solutions can’t cope with the data onslaught.

The evolution of biomedical microscopy

When the likes of Robert Hooke and Antonie van Leeuwenhoek began experimenting with biological samples and light microscopes in the 17th century, their “imaging process” consisted of hand-drawing the sample as they saw it through their home-made scopes. Modern technologies such as lasers and digital cameras have made the imaging process far more automated, while advances in light microscopy have greatly expanded the range of structures that can be imaged. One of the most important recent advances has been the ability to label structures of interest with fluorescent markers. For example, green fluorescent protein – a substance that was originally cloned from a jellyfish, and which won its discoverers the 2008 Nobel Prize for Chemistry – allows scientists to “tag” objects of interest so that they shine like a beacon when illuminated with a particular wavelength of light. This provides functional information about the sample, and multiple different objects (such as subcellular organelles or virus particles), can be tagged with different colours within the same sample.

A 3D reconstruction of a HeLa cell.

There are, however, limits to what even the most advanced light microscopes can see. The Rayleigh criterion (or the similar Abbe limit more commonly used in biology) states that two objects cannot be resolved if they are separated by less than around half of the wavelength of the light – around 200 nm for typical experiments. Since many important biological structures and molecules are much smaller than this, we must turn to other methods to probe them. One solution is the family of “super-resolution” fluorescent techniques, such as stimulated emission depletion (STED) and single molecule localization (the subject of the 2014 Nobel Prize for Chemistry). Another is electron microscopy, where the short de Broglie wavelength of electron beams gives a much higher resolution than visible-light microscopy. This reveals the ultrastructure of the sample in exquisite detail, but without the functionally specific labelling we can achieve with fluorescence microscopy.

Another drawback of electron microscopy is that traditionally, it has been a relatively low-throughput method, with extensive and time-consuming sample preparation required for each 2D snapshot. For example, slicing a sample into sections thin enough for an electron beam to pass through them, as occurs in transmission electron microscopy (TEM), involves embedding soft biological materials in a hard substance such as resin. This allows the sample to be sliced into sections around 100 nm thick using a device called an ultramicrotome. These sections are then collected on a tiny metal grid and loaded into the microscope.

Newer electron microscopy techniques, in contrast, incorporate a cutting mechanism into the vacuum chamber of the microscope itself. In these systems, the sample’s surface is imaged with a scanning electron microscope (SEM). Next, a tiny sliver is shaved off to reveal a new surface a few nanometres deeper. The cutting mechanism can be either a diamond knife (in a serial block face scanning electron microscope – SBF SEM) or a beam of high-energy ions (in a focused ion beam scanning electron microscope – FIB SEM), as shown in the image at the beginning of this article. Repeating this process automatically can produce terabytes of dense 3D image data per day. For example, the reconstruction of a single HeLa cell shown in the image above was created from data in the terabyte regime captured in a FIB SEM system at a scale of 5 nm per pixel. High levels of precision, however, do not come quickly: this single image took a few days to create.

Analysing the data

Many of the analysis tasks we perform fall broadly into the “finding a needle in a haystack” category. Often, when we acquire data from a sample containing many cells, only one or a few are exhibiting a behaviour or structure of interest. An example might be a rare event such as the transient initial interaction and fusion of cells that creates blood vessels (2009 PLOS One 4 e7716). This process is of particular interest because cancerous tumours sometimes co-opt the formation of new blood vessels in order to grow. For practical purposes, when studying such events, it is often necessary to image a relatively large region of tissue to ensure the structure of interest is captured in full. However, this leaves us with the problem of finding the cell of interest amongst the sea of its much more abundant, but less relevant, neighbours.

In general, EM image analysis has been stubbornly resistant to automated computational processing. Consequently, it is often done manually, with a researcher sifting through the images and tracing around different structures (a process called “segmentation”) to ascertain which of the many similar looking cells are the ones to be studied. This takes a huge amount of time – frequently many times longer to analyse the images than to acquire them.
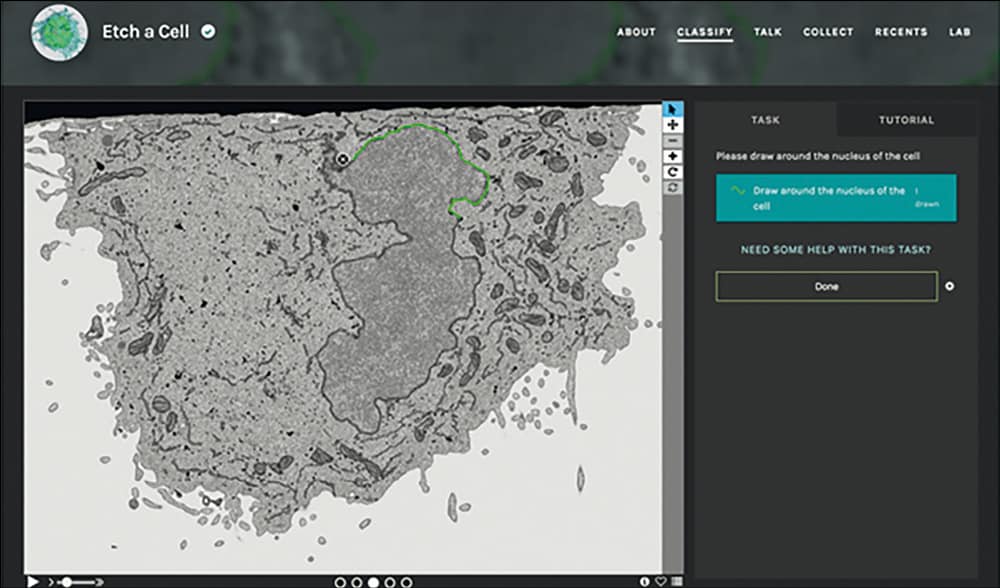
Screen capture of the Etch a Cell web interface.

If this problem sounds familiar, it’s probably because physicists have been dealing with similar data gluts for years. Particle physicists and astronomers, in particular, are well versed in data reduction techniques, which help to ensure that uninteresting data does not unnecessarily trouble the processors of the computers doing the analysis. In biomedical imaging, we can perform similar tricks. For example, we can combine the benefits of fluorescence microscopy (functional localization) and electron microscopy (ultrastructural resolution) into a hybrid known as correlative light and electron microscopy (CLEM). By using fluorescent labels to highlight the objects of interest, we can determine which regions we should image at high resolution in the electron microscope. This can be performed at different stages of the process, either before preparation for electron imaging, or after resin embedding by using new “in-resin fluorescence” methods.

To make use of this additional information, our group at the Francis Crick Institute in London has developed custom miniature microscopes that allow us to image these fluorescent regions (2016 Wellcome Open Res. 1 26). The first microscope (now commercialized by RMC Boeckeler) attaches to the ultramicrotome to allow us to monitor the cutting process and collect only the slices of the sample that contain the fluorescent signal, thus limiting the number of slices that we need to load into the microscope for imaging. The second is a tiny device (less than 3 mm in diameter) that fits inside the SBF SEM and can monitor the fluorescent signal after each tiny sliver is removed. This allows us to identify which areas contain fluorescently tagged objects so that we only image those regions of interest, maximizing the useful information content of the data. These methods can drastically reduce both the data footprint, saving money on storage costs, and the associated complexity of the analysis, saving time.

Sometimes, of course, big data is unavoidable. It is not always possible to prepare samples in a form that is amenable for effective CLEM imaging, so there are times when we still have to deal with large amounts of data using brute-force processing. In these situations, manual annotation of the data is still the gold standard, and thus usually the preferred method, but the laborious nature of the work means that data is analysed much more slowly than it is acquired.

Sharing the load

For certain structures, however, it is possible for a person with limited biological knowledge to be trained to recognize and trace over the desired objects where even the best computational methods struggle. This class of “human easy – computer hard” image processing problem is not unique to biology. Astronomers began applying “citizen science” methods to such problems in 2007, calling upon members of the public to help them classify their mountains of telescope images using a web-based project called Galaxy Zoo. This project has since grown into a platform called The Zooniverse that hosts many other citizen-science efforts – including one called Etch a Cell, which we built to enlist the public’s help with some of our segmentation tasks, tracing around the nuclear envelope in their web browser, as shown above. By aggregating the contributions from several citizen scientists for each slice of the data, we can construct annotations that are as accurate as ones performed by experts.

Of course, no discussion of big data is complete without mentioning machine learning, and this is certainly another area seeing rapid growth in biomedical imaging. Many deep-learning methods are well suited to image-analysis problems such as object detection and segmentation. Indeed, technologies like self-driving cars and robotics make extensive use of very similar image-processing methods. Several variants of supervised convolutional neural network architectures have proved very successful in automating biomedical image analysis.

There is, however, a bottleneck on the road to handing image-analysis tasks over to machines, and that is the “ground truth” data that are used to train them. Such data normally take the form of manual annotations, created by experts. Given the complexity of the images, we generally need enormous amounts of this training data to achieve good results, often much more than is readily available from experts. The aggregated annotations from our citizen scientists give us the dataset we need to train our system robustly on a wide range of images. Once well trained, a deep-learning system can produce image segmentations quickly. In principle, it could even be used to guide the electron microscope on-the-fly, so that it records only the interesting regions of images, even in the absence of a fluorescent beacon.

The principle behind all this work can probably be summed up with the old adage “Work smarter, not harder”. By viewing the big data problem beyond its purely computational aspects – that is, by combining new sample preparation techniques with custom-built hardware, in addition to new computational pipelines – we can reduce the effort and resources required for finding the needle in a haystack and significantly minimize both the strain on computational infrastructure and the analytical burden on researchers. Remember, the first rule of Big Data Club is, “Try not to get big data!”


Simulation of eight million ‘mock universes’ sheds light on galaxy evolution

New insights into mechanisms that govern the formation of stars in galaxies have been gleaned by Peter Behroozi at the University of Arizona and colleagues in the US. This was done using the team’s UniverseMachine simulation framework, which generates millions of mock universes that evolve according to different rules of star formation. By comparing these universes to observations of the real thing, the scientists can work out which rules are correct.

Many of the mechanisms underlying galaxy formation and evolution remain shrouded in mystery. Astronomers now widely believe that important mechanisms are governed by the characteristics of dark matter haloes – huge gravitationally-bound structures that are believed to envelop galaxies including the Milky Way. While this framework has provided some important insights into galaxy formation, no theories yet exist for explaining how galaxies form and evolve from first principles. To uncover the relevant processes, astronomers use two types of model: semi-analytic models, which incorporate known physics; and empirical models with constraints based on astronomical observations.

As the two types of model have improved over the years, they have yielded increasingly similar results. There are still significant disagreements, however, particularly those related to processes that inhibit star formation in galaxies. Semi-analytic models predict that in older galaxies, the energy radiated from bright objects such as supernovae and supermassive black holes heat interstellar hydrogen, preventing it from collapsing under gravity to form new stars. Observations, however, show that star formation rates (SFRs) in such galaxies are generally far higher than heating would allow.

Mysterious correlation

To mimic these astronomical observations, empirical models incorporate a theoretical correlation between the SFR in a galaxy and properties of its dark matter halo. In their study, Behroozi’s team aimed to determine the physics mechanisms underlying this correlation using a simulation.

Their model is dubbed UniverseMachine and it first generates a “mock universe” of 12 million galaxies. An educated guess is made at how SFRs might depend on halo mass, assembly history, and galaxy age. After running the simulation from the early universe to the present day, an algorithm compares the resulting SFRs to observations. This comparison is then used to determine more accurate input values for the next mock universe. This cycle was then repeated, until the full range of SFRs, as measured in real observations, had been sampled.

Following two weeks of calculation on the University of Arizona’s Ocelote supercomputer, during which over 8 million mock universes were generated, Behroozi and colleagues uncovered a variety of new insights into star formation mechanisms. Among other discoveries, they concluded that the correlation between star formation and halo properties is indeed strong, but not perfect. In addition, the average fraction of interstellar hydrogen not forming stars decreases with age, which suggests that the heating of the gas is not solely responsible for preventing star formation.

These discoveries could now allow astronomers to draw new theories about the properties of star formation, enabling them to update semi-analytic models. In the future, Behroozi’s team now hope to expand UniverseMachine to explore other aspects of galaxy formation and evolution, including the diverse morphologies of individual galaxies.

The research is described in Monthly Notices of the Royal Astronomical Society.

Can decelerated breathing confer health benefits?

Regulation of breathing, for example using pranayama breathing techniques applied in yoga and meditation, is associated with various health benefits. German researchers have investigated the link between body rhythms and slow cortical brain dynamics during paced breathing and found a prominent synchronous influence of a 10 s breathing rhythm on heart rate variability. The study revealed the relationship between breathing rhythm, heart rate and slow cortical potentials (SCP) of the brain, and supports future research into the effect of breathing on mental health (J. Breath Res. 10.1088/1752-7163/ab20b2).

The research team, from the Universitätsklinikum Regensburg, examined the effects of SCPs – slow shifts in cortical electrical activity at frequencies below 1 Hz – as influenced by five different breathing rhythms. Prior research has demonstrated that SCPs are strongly task-related, with positive SCPs leading to decreased cortical excitation and negative SCPs supporting neuronal activation.

“Demonstrating the relationship between SCPs and breathing rhythms in detail is of the highest interest, as the self-regulation of SCPs is targeted in neurofeedback approaches and used to control brain–computer interfaces,” the authors explain.

Principal investigator Thilo Hinterberger and colleagues in the Department of Psychosomatic Medicine enrolled 37 volunteers, 14 of whom were experienced in meditation, to participate in paced breathing sessions.

The breathing session included 5 min of breathing normally in a comfortable sitting position. After this baseline data collection, the individuals performed six, 7 min long, task sequences with 6, 8, 10, 12, 14 and 6 s breathing cycles. Instructions for inhalations and exhalations that mimicked natural breathing patterns were illustrated visually on a monitor.

Participants were asked to subjectively rate each breathing rhythm with regards to its naturalness, “goodness” of feeling and arousal during a 3 min long period of relaxation between each recorded breathing cycle.

Upon completion of the final 6 s breathing task, included to account for a possible sequence effect of the task, participants were asked to breathe normally while opening and closing their right hands in a 10 s rhythm. The authors explained that this was done to control the influence of general task execution on the brain response.

The researchers measured heart rate variability and SCP data from a 64-channel electroencephalogram (EEG), as well as respiratory signals recorded from a belt surrounding the chest. Breathing-related heart rate variability and event-rate SCP were calculated by averaging all breathing cycles of all participants separately for each breathing rhythm.

Both heart rate variability and SCP spectrograms showed that each paced breathing task elicited a sharp frequency response at the corresponding breathing frequency. While breathing depth increased only slightly in slower breathing rates, heart rate variability and SCP curves showed strong increases at slower breathing rates.

The highest resonant peak in amplitude as measured by both heart rate variability and the SCPs of the brain occurred at the 10 s breathing rhythm (six breaths per minute), the major novel finding of the study, according to the authors.

“The finding that there is a high maximum resonance in SCPs when breathing with six cycles per minute indicates that this decelerated breathing rhythm induces a strong resonance of SCP, heart rate variability and the metabolic baroreflex, the fastest mechanism to regulate acute blood pressure changes,” Hinterberger told Physics World. “Subjectively, decelerated breathing is reported to have a relaxing and positive effect.”

“One question for future research is how this SCP resonance interacts with brain processes that control feelings of wellbeing,” he added. “We assume that the electrocortical SCPs might be connected to metabolic changes. However, there might be several subcortical structures involved which are related to emotional states of consciousness. This will be a subject of future research.”

Unique climate change has no natural cause

European and US scientists have cleared up a point that has been nagging away at climate science for decades: not only is the planet warming faster than at any time in the last 2000 years, but this unique climate change really does have neither a historic precedent nor a natural cause.

Other historic changes – the so-called Medieval Warm Period and then the “Little Ice Age” that marked the 17th to the 19th centuries – were not global. The only period in which the world’s climate has changed, everywhere and at the same time, is right now.

And other shifts in the past, marked by advancing Alpine glaciers and sustained droughts in Africa, could be pinned down to a flurry of violent volcanic activity.

The present sustained, ubiquitous warming is unique in that it can be coupled directly with the Industrial Revolution, the clearing of the forests, population growth and profligate use of fossil fuels.

The finding is part of a sustained examination of global climate history, based not just on written and pictorial records but also studies of ancient lake sediments, ice cores, tree rings and other proxy evidence assembled by an international partnership called the Past Global Changes Consortium. It is reported in the journal Nature.

This paper should finally stop climate change deniers claiming that the recent observed coherent global warming is part of a natural climate cycle

Research like this is a tidying-up operation. Climate scientists, conservationists, glaciologists, marine biologists, geologists and economists all know that climate change is happening, and that it is happening as a consequence of accelerated human activity over the last two centuries.

But from the start, there have always been gnawing questions: hasn’t the climate always changed? If global temperatures rose between 700 AD and 1400 AD, and then fell again, is what is happening now not part of some similar long-term cycle? And until now, that has remained without a confident, categorical answer.

So the latest study surprises nobody. But it matters, because the Nature study clarifies a point of possible confusion. There have been changes in modern human history, but none of them global and synchronous (happening at the same time). They were random fluctuations within the climate system, and even changes in solar activity or volcanic surges could not affect all of the planet at any one time.

“It’s true that during the Little Ice Age it was generally colder across the whole world,” says Raphel Neukom of the University of Bern in Switzerland, and first author, “but not everywhere at the same time. The peak periods of pre-industrial warm and cold periods occurred at different times in different places.”

And his Bern colleague Stefan Brönnimann clears up another point in a related study in the pages of Nature Geoscience.

Volcanic influence

The Little Ice Age began in Europe with no obvious trigger, but it was certainly reinforced and extended by more violent than usual volcanic activity in the tropics between 1808 and 1835. Mt Tambora in what is now Indonesia put so much ash into the stratosphere to screen sunlight and drop temperatures that 1816 became known as the Year without a Summer.

But there were also four other eruptions. Between 1820 and 1850, Alpine glaciers – now in alarming retreat – actually advanced. African and Indian monsoon systems weakened, and rain that should have fallen on hot soils dropped as more snow over Europe.

“Given the large climatic changes seen in the early 19th century, it is difficult to define a pre-industrial climate, a notion to which all our climate targets refer,” said Professor Brönnimann. “Frequent volcanic eruptions caused an actual gear shift in the global climate system.”

Commenting on the Nature finding, Mark Maslin, a climatologist at University College London, said: “Over the last 2000 years the only time the global climate has changed synchronically has been in the last 150 years when over 98% of the surface of the planet has warmed. This paper should finally stop climate change deniers claiming that the recent observed coherent global warming is part of a natural climate cycle.

“This paper shows the truly stark difference between regional and localised changes in climates of the past and the truly global effect of anthropogenic greenhouse emissions.”

Happy 30th birthday to CERN’s Large Electron–Positron collider, a shed-load of knowledge about the composition of the universe

Before CERN had the Large Hadron Collider (LHC), that famous tunnel under France and Switzerland was home to the Large Electron–Positron collider (LEP). It was switched on 30 years ago in 1989. and the above video shows how the 27 km long tunnel was created in what is surely an engineering marvel of the 20th century.

The LHC will run for a few more decades but the big question is whether an even larger 100 km collider will be built at CERN in the future?

Alan Bernau runs Alan’s Factory Outlet in Luray, Virginia – supplying garages, carports and sheds. But he and his colleagues also have a keen interest in science and they have created a fantastic infographic about the composition of the universe that you can view on the company’s website.

It is called “The abundance of stuff in the universe” and Bernau told us: “It explores how much dark matter and dark energy make up the universe, as well as the elements that make up the small amount of matter scientists are able to see and study. We had a lot of fun putting it together and are proud of how it turned out.”

Other infographics made by the team include “The melting points of 80 elements, substances, and metal alloys” and “Artificial objects that humankind has left on extra-terrestrial surfaces“.

Is it time to get serious about the placenta?

© AuntMinnieEurope.com

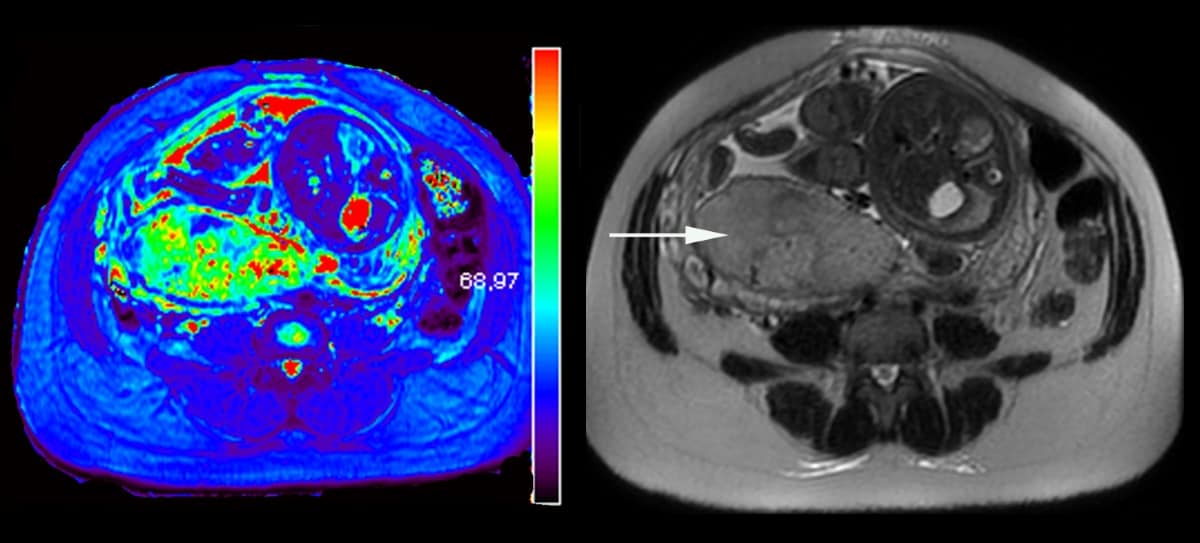
Significant advances are occurring in placental MRI – particularly the development of texture analysis, machine learning and radiomic approaches – and the time is now ripe for systematic and detailed MRI scans of the placenta in pregnancy, a leading French expert believes.

“Understanding how the placenta works is one of the major challenges facing radiologists, given the crucial role of this organ in foetal development,” noted Nathalie Siauve, director of Diagnostic Radiologie Explorations Fonctionnelles Anatomopathologie Médecine Nucléaire (DREAM) at the Assistance Publique-Hôpitaux de Paris (AP-HP) Nord at the University of Paris.

Because radiologists now play a central role in detecting birth defects, adjusting clinical management and establishing the prognosis of affected pregnancies, they must be aware of the new methods for evaluating the placenta so they can alert clinicians rapidly in cases of suspected abnormalities and facilitate appropriate timely management of the mother and the foetus, she wrote in a guest editorial posted online on 7 August by European Radiology (Eur. Radiol. 10.1007/s00330-019-06373-8).

“This organ plays a regulatory role extending well beyond nutrition and respiration, also encompassing the endocrine and immune system regulations,” Siauve pointed out. “As a signalling organ, the placenta produces a myriad of bioactive molecules affecting both maternal and foetal metabolisms and physiologies.”

Assessing placental oxygenation

The development and maturation of the placenta during pregnancy is relatively unknown, and it’s time to harness modern approaches and technologies and to develop new ones to shed light on placental structure, development, and function in real-time, she emphasized. This is a priority of the US National Institute of Child Health and Human Development’s Human Placenta Project.

Historically, placental MRI was seen as a complementary problem-solving tool for placental evaluation, and it was much less common than foetal MRI, Siauve explained. However, placental abnormalities are of considerable clinical significance, due to their association with high rates of foetal morbidity and mortality, and placenta previa, placental adherence abnormalities, and placental insufficiency are key defects here.

“MRI has recognized added value for the management of placental adherence abnormalities, which requires a multidisciplinary team approach,” she continued. “The early detection of placental adherence abnormalities is of crucial importance for determining the most appropriate surgical management technique and preventing haemorrhage during the delivery.”

Novel perspectives

New avenues are opening up for MRI studies of the placenta. For instance, the early screening of women with a high risk of developing placental insufficiency by texture analysis may become feasible in the near future. Researchers have described textural changes in vivo in the placenta on MRI, in healthy and high-risk foetuses, and in the setting of placental insufficiency, they have demonstrated large differences in placental development relating to the onset and severity of foetal growth retardation and neonatal outcome, according to Siauve.

Texture analysis provides quantitative evaluation of heterogeneity through the quantification of grey-level patterns and pixel interrelationships within an image, and the textural features for each image are extracted from several matrices, she added. Therefore, machine learning and artificial intelligence identify the most relevant textural features and can be used to construct an optimal model to facilitate diagnosis.

Such an approach is particularly suitable for analyses of the placenta, which is known to be heterogeneous, Siauve wrote. This heterogeneity increases significantly with foetal aging during gestation, through both cotyledon maturation and other aging-associated processes, such as fibrin accumulation and calcification.

“Intensity heterogeneity is an emerging MRI marker of placental invasion. However, the reading of the images is subjective and this heterogeneity is difficult for human readers to quantify,” she stated. “Texture analysis could be used for quantitative image analysis to assess placental heterogeneity. Machine-learning analysis with MRI-derived texture analysis features is a potentially feasible tool for the identification of placental tissue abnormalities underlying placental adherence abnormalities.”

  • This article was originally published on AuntMinnieEurope.com ©2019 by AuntMinnieEurope.com. Any copying, republication or redistribution of AuntMinnieEurope.com content is expressly prohibited without the prior written consent of AuntMinnieEurope.com.

Smartphone market pulls VCSELs into the mainstream

Vertical cavity surface-emitting lasers, or VCSELs (pronounced “vixels”), were invented in the late 1970s and have since made their way into consumer devices such as computer mice and laser printers. Now, however, rocketing demand for 3D image sensing is pushing VCSELs into new territory, with applications emerging in smartphones, autonomous vehicles and more. Ajit Paranjpe is a senior vice president and chief technology officer at Veeco, a US-based maker of equipment used for thin-film manufacturing processes in the hi-tech electronics sector. He spoke to Physics World about these new applications and the demands they place on manufacturers.

How do you make a VCSEL?

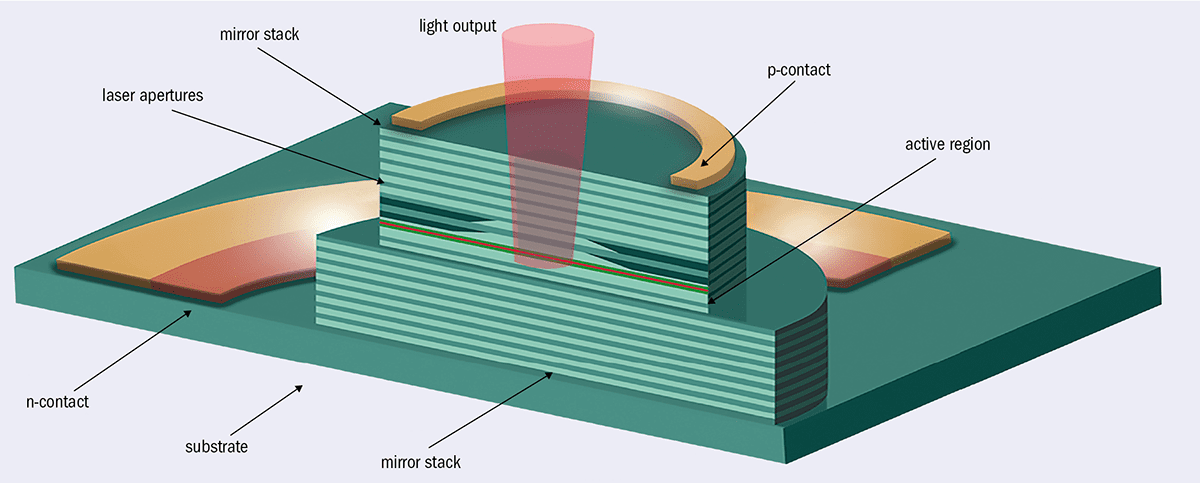
Most VCSEL production is in the infrared regime, typically between 850–940 nm for 3D sensing and slightly longer wavelengths for other applications. The production process begins by growing an epitaxial stack consisting of multiple layers of a compound semiconductor material such as gallium arsenide. Then you etch the device to define its dimensions (especially in the emitting region), oxidize part of the surface to define the laser aperture, and passivate – that is, protect against damage – the side walls. Finally, you do another etch to define the overall device size and make a contact on the negative or n-side of the device, which could be either the top or the back side. The light is emitted from the p-side of the VCSEL (see diagram below).

The individual steps in making a VCSEL – etching, deposition, and so on – are very similar to silicon chip manufacturing. However, the overall process is extremely simple in comparison, and the post-assembly steps are a lot more straightforward than for edge-emitting lasers. Because of the way they’re manufactured, VCSELs can easily be packaged into arrays, with hundreds of emitting regions on a single chip. That’s much more difficult to do with edge-emitting lasers.

Ajit Paranjpe

If they’re relatively simple to make, why haven’t we seen more of them?

Until recently the applications – including 3D sensing, as well as active optical interconnects in the telecoms sector – were all relatively low-volume. What’s happened of late is that 3D sensing has emerged as a big trend in smartphones, starting with the front-facing image-recognition camera on Apple’s iPhone X. We’ve also heard that manufacturers of Android phones are poised to enter the market with similar capabilities.

The moment you enter the smartphone market, the volumes become enormous. You’re talking about millions of units, potentially going to a billion units over time. That requires a completely different approach to manufacturing. For example, when you go from small semiconductor wafers to larger wafers, controlling wafer defects becomes much more important. VCSEL manufacturers are starting to adopt the practices of silicon fabs to make these devices in volume.

Why are VCSELs so well-suited for 3D sensing?

Traditionally, people have used LEDs for 3D sensing, but because light from an LED isn’t collimated there are limits to its effectiveness. With a laser, you get a collimated beam with a very narrow linewidth, and you can use multiple beams to map a surface. The device used on the iPhone X, for example, is called a dot projector, and it uses an array of VCSEL apertures on a chip to project a pattern of infrared laser light onto the object to be observed. That pattern is then recorded, and 3D information is created from the pattern in the form of a mesh. The whole process is extremely fast, and because the light is infrared it’s not intrusive. These attributes are significant benefits compared to alternatives such as cameras. Even if you use two cameras stereoscopically to create 3D information, you don’t get the spatial resolution you get with a VCSEL array.

The structure of a vertical cavity surface emitting laser.

What are the challenges of making VCSELs for this application?

The performance of the device is largely set by the epitaxial growth step, and the main thing you’re trying to achieve is extremely good wavelength control. You want to make sure that all the apertures are emitting uniformly, because if the object you’re trying to image is in bright sunlight, you have to apply a filter on your detector to distinguish between the sunlight and the light that’s being projected by the VCSEL array. The narrower you can make the filter, the more you can eliminate the ambient light. Today, a typical bandpass filter lets in a range of maybe 20–30 nm, and certain applications, such as LiDAR, need an even narrower range to be able to discriminate between signal and noise for objects that are far away. That’s the reason for tight wavelength control. Otherwise you’re wasting photons.

Another challenge, which I mentioned earlier, is controlling defects on the chip. This was less of an issue when chips were smaller and you could just throw away the ones that didn’t work, but if you have a large-area chip and all the apertures have to work for the chip to function, you have to make sure the defect rate is very low.

One source of defects on semiconductor wafers is the epitaxial growth process itself. You need good control of the material’s composition, so that you don’t get defects due to lattice strain between the semiconductor layers. Another source of defects is the parasitic deposition during the growth process. This can accumulate on the walls of the reactor, and if they flake off and fall onto the wafer, that’s a problem. At Veeco, we’ve improved our reactor design to make sure there’s no accumulation of unwanted material above the plane of the wafer.

Where do you see VCSELs being used in the future?

The next area, after smartphones, will be in automobiles, and there are two applications that people are working on in that sector. One is using cameras combined with VCSEL technology for in-cabin monitoring, keeping track of the driver or occupants within the car. The other is LiDAR. Autonomous cars need to “know” what’s around them, and LiDAR can do that, but today’s units are expensive, bulky and mounted on top of the car. They’re not aesthetically pleasing. It would be nice to replace them with an array of less obtrusive, cheaper sensors – the aim is below $100 per unit – that can map everything around the car and enable it to reach higher levels of autonomy. Level 5 autonomy, where a human driver never has to intervene, may not happen, but even at lower levels of autonomy, more sensors would improve safety.

The third application is in data communications. People are trying to push data speeds in optical fibres up to 50 gigabits per second, and VCSELs may help because better wavelength control means you can pack more wavelengths into a single fibre.

Overall, though, I like to make a comparison between VCSELs and light-emitting diodes. LEDs used to be a niche market too, until they got introduced as backlights in cell phones and TVs, and then into solid-state lighting. That was enabled by improvements in LED manufacturing, and particularly by better control of the epitaxial growth step. We think the same thing could happen in VCSELs, and that some of the technology we provide could bring similar benefits to VCSEL manufacturing as the industry positions itself for the next big ramp-up in production.

Wearable patches could ‘decode’ sweat

A new scalable, high-throughput fabrication process that makes use of roll-to-roll printing and laser cutting can produce wearable sweat sensors rapidly and reliably and on a large scale. The devices, which can almost instantly detect and analyse electrolytes, metabolites and other biomolecules contained in sweat, could be employed in real-world applications and not just as laboratory prototypes.

Analysing sweat is a non-invasive way to monitor a range of biomolecules, from small electrolytes to metabolites and hormones and larger proteins that come from deeper in the body. Indeed, sweat sensing has already been used to medically diagnose diseases like cystic fibrosis and autonomic neuropathy and to assess fluid and electrolyte balance in endurance athletes.

Traditional sweat sensors collect sweat from the body at different times and then analyse it. This means that the devices can’t be used to detect real-time changes in sweat composition – during physical activity, for example, or to monitor glucose levels in diabetic patients. Wearable sensors, which make use of flexible and hybrid electronics, overcome this problem by allowing for in-situ sweat measurements with real-time feedback. However, it is still difficult to reliably make sweat sensor components (including microfluidic chip and sensing electrodes) in large quantities and with good reproducibility.

Roll-to-roll rotary screen printing and laser ablation

A team led by Ali Javey at the University of California, Berkeley, has now developed a technique to rapidly fabricate sweat-sensing patches using a roll-to-roll (R2R) rotary screen printing process and laser ablation.

R2R is promising for high-throughput and cost-effective fabrication of flexible electronics while laser ablation allows for rapid materials patterning at small scales and is useful for engraving microfluidic channels into flexible substrates, say the researchers. “By combining R2R rotary screen printing of sensing electronics with laser cutting of microfluidic channels, we can make a wearable patch that might be mass produced in high yields,” says team member Mallika Bariya. “This scalability is essential for enabling fundamental studies on large populations with many subjects and multiple devices used per subject.”

New wearable sensors

The researchers made their device by first screen printing conducting and insulating inks onto a plastic substrate to define and protect the sensing electrodes. They then laser cut a second plastic substrate to define a spiralling microfluidic channel. “Further plastic layers are similarly patterned to create cover sheets to enclose the channel and create an inlet and outlet for sweat to enter and leave the device,” explains Bariya. “The layers have an adhesive coated on one side so that they can ultimately be stacked together to create the device.”

Versatile wearing

The patch can be attached anywhere on the body to locally measure sweat – for example, during exercise, she tells Physics World. The sensor has an inlet well where sweat first accumulates. Sensing electrodes within this well can detect the levels of sodium ions (Na+), potassium ions (K+), glucose and other analytes contained in this sweat. The sweat continues to flow into the spiralling channels of the device, where two further nested electrodes measure sweat rate.

Once testing is complete, the patch can be peeled off and discarded.

Functionalized electrodes

To demonstrate that the patch can support high-performance electrochemical sensors, the researchers functionalized the electrodes with Na+, Kand glucose sensors. They calibrated each in standard solutions that mimic the physiological sweat concentration range of each of the analytes.

For example, a Nasensor was tested in 15 to 120 mM sodium chloride (NaCl) solutions and found to be stable throughout the measurement period with a sensitivity of 56.2 mV/decade. This value is similar to sensors made by conventional lithography-based techniques and is close to the so-called Nernstian ideal.

In the same way, the Ksensor has a sensitivity of 51.3 mV/decade in 5 to 40 mM potassium chloride (KCl) solutions and the glucose sensor a sensitivity of 1.0 nA/mM with a linear response over the tested analyte concentration range of 50 to 200 mM.

Testing the device

The researchers tested their device by placing it on different areas of the body of volunteers while they pedalled on an exercise bike and measuring their sweat rates and the sodium and potassium levels in their sweat. They found that local sweat rates at certain body sites could potentially indicate when someone is becoming dehydrated. Being able to perform such measurements could be important for athletes since maintaining fluid/electrolyte balance is essential for healthy vital functions.

“Using these wearable patches, we can now continuously collect data from different parts of the body to understand how local sweat loss can estimate whole-body fluid loss,” explains team member Hnin Yin Yin Nyein.

Glucose testing in healthy subjects and diabetics

The UC Berkeley team also used the sensors to compare fasting sweat glucose levels and blood glucose levels in healthy and diabetic cohorts. “We found that a single sweat glucose measurement cannot necessarily replace a finger-stick blood glucose test for indicating whether someone may be healthy, pre-diabetic or diabetic,” says Bariya. “More personalized correlations between an individual’s sweat and blood glucose levels may be possible, however, with further longitudinal testing that take a variety of factors, including age, body mass, diet, and hydration status into account.”

As well as being useful for athletes for monitoring electrolyte and fluid loss to inform training and therapy, the patch might also be used in medical diagnosis or to monitor diseases in which sweat is known to provide useful insights, say the researchers. “Importantly, it could be employed in more advanced large-scale population studies targeting other athletic/medical conditions and biomarkers to probe the clinically or physiologically important information contained in sweat,” explains Bariya. “These studies will help us to continue ‘decoding’ sweat composition.”

The patch is detailed in Science Advances 10.1126/sciadv.aaw9906.

Simple tweak reprogrammes DNA-responsive hydrogel smart materials

Art piece showing CRISPR enzymes

Hydrogels harness water to respond to biological and environmental conditions. They are widely used in tissue engineering, biosensors and therapeutics.

“There has been increasing interest in designing “smart”, materials that can respond to useful cues in their environment and change their properties in a pre-defined, useful way,” explains James J Collins, a professor at Massachusetts Institute of Technology (MIT) in the US, and a researcher at both MIT and Harvard University’s Broad Institute and Harvard’s Wyss Institute.

DNA-responsive hydrogels have brought a whole new level of specificity to hydrogel responsivity, but so far this has come at the cost of the hydrogel’s versatility. Each time researchers want a hydrogel that responds to a new trigger, they have to redesign the molecular make-up of the whole gel. Now researchers at Massachusetts Institute of Technology (MIT) and Harvard University in the US, led by Collins have identified a tweak to a single RNA component that can produce hydrogels triggered by a vast range of specific molecules with various customizable responses.

How hydrogels work

Hydrogels are a family of materials comprising networks of hydrophilic polymer chains. Crosslinks in the polymers make the hydrogel solid and the hydrophilic properties of the polymer chains mean they are highly absorbent – their water content can reach 90%.

When strands of DNA are incorporated into the hydrogels, interactions with a target molecule can cause a displacement of a DNA strand or a change in the crosslinkers, which then affects their mechanical properties flagging up the presence of the target molecule. However, when researchers change the nucleic acid components to produce a hydrogel that will respond to a new molecular cue, this generally leads to unintended modifications of the DNA structure so that the whole hydrogel needs redesigning. In addition, high concentrations of the target molecule are usually needed to trigger a response in the hydrogel.

“We set out to develop a platform that would be easy for the user to re-purpose towards different input signals while having a rapid response time and high sensitivity,” Collins tells Physics World.

Tailored in a tweak

The MIT and Harvard collaborators adopt an approach that hinges on a type of enzyme that has already found wide use for gene editing and nucleic acid diagnostic applications known as “CRISPR-Cas” enzymes (where CRISPR stands for clustered regularly interspaced short palindromic repeats and Cas stands for CRISPR-associated). These enzymes are capable of cleaving DNA under the governing hand of “CRISPR guide RNA” (gRNA), and it is this gRNA that scientists can tweak to reprogram the CRISPR-Cas enzymes.

“This is one of the most appealing aspects of CRISPR technologies: producing new guide RNAs with user-defined sequences is simple for research and industry, and these in turn control the target specificity of the enzyme,” says Collins. Now for the first time, Collins and his team demonstrate that these advantages can be applied to produce user-friendly reprogrammable environmentally responsive hydrogel materials.

Multimodal smart materials

The researchers focused on Cas12a-gRNA, the gRNA from the Cas enzyme of a certain type of bacteria that governs DNA cleaving for a specific double-stranded DNA sequence. However this initial highly specific cleaving is followed by indiscriminate single stranded cleaving. As a result, once this initial double strand is cleaved, single strands that support the integrity of the hydrogel structure are severed soon after. This indiscriminate collateral cleaving after the initial specific double-stranded DNA cleaving serves to amplify the hydrogel response.

“The guide [gRNA] is necessary and sufficient to define the target specificity irrespective of the enzymatic activity of the Cas protein,” explains Max English, also at MIT and the leading author on the report of the work. “We decided to use the Cas12a enzyme because of its useful enzymatic properties.”

Limiting the change needed for different cues to just the gRNA, allows the researchers great versatility in the design of the rest of the hydrogel. They were able to produce hydrogels actuated by different DNA triggers that led to nanoparticle or chemical release. They also demonstrated the response on a hydrogel functionalized with carbon black, commonly used to confer conducting properties on polymers – as the hydrogel structure disintegrated, the material lost its conductivity giving the response of an electrical fuse. They used the absorbency of the hydrogel to control flow through a microfluidic system to detect gRNA modified to detect MRSA double-stranded DNA or Ebola virus RNA at clinically relevant concentrations, as the single strand crosslinkers cleave and visibly release water flow.

Collins highlights the motivation to use materials that could couple CRISPR sensors and diagnostics to electronic readouts, which “overcomes the costly and complex instrumentation required for fluorescent readouts and allows for circuit integration, and downstream signal processing and transmission”. He adds, “One exciting aspect of our work for other researchers wanting to use this platform is that the Cas12a is available as an off-the-shelf reagent and the guide RNAs are simple to design and synthesize.”

“I would say that the paper is an excellent example and step forward in the slow merge of two fields: chemical biology and (bio)materials,” says Paul Kouwer, a researcher at Radboud University in the Netherlands who also specializes in hydrogels although was not involved in this piece of research. “So far materials are often ‘static’; their properties are constant over the course of the experiment. With their CRISPR approach, the researchers provide a new tool for in situ modification. It is highly sensitive and extremely specific. Perfect for the future would be to couple the technique to approached that offer high spatial and temporal control.”

Full details are available in Science.

Social and economic goals should be set for communities displaced by climate change

As climate change threatens communities around the world, millions are faced with the prospect of relocating to safer areas. In most places, however, neither individuals nor governments are prepared for this “climate retreat”. In the face of this challenge, researchers in the US led by Anne Siders at Harvard University propose that climate retreat be used as way of achieving long-term social and economic goals. By shifting the current view of retreat as a failure to adapt to climate change, their analysis offers critical guidance to those who will be forced to relocate in the future.

In the coming decades, climate change is widely predicted to increase the intensity and frequency of extreme weather events, raise sea level, and threaten agriculture, among other threats. To many communities, these factors mean that relocation to less affected areas is now an ever-looming threat. In areas like Louisiana and Bangladesh where this is already happening, retreat is seen as a one-time action that ignores the many needs of communities. This could leave those affected worse off in the long term. Siders’ team proposes a shift from viewing retreat as a last-resort approach, and a failure to adapt to inevitable changes, to a strategic one, which maximizes social, economic and environmental benefits.

Siders and colleagues call on communities, governments and research institutions to use scientific data to draw up strategies to identify which communities need to retreat. When relocation should occur, and where people will go, should also be agreed well in advance. When the time comes, these strategies will allow communities and governments to ensure that a retreat can run smoothly, while minimizing negative impacts. The goal, says the team, should be to develop context-appropriate strategies that accommodate for specific community needs, including employment, cohesion of close knit-groups, and sensitivity to indigenous cultures.

Systems overhaul

Furthermore, Siders and colleagues propose an overhaul of financial and legal systems, which currently complicate the retreat process by incentivizing communities to remain living in risk-prone areas. To do this, they suggest streamlining financial and legal bureaucracies to allow different departments to work more efficiently with each other and with communities. With the right approach, the researchers suggest that retreat can be incorporated into toolsets for achieving positive outcomes for the socioeconomic development of communities, helping them to thrive after relocation.

Siders’ team acknowledges that no matter what approach is taken, climate retreat will be difficult to achieve effectively, and will require a willingness among communities to engage with a new, experimental approach to relocation. Ultimately, the scope and scale of retreat can only grow in the coming decades, but with strategic, managed approaches to relocation, the prospects of many global communities could become far more positive.

The proposal is described in Science.

Copyright © 2026 by IOP Publishing Ltd and individual contributors