“We need to get better at doing more with less,” Ed Lester, a professor at Nottingham University and technical director of the spin-out company Promethean Particles told attendees at the Advanced Material Show at Telford International Centre in the UK last week. Promethean Particles opened up the world’s largest nanoparticle plant in 2016, its vast production capacity enabled by continuous online liquid product formulation, which has efficiency advantages over the synthesis of dry nanoparticles mostly for later dispersion in a liquid. As the self-styled “McDonald’s of manufacture” for fast nanoparticle synthesis Promethean Particles may not be the first place you would look for an advocate of an abstemious approach in the materials industry, but Lester was far from alone in voicing concerns over sustainability.
Waste less
Less waste often means lower costs so that environmental interests aside, efficiency savings have an inherent attraction. In terms of less waste in production of materials, and nanomaterials in particular, real-time monitoring can make a real difference. In the past manufacturers have sent samples from batches away for product-control sizing measurements, but finding out at the end of a batch that the sizing is off can write off large quantities of product already made.
Sam Barton, a service engineer from Xoptix described how laser-diffraction particle sizing can help. “Laser measuring is simple,” he told Physics World, adding that although these sizing measurements have traditionally used a whole benchful of optics, the set-up can be much more compact. The Xoptix equipment can fit in a large brief case, and installed alongside the production system it can steer samples of the product away for testing and back into the production apparatus to take measurements in real-time and flag up any problems. Other companies at the show including as Malvern Panalytical are also now promoting inline and in situ measurements.
Thin advantages
Nanomaterials may also contribute to minimizing the toll on the planet’s material resources on account of their enhanced properties, which often allow product designers to make layers thinner while still matching or improving on the performance offered by incumbent materials. While thin layers with electronic and optoelectronic functionality are making waves in potential flexible devices and roll to roll printing for low-cost manufacture, applications exploiting mechanical properties can benefit too.
The Graphene Engineering and Innovation Centre (GEIC) in Manchester plans to pilot a graphene-enhanced road near the centre. “The road isn’t ours to lay,” GEIC Chief Executive James Baker told Physics World, emphasising that the project is in its infancy at present. However conversations with the council are promising and the project also now benefits from six months of data for analysis from a graphene-enhanced road laid side by side a conventional road in Rome. The hope is that incorporating graphene could help towards thinner more durable layers of materials. “The big benefit comes if you can de-ice it,” added Baker, highlighting the challenge of rapid fluctuations between warm and freezing temperatures from day to day in the UK that leads to water freezing and expanding in cracks to form potholes.
This is not carbon
While environmental benefits may feel good for the manufacturer, it’s the attraction they hold for the consumer that makes or breaks the business case. “People won’t pay for green,” Christian Fischer CEO and co-founder of Bcomp told attendees. Bcomp produces automobile materials based on flax, a plant commonly grown anyway as a rotation crop in agriculture. The flax-based material now has a strong offering in the world of motor-racing, where traditionally 50% of the car volume is plastic. However convincing people that there was a place for these alternative more sustainable materials in the sector was far from simple. “Guys my customers just aren’t ready for this brown chalet chic Swiss kind of look – they want carbon,” was the initial response. However, by focusing on light-weighting, a goal shared by any other high-performance automobile manufacturer, Bcomp were able to present a product that could sufficiently outperform incumbent materials to grab notice, with the added bonus of great green credentials.
Re-use, recycle
Bcomp offers alternative to plastics for some applications, but the permanence and prevalence of plastic pollution is an issue all industries need to tackle. As Sally Beken from the Knowledge Transfer Network, who heads the recently established UK Circular Plastics Network told attendees, “It’s not a bad material, the problem is our poor husbandry of it.” Part of the challenge in retrieving and recycling plastic has been the lack of standardization and a proliferation of different plastics each requiring different treatments. For certain plastics established recycling schemes and infrastructure are helping to reposition the material among the more environmentally benign. Government incentives encouraging the use of recycled plastics mean that recycled PET, for example, commands a higher purchase price than the originally produced material. In contrast “biodegradable” plastics can still cause problems if they end up in the ocean, as degradation takes significantly longer at the colder temperatures there.
Design for manufacturing; design for recyclability - Fernando Castro, National Physical Laboratory
Ambitions for recycling have even risen to the lofty heights of space projects, the most braggadocious being the reusable rocket aspirations of SpaceX. A lot can go wrong when sending a rocket into space so again monitoring and real-time measurements are key. Nanmac supplies SpaceX and various other clients with thermocouples for temperature monitoring. The key materials challenge for thermocouples monitoring the extremely high temperatures of rocket launch is the sheath, which needs to protect the instrument from degradation while still letting the temperature through. As a company that span out from Nasa 65 years ago, Nanmac has ample experience in handling the extremes of space missions, but for SpaceX they have now mastered the additional requirement allowing the thermocouples to be re-used.
“Design for manufacture; design for recyclability,” urged Fernando Castro, Head of Materials Science and Engineering at the UK’s National Physical Laboratory, during a session on nanoelectronic materials – design and development. “Because further down the road it becomes much more costly.” The advice highlights a theme that pervaded the conference, that sustainability practicalities merit equal consideration with a material’s production, and that ultimately the long-term interests of materials companies and the long-term interests of the planet are unequivocally entangled.
There have been problems with curtailment of renewable energy outputs in China. Many of the country’s wind projects are in remote areas in the north-west, poorly served by grid links. They have sometimes been unable to dispatch their full potential output to users, most of whom are in the major urban areas on the south-east coast. Similar problems have faced some solar projects. Basically, the rush to deploy wind and photovoltaics (PV) overwhelmed the grid system.
One response has been to slow down the deployment rate of wind and PV while grid improvements were made. As I noted in an earlier post, new projects were halted in some areas and capacity caps and quotas imposed, that also being a response to a cost/subsidy overshoot problem caused by the very rapid deployment. The government was forced to suspend all new subsidized solar capacity approvals for a while, after a record 53 GW capacity increase in 2017 left it with a backlog of at least 120 billion yuan ($18 billion) in subsidy payments. So there was a big slowdown.
Necessary action
Clearly something had to be done about the cost overshoot and about curtailment, with a slowdown being an obvious first step. The PV curtailment rate across China had risen 50% in 2015 and 2016, with over 30% of available power in the north-west provinces Gansu and Xinjiang failing to reach the grid. Curtailment of surplus wind output had reached 20% in 2016 nationally and was much more in some remote locations with poor grid links – 43% in worst-case Gansu province. However, there has been progress. Curtailment fell to 33% in Gansu and 15% nationally in 2017. With the slowdown no doubt helping, efforts are now under way to get curtailment down to 30% in the worst locations, Gansu and Xinjiang, and to 20% in Jilin, Heilongjiang and Inner Mongolia. The expectation is that it could be completely eliminated in Heilongjiang, Jilin and Ningxia, while Inner Mongolia is expected to reduce it to below 5%.
In the meantime, the slowdown has helped with the subsidy overspend, as has the fall in cost of PV and wind. In January 2019, China’s National Reform and Development Commission (NRDC) reportedly said that solar construction costs in China had fallen 45% from 2012 to 2017, while wind project costs had dropped 20%. As a result, the subsidy system was being revamped, with some wind and PV projects able to go ahead subsidy-free. Some projects will still get subsidies but the NRDC said “the economic efficiency of projects has steadily increased, creating favourable conditions for state subsidies to retreat and pressures on subsidy funds to ease”.
It seems China’s renewable power capacity will continue to rise. Indeed, by the end of 2018, it had reached 728 GW, up 12% on the year before, according to the National Energy Administration (NEA), and representing 38.3% of China’s total installed power capacity. It included an extra 20 GW of wind and 44 GW of PV. Reuters said “China has tried to change the ‘rhythm’ of renewable power construction to give grid operators time to raise transmission capacity and ensure clean electricity generation is not wasted”. The NEA noted that overall rates of waste in the wind power sector had fallen to 7% in 2018, down five percentage points on the year before, although the major wind generation regions of Xinjiang and Gansu in the far northwest had still failed to get around a fifth of potential wind power onto the grid over the period. There is still a way to go.
More change please
Further improvements are clearly needed. However, looking at it optimistically, a recent report from the US Brookings Institution says “if renewable energy curtailments were to be resolved, then its share in meeting new electricity needs will raise from 37.8% to 63.4%. Similarly, it will increase its share of total electricity generation by 1.6% (from 26.4% to 28.0%)”.
In some ways it’s a little surprising that China has had these problems. With ostensibly high levels of central control China ought, you might think, to have more coherent energy system planning and regional grid co-ordination. However, the reality seems to be that what exists is what has been described as “fragmented authoritarianism”, with rival bureaucratic cliques having conflicting or at least confused jurisdictions. Not too dissimilar from elsewhere perhaps! Though as we have seen, it has had some unwelcome impacts on China’s renewable developments with, for example, edicts coming from central government about building more generation capacity but local regional agencies having responsibility for grids but not always being given the resources to meet them. Clearly, much more needs to be done in terms of national and local grid-strengthening, better project siting and systems design, as well as more integrated planning and institutional policy processes.
Meanwhile, in terms of grid upgrades, one central government priority has been to improve links to the giant 22.4 GW Three Gorges hydro project, which is in the middle of the eastern part of the country, some way from urban centres of power demand on the eastern and southern coast. A series of High Voltage Direct Current (HVDC) links has been built to East and South China, over distances of around 1,000 km, to transfer electricity from the hydro project, and presumably that will also help wind and solar projects in the area. In all, the total capacity of the HVDC links is 7200 MW, with line losses put at about 3%.
Supergrid spread
HVDC links are also being made further afield, from Liaoning, Tianjin and Shandong to Russia and Mongolia. That can help with balancing for China and maybe for other countries in Asia. Given its huge wind, solar and hydro resources, China may at times have some energy to spare for sale, as long as it improves its internal grids, yet at other times the nation may need some balancing inputs. For that, there is abundant wind potential available in Mongolia, where there are also plans for developing large-scale concentrating solar power (CSP) projects in the Gobi Desert. For example, excess power (1 GW’s worth) from the proposed Gobitec CSP project would be exported to urban centres in China, Japan and South Korea via a new network of nearly 4000 km of high-voltage direct current (HVDC) transmission lines.
That could see the creation of an Asian supergrid network, something that Japan in particular, being a series of islands with limited land area for renewable energy projects, may find very helpful. It could also provide useful balancing by linking up renewable inputs across a very wide area at, it is claimed, reasonable cost. As I noted in an earlier post, a variant of this idea, promoted by the Japanese Softbank Group and Japan’s Renewable Energy Institute (REI), is the so-called Golden Ring. Wind energy generated in Mongolia would be transmitted via China and South Korea to Japan, using HVDC links and undersea grid cables, and hydropower from Russia would also be delivered to Japan and other nations. Companies in each region have expressed interest.
That may be some way off but taking it one – big – step on, China has reportedly been looking seriously at the idea of a $50 trillion global grid. But first it must get its internal grids sorted. It is certainly trying with, as I noted earlier, vast cross-county HVDC supergrid links, of which 30,000 km has already been completed. The main aim of supergrid systems is to enhance trade but they would also aid balancing and could reduce the need for local curtailment. Though at a cost. In my next post I look at the somewhat heretical idea that we should accept curtailment since dealing with it will be too expensive.
The above is based in part on material in the new updated and expanded edition of my IOP book Renewables, out later this year.
A long-awaited German–Russian telescope to survey the X-ray sky in unprecedented detail was successfully launched from Kazakhstan’s Baikonur Cosmodrome on 13 July. The Spectrum-Roentgen-Gamma (Spektr-RG) mission is designed to detect 100,000 galactic clusters allowing astrophysicists to constrain the properties of dark matter and dark energy, and hence test models of the expansion of the universe.
Its enormous sensitivity will allow us to constrain cosmological parameters
Esra Bulbul
Spektr-RG consists of two instruments, one of which is eROSITA – an X-ray survey telescope designed and built by Germany’s Max Planck Institute for Extraterrestrial Physics (MPE) in Garching, which will operate at 0.2–10 keV. “It will provide a map of the entire sky in the 2–10 keV band for the first time,” says Esra Bulbul from the Harvard-Smithsonian Center for Astrophysics, who will become chair of MPE’s eROSITA cluster and cosmology team in September.
Bulbul says that the mission is about 30 times more sensitive than ROSAT — the previous all-sky survey X-ray telescope — in the soft X-ray band at 0.2–2 keV. “Its enormous sensitivity in that band will allow us to detect galactic clusters and constrain cosmological parameters,” she adds.
Backing up eROSITA is ART-XC — a Russian-built telescope that can detect X-rays at 6–30 keV. This will allow the mission to detect supermassive black holes at galactic centres as well as study the “3.5 keV emission line” that could be produced by the decay of dark-matter particles. “The distribution of the dark-matter candidate line within our galaxy will allow us to test the origin of this signal,” says Bulbul, who adds that eROSITA will also aim to investigate the “physical processes at play in large-scale structures” as well as “nail down the evolution of metals in our universe”, which are all “unreachable with the current X-ray telescopes”.
Data taking
Spektr-RG’s immediate destination is Lagrangian point 2 – a gravitational-balance point over a million kilometres beyond the Moon’s orbit where it will be free from temperature variations. According to Peter Predehl from the MPE, who is the mission’s principal investigator, the telescope will take about 100 days to reach that point after which it will orbit around it. Once there, the telescope will set out on its first full-sky survey, which should take about six months. It will then repeat the process and continue to do so, improving the resolution each time. “The only constraint is to keep it there for at least seven years with minimum fuel consumption,” says Predehl.
The past decade has witnessed the advent of modern immunotherapy. Monoclonal antibodies that target PD-1, PD-L1 and other immune checkpoints are now approved for treating a wide range of tumour types, including non-small cell lung cancer (NSCLC).
Alongside, advances in planning and delivery of high-dose radiotherapy have led to the acceptance of stereotactic ablative radiotherapy – also known as stereotactic body radiotherapy (SBRT) – as an effective primary treatment for early-stage NSCLC patients who are unsuitable for surgery.
There’s also a growing body of preclinical data describing the synergy between ablative radiotherapy and immunotherapy. This has led to a growing interest in discovering clinically effective combinations of the two treatments. However, the clinical promise of potentiating immunotherapy with ablative radiation or vice versa has so far remained largely unrealized.
Now, two newly published JAMA Oncology papers have demonstrated the potential of combining ablative radiotherapy with PD-1 checkpoint blockade in patients with NSCLC.
Alternative approaches
Researchers from the Abramson Cancer Center at the University of Pennsylvania have assessed the effect of treating metastatic NSCLC patients with the immunotherapy drug pembrolizumab following locally ablative therapy. They found that this combination almost tripled the median progression-free survival (PFS) compared with the historical average (JAMA Oncol. 10.1001/jamaoncol.2019.1449).
For this study, 45 NSCLC patients with four or fewer metastatic sites underwent locally ablative therapy (such as surgery or stereotactic radiotherapy) and then received pembrolizumab 4–12 weeks after therapy completion. The median PFS from the start of ablative therapy was 19.1 months, significantly greater than the historical median of 6.6 months. The median PFS from the start of pembrolizumab therapy was 18.7 months. Importantly, the treatment did not lead to any new safety issues or decreases in patient quality-of-life.
“Our understanding of which metastatic patients may benefit from curative therapies as opposed to palliative therapies is still evolving, but our data show promise that the addition of immunotherapy can bring make a difference,” says lead author Joshua Bauml.
The researchers note that the approach needs further study and that they are still evaluating the impact of this combination on overall survival. However, they point out that the accrual of 45 patients represents a significant number for a single site and shows that a larger, multicentre, randomized controlled trial to test this approach is feasible.
For this multicentre, phase 2 trial, the researchers randomized 76 patients with recurrent metastatic NSCLC to receive either pembrolizumab alone (control arm) or pembrolizumab given within a week of completion of SBRT, which entailed three 8 Gy doses to a single tumour site (experimental arm).
The overall response rate at 12 weeks was 18% in the control arm (40 patients) versus 36% in the experimental arm (36 patients). Median progression-free survival was 1.9 months versus 6.6 months and median overall survival was 7.6 months versus 15.9 months, for control and experimental groups, respectively. The researchers observed no increase in treatment-related toxic effects in the experimental arm.
“The results of this study are encouraging,” the authors concluded. “Further evaluation in a larger phase 2/3 trial is recommended to confirm the findings and elucidate the processes by which SBRT may activate non-inflamed NSCLC tumours toward an inflamed tumour microenvironment, rendering them receptive to immune checkpoint inhibition.”
Future promise
In an accompanying invited commentary, Joshua Walker from Oregon Health & Science University and Billy W Loo Jr from Stanford University School of Medicine highlight the significance of the two papers. “Although not conclusive, these studies appear to provide support for the complementary hypotheses tested in these trials of novel treatment of metastatic NSCLC,” they write.
Loo and Walker note that the combination treatment appears very well tolerated in both studies, a critical finding given concerns regarding possible increased immune-related adverse events when combining SABR with immunomodulation. They also describe the many unanswered questions that must be addressed in future studies, including the significance of metastatic disease burden, timing, the use of biomarkers and many others (JAMA Oncol. 10.1001/jamaoncol.2019.1448).
“At this stage of early excitement, it is all the more important to approach these questions through systematic clinical and translational research to maximize the promise that radiotherapy will throw its beams further toward cure through synergy with immunotherapy,” they state.
Measurements showing that a quantum system follows the forward-pointing trajectory of the arrow of time have been done by Kater Murch and colleagues at Washington University in St Louis, US. The team did this by comparing the likelihood of a controlled quantum process following forward- and backward-in-time trajectories.
In the macroscopic everyday world, systems are governed by processes that play out over the one-directional, forward-pointing arrow of time. An ice cube in a warm environment, for example, must always melt into a puddle as time progresses. Having the process run spontaneously backwards in time to have a puddle freeze-up to form an ice cube seems absurd. This is because melting involves an increase in entropy that is defined in terms of the forward-pointing arrow of time. This is an expression of the second law of thermodynamics.
On microscopic quantum scales, however, this inevitability of the arrow of time becomes less certain. While a video of a melting ice cube would look strange if it were played backward, it is less clear whether all quantum processes would look quite so strange if they were played in reverse.
Coupled qubit
Previously, physicists have been particularly uncertain as to whether measurements of quantum systems must always follow forward-pointing arrow trajectories. Murch’s team devised an experiment to resolve this issue. It involves coupling a superconductor qubit to the fundamental mode of a microwave waveguide cavity. With this setup, the researchers can determine the quantum state of the qubit by measuring the phase of the cavity’s output signal. Because of the quantum nature of the system, the measurement results in a backaction that affects the final state of the qubit.
Trajectories in time of the qubit are determined by making a time series of measurements of the qubit’s quantum state. If this measurement process were played backwards, the very result of the signal measurement would ultimately cause the qubit to return to its original state, before measurement. Unlike in macroscopic scales, this outcome is a possibility in the quantum realm, but until now, the likelihood of this happening compared with its forward-pointing counterpart has remained unclear.
After performing many measurements on their qubit, Murch and colleagues recorded the frequencies of outcomes resulting from both forward- and backward-in-time trajectories, across several different durations of observation times; constituting varying time arrow lengths. In most cases they found that the forward trajectories were more likely than backward trajectories. However, backward trajectories were not impossible.
Through statistical analysis, the team could then define clear relationships between the relative likelihoods of forward and backward trajectories, and the duration of the trajectory (the arrow length). As arrow length increases, outcomes following forward trajectories increasingly came to dominate over those following backward-in-time paths.
These results suggest that even on quantum scales, the measurement process tends to adhere to forward-in-time trajectories. Murch’s team, therefore, show for the first time that the steady forward pointing of the arrow of time remains as fundamental a rule for quantum measurements as it is in directing entropy increases on macroscopic scales.
At a time when so many of us will be thinking about our nearest celestial neighbour, given the fact that we first set foot on it 50 years ago, The Moon: a History for the Future by Oliver Morton provides a timely, powerful and at times emotional account of the story of our natural satellite. It is clear that a tremendous amount of work and research has gone into Morton’s book, which comprehensively charts every aspect of the history of the Moon. You’ll find human observations; how the Moon formed; the Apollo missions, as well as future missions; mining; and even topics such as what role the Moon, or a similar substantial satellite, could play in the existence of intelligent life.
While space may contain many worlds that are more exciting than the Moon to explore, Morton’s words help you to see the Moon from a fresh perspective – to truly understand the impact it has had on many aspects of our history, and the value it could hold in our future. The book also includes a mix of short snappy chapters – covering topics such as the lunar surface, phases and orbit under headings such as “Reflections”, “Boundaries” and “Reasons”– that work nicely to break up longer chapters.
Cash in the attic
One of the greatest analogies Morton uses to describe our Moon is that it is akin to Earth’s attic – “No-one quite knows what is there, and a lot of it is probably junk, but there is more of it than you think and it’s older too. There might be valuable oddities. There might be precious heirlooms.” Morton also reminds the reader of times when we may have taken our celestial companion for granted. For while it has been a constant presence by our side, we often don’t think as much about the impact of the Moon on life here on Earth. Of course, this is now changing thanks to private companies taking an interest in the Moon, and the rise of new space players such as China and India.
There is a healthy dose of science fiction merged within the text, with nods to the likes of Carl Sagan and Robert Heinlein, as well as references to the visionary physicist Gerard O’Neill, and his roadmap for our space future, in his The High Frontier: Human Colonies in Space. These and many other visionaries had a huge impact on space exploration, and the inclusion of such experts helps to add to the inspiration, and also frustration, which can be drawn from human exploration of the Moon.
The writing at times is wonderfully engaging, and for some chapters I found it impossible to put down. The book is also right up to date, given how fast things within the commercial space industry can sometimes move. In the latter half of the text, Morton’s focus moves to returning humans to the Moon. Inevitably, the exact details of how this will happen are likely to change but Morton looks at many of the planned future lunar missions. They include private commercial companies such as Astrobotic; the European Space Agency’s plans for a Moon Village (a collaboration of public and private ventures); as well as SpaceX’s Dear Moon project, which aims to send Japanese billionaire Yusaku Maezawa and a crew of artists to orbit around the Moon. However, since publication, NASA has announced details of its Artemis Lunar Program – which aims to send men, and for the first time, women, to the surface of the Moon by 2024. And there will likely be further developments that cannot be predicted.
The Moon might particularly find a place in the hearts of the so-called “orphans of Apollo”, who Morton references on several occasions. These are people who remember the Apollo Moon landings, and who were inspired by them to become scientists or engineers, to perhaps work in the space industry, but were disappointed by what happened in space post-Apollo (or rather, what didn’t happen). Morton reminds the reader, and in particular those orphans, that the space future many had expected may now finally come to fruition. Although for some, until it actually happens, the frustrations remain.
Human side
My favourite parts of the book are the excerpts of transcripts from all of the six Apollo missions that landed on the Moon. I am not ashamed to say that reading those words bought a tear to my eye. Morton’s use of these texts is a powerful reminder of the human aspect of sending astronauts to the Moon, and the impact of the words of those who walked on the lunar surface is felt by those of us back on Earth. While just 12 astronauts have so far set foot on the surface, reading the transcripts is a poignant reminder of the people behind the missions, and the inspiration that can be drawn from them.
Apollo was the first time human beings visited another world. There will never be a time when this story does not inspire awe. Even for those who work in the space industry (myself included) or those who have a strong interest in space, there is still a lot of new and interesting stuff in here. And most importantly, this book serves to make you think about the Moon with a fresh perspective.
As we look to a future where the Moon may have an ever-growing presence in human exploration of space, Morton provides us with an essential handbook of the story of this lifeless rock that remains faithfully by our side. In Morton’s own words: “more people on Earth today will walk on the Moon, than those who have walked on the Moon.”
If there’s something strange in your neighbourhood, then Hollywood tradition suggests that you’re gonna call the Ghostbusters. But if that “something strange” looks less like an ectoplasmic manifestation, and more like an unidentified radiation source, you might want to pick up the phone to Mansie Iyer instead.
As an expert in nuclear forensics, Iyer is part of a multidisciplinary group of scientists who swing into action whenever a radioactive object turns up in an unexpected location. During these so-called “interdictions”, nuclear forensic scientists work to identify what the object is, where it came from, who it belongs to and whether there might be more of it. This, Iyer acknowledges, is a tough job. “It’s a little rough and tumble out there,” she told attendees in her keynote address at the NuFor conference in Bristol, UK, last week. “We’ll know we’ve made it when we have a TV show called CSI: Nuclear Forensics. We’re not there yet.”
The challenging nature of the field was evident throughout the conference, which took place on 10-11 July and was co-organized by the Atomic Weapons Establishment (AWE), the Institute of Physics (which publishes Physics World) and the University of Bristol’s South West Nuclear Hub. The central premise of nuclear forensics is that differences in how and where radioactive materials are mined, processed, enriched and stored will leave tell-tale markers in the materials’ chemical and physical properties. In CSI terms, these markers play the role of fingerprints or DNA, providing clues to the material’s origins and helping law enforcement officials find out who’s been spreading it around.
We want to be able to go back and say, ‘Where did this come from?’
Jacquelyn Dorhout, Los Alamos National Laboratory
Behind that relatively straightforward premise, however, the science can be rather complicated. The photo above comes from a talk by Jacquelyn Dorhout, a post-doctoral researcher at Los Alamos National Laboratory in the US. In the photo are 22 vials of a powdery substance, ranging in colour from pale yellow to bright orange. Despite their visual differences, every one of those vials contains the same chemical: ammonium diuranate (ADU), popularly known as yellowcake. ADU is present at many stages of the nuclear fuel cycle, and Dorhout and her colleagues found that its colour and texture variations are due to differing amounts of ammonium nitrate. In principle, Dorhout says, these differences could reveal forensically useful information about a sample’s history. “We want to be able to go back and say, ‘Where did this come from?’,” she explains.
Unfortunately, not every potential marker turns out to be useful. In another talk, AWE scientist James Dunne described a series of experiments on uranium ore from mines in Portugal and in Cornwall, UK. The “isotopic signature” of ore samples – including the ratio of uranium-235 to the more common uranium-238 – can be an important tool in nuclear forensics. In 2009, for example, isotopic signatures helped Australian law-enforcement officials trace a glass jar labelled “gamma source” back to a disused uranium mine in northwest Queensland, after the jar was seized in a drugs raid. In the Portuguese and Cornish ores, however, Dunne found that the U235/U238 ratios differed not only between mines, but also between different veins of ore within the same mine, and even between samples taken from different places within the same vein – making the ratio pretty useless for detective work. Radiogeochemistry is, he noted ruefully, a complex science.
In some cases, merely identifying a radioactive substance is difficult, never mind working out where it came from. As a strong alpha emitter, plutonium-238 is a significant radiation hazard, and the ratio of Pu-238 to its “daughter” U-234 in a sample of nuclear fuel tells you something about the type of reactor that made it. (Specifically, it tells you the level of enrichment used and the amount of time the fuel spent in the reactor.) But as Jeremy Inglis pointed out in his talk, Pu-238 looks the same in a mass spectrometer as the comparatively benign U-238, while its alpha emission spectrum is identical to that of Pu-239 and Pu-240. Inglis and his colleagues at Los Alamos are working on a modified mass-spectrometry technique that will, they hope, make it easier for nuclear forensics experts to pick Pu-238 out of the “lineup” of potential culprits.
The importance of such advances was brought home in a talk by John Simm, an officer in London’s Metropolitan Police who specializes in counter-terrorism operations. After a presentation that centred around the Met’s current tools for handling a “nuclear security event”, I asked Simm what tools he’d like to have in the future. “A list of everything something could be and how long it would take to identify it,” he replied, gesturing at the Periodic Table of the Elements hanging on the wall behind him. His second wish, he added half-jokingly, was for an internationally recognized series of terms for how scientists report probabilities to law enforcement, running from “possibly” all the way up to “definitely”.
During the conference’s poster session, I spoke briefly with Erin Holland, a Bristol PhD student who is developing forensic markers for thorium. Her background is in earth sciences, and she pointed out that because nuclear forensics draws on research from chemistry, physics and geology, conferences in the field are great for “informed non-experts” because they are generally free of discipline-specific jargon. As an informed non-expert myself, I have to agree, and I’m already looking forward to next year’s follow-up gathering. And who knows? Maybe by then, the organizers will be able to screen episodes of CSI: Nuclear Forensics in the coffee breaks.
A model that simulates magnets can also reproduce pools of water on Arctic sea ice from just one real-world measurement. Researchers in the US and UK adapted the Ising statistical model of phase transitions in ferromagnets to recreate melt-pond patterns. Characterizing the distribution of meltwater at small scales could improve climate models and predict ice loss better.
As climate changes, warming is expected to be especially rapid at high latitudes. In the Arctic, a lengthening melt season over the last few decades has already reduced the volume and extent of sea ice, with year-on-year ice-loss rates generally exceeding predictions.
One reason for the failure of models to predict this loss accurately might lie in how they account for melt ponds. The formation and growth of these ponds, which occurs at the transition between sea ice and open ocean, includes a positive feedback loop that makes the system especially sensitive.
“Pond evolution largely controls sea-ice albedo, a key parameter in climate modelling and one of the most important – and least understood — processes in determining the role of sea ice in the climate system,” says Kenneth Golden of the University of Utah, US.
Real-life and modelled meltponds. (Image courtesy: Donald Perovich (left panel), Yi-Ping Ma (right panel))
As melt ponds form on the sea-ice surface, highly-reflective ice and snow are replaced by darker pools of water. The meltwater absorbs more solar radiation and warms up more than the ice that it replaces; the extra energy can trigger additional melting in its surroundings. When the melt pond penetrates the full thickness of the ice, warmer ocean water floods in from below, accelerating the process.
Existing descriptions of pond formation in global climate models consider the overall volume of meltwater but not its surface distribution. Yet, because the albedo change caused by melt ponds is a surface process, and because the rate at which ponds conduct heat to their surroundings depends on their perimeter, understanding the rules governing melt pond sizes is crucial for climate modelling.
Sea-ice spin
The standard Ising model comprises a lattice of interacting particles, each of which is assigned a spin value that is either up or down. To capture the detailed geometry of melt ponds, Golden, with colleagues at Northumbria University, UK, the University of Dayton, US, and the University of Utah, US, created a version where the lattice represents the sea-ice surface, and each node a pixel of either ice or liquid water.
Starting with a random input configuration that does not resemble the real-world, each node interacts with its neighbours until the system settles on a local low-energy state. With a lattice spacing of 1 metre – the length scale over which Arctic ice exhibits significant topographic differences – the pattern that emerges from the energy-minimization process closely matches the melt-pond distribution seen in real life. For example, both real and modelled ponds scale in size according to the same power law, and both form more complex, fractal shapes when they grow larger than 100 sq. m.
“The approach could ultimately lead to a framework for representing pattern formation occurring at spatial scales smaller than the grid spacing used in global climate models, which currently track meltwater volume without representing its spatial distribution,” says Golden.
Other parameters that describe ferromagnetic behaviour in the original Ising model also have real-world analogues in the version adapted for sea-ice. The global magnetic field, for example, which conventionally governs how likely particle spins are to align as up or down, now corresponds to solar energy input, making each lattice point more or less likely to be water or ice. The strength of coupling between neighbouring particle spins, meanwhile, now describes heat flow between water and ice in adjacent pixels.
Although Golden and colleagues ran their model with zero global field and an infinite coupling strength, changing these parameters after the initial process could perturb a realistic pond arrangement from its metastable state into an alternative low-energy configuration. In this way, the researchers might simulate how sea ice evolves as melt ponds respond to changing environmental conditions.
Radiotherapy is currently delivered using generic dose prescriptions that don’t account for individual tumour characteristics. To help personalize treatments, researchers from Cleveland Clinic and Siemens Healthineers have developed an artificial intelligence (AI) framework that uses a patient’s CT scans and electronic health records to generate an individualized radiation dose (Lancet Digital Health 10.1016/S2589-7500(19)30058-5).
The team built the AI framework using CT scans and health records from 944 lung cancer patients treated with stereotactic body radiotherapy. This high-dose treatment was introduced to achieve local tumour control while avoiding surgical morbidity in patients with early-stage lung cancer or lung metastases. But recent studies have noted high local failure rates in some patient subgroups. Personalized adjustment of radiotherapy dose could help mitigate such failures.
“While highly effective in many clinical settings, radiotherapy can greatly benefit from dose optimization capabilities,” explains lead author Mohamed Abazeed. “This framework will help physicians develop data-driven, personalized dosage schedules that can maximize the likelihood of treatment success and mitigate radiation side effects for patients.”
Deep learning framework
For their latest study, Abazeed and colleagues input pre-treatment lung CT images into Deep Profiler, a deep neural network that has radiomics incorporated into its training process. Deep Profiler analysed the scans, examining a multitude of deformable radiomics features, to create an image signature that predicts treatment outcomes.
The researchers used 849 patients in an internal study cohort (those treated at Cleveland Clinic main campus) to train and validate the AI framework. They found that radiotherapy failed at a significantly higher rate in patients with high image scores than in those with low scores; the three-year cumulative incidence of local failure was 20.3% in high-risk patients compared with 5.7% in the low-risk group.
The team validated the accuracy of their framework using an independent cohort of 95 patients who had received stereotactic lung radiotherapy at seven affiliate sites and were scanned using several types of CT scanner. The network was accurate in stratifying patients in this external cohort into high- and low-risk groups on the basis of data extracted from the internal study population; the two-year cumulative incidences of local failure were 9.5% and 39% in the low- and high-risk groups, respectively.
These results indicated the presence of image-distinct patient subpopulations with differential sensitivity to radiotherapy.
Individualizing the dose
Next, the researchers combined the image signatures from Deep Profiler with clinical variables from patient health records – such as biologically effective dose and histological subtype (adenocarcinoma and squamous cell carcinoma) – to derive iGray, a personalized radiation dose that minimizes the risk of local failure. They defined iGray as the patient-specific dose that reduces the probability of treatment failure to below 5% at 24 months.
The researchers note that iGray uses the clinically validated linear quadratic model, is empirically derived, with no assumptions made regarding individual tumour radiosensitivity, and is directly clinically actionable as it recommends a dose that can be achieved using several treatment schedules. In this study, iGray ranged from 21.1 to 277 Gy – a wider dose range than the actual delivered dose (39–180 Gy) – and recommended a dose reduction in 23.3% of patients. The results also showed that iGray can be safely delivered in the majority of cases.
“The development and validation of this image-based, deep-learning framework is exciting because not only is it the first to use medical images to inform radiation dose prescriptions, but it also has the potential to directly impact patient care,” says Abazeed. “This image-based information platform can provide the ability to individualize multiple cancer therapies but more immediately is a leap forward in radiation precision medicine.”
The world has changed since 1969. Home computers did not exist, colour televisions were up-and-coming, and telephones only came attached to a wall. Indeed, it is often said that a single modern smartphone contains more processing power than the computers that sent Neil Armstrong, Michael Collins and Buzz Aldrin to the Moon in July 1969. Yet, despite 50 years of advancing technology here on Earth, the scientific legacy of NASA’s Apollo missions is far from over.
Take the three laser ranging retroreflectors that were put on the Moon by astronauts from Apollo 11, Apollo 14 (January–February 1971) and Apollo 15 (July–August 1971). Despite being on the Moon for almost half a century, the devices are still in operation. Comprising an array of corner-cube reflectors, each device is around the size of a small suitcase – the Apollo 15 array being the largest with 65 × 105 cm of reflectors. Using Earth’s telescopes, scientists can aim a laser beam at the arrays and detect the reflected photons to gain accurate measurements of the distance between the Earth and the Moon (see “How high the Moon”).
This experiment has contributed to our understanding of the Moon’s orbit, the variation in its rotation related to distribution of mass, the Earth’s rotation rate and the Earth’s precession of its spin axis. It’s even been used to test Einstein’s general theory of relativity. It’s also revealed the rate the Moon is receding from the Earth (3.8 cm per year and counting) – a rate that contributes to theories about the Moon’s origin since you can extrapolate in the other direction.
“The Moon has moved since we put the laser reflectors on it and it’s consistent,” says NASA’s chief scientist Jim Green, a physicist who has worked at the agency for the last 40 years. “If it’s constantly moving away, it must have been closer [in the past]. And so we’ve now done the analysis to determine the Moon was created very close to the Earth and from an impact. That helps support one of our theories about the Moon and how it was created.”
An origin story
This lunar-creation theory – the giant impact hypothesis – involves another planet called Theia, which is thought to have been a similar size to Mars and travelled in the same orbit as an early Earth. Gravity attracted Theia and Earth together, producing an enormous collision that created the Earth as we know it and our Moon.
There is also a rival theory, which says that the Moon formed from debris orbiting the Earth. But whatever exactly happened, one thing is clear. “When [things] settled out, the Moon was just above a place we call the Roche limit,” says Green, referring to the minimum distance at which a satellite, such as the Moon, can exist while orbiting a larger body. “It formed outside an area that’s three Earth radii away. Right now, the Moon is 60 Earth radii away,” Green continues. “So that means if you were standing on the Earth at that time, which I wouldn’t recommend because it was just a mess, the Moon would have been 16 times larger in the sky than it is today.”
Given the closeness of the Moon, it follows that at that time, one Earth day was a mere five hours long. Green uses the classic analogy of a spinning ballet dancer who spins faster when her arms are closer to her body. “As the Moon moved away, the Earth had to slow down – just like the ballet dancer slows down when she moves her arms away from her – to conserve angular momentum,” he says.
“We had the basic concepts for theories about how the Earth and the Moon are put together,” Green explains, “but now we’re putting the next big steps on it.” In other words, this one experiment, placed on the lunar surface half a century ago, has not only given us continual measurements relating to the physics of the Earth and the Moon, but also continues to influence and inform scientific ideas.
Short but extraordinary
The Apollo 11 mission was a relatively short affair. After Armstrong’s famous first step onto the Moon’s surface, he and Aldrin ventured no more than 60 m from the lunar module and travelled just 1 km in total. Within three hours they were safely back inside the Eagle. The mission was after all a proof of concept and, apart from the political statement, its primary aim was to pilot a crewed landing on the Moon and return home safely.
Apollo 11 was a proof of concept and its primary aim was to pilot a crewed landing on the Moon and return home safely
The scientific experiments performed during Apollo 11 were therefore limited. Alongside the retroreflectors, Armstrong and Aldrin deployed a suite of experiments that each took only 10 minutes to set up and were designed to send data to Earth after the astronauts had left. The package included a Passive Seismic Experiment, which was sensitive enough to pick up the astronauts’ footsteps and even Armstrong tossing and turning in his hammock. It ran for three weeks after deployment, registering “moonquakes” and meteoric impacts, and consequently provided information about the Moon’s interior.
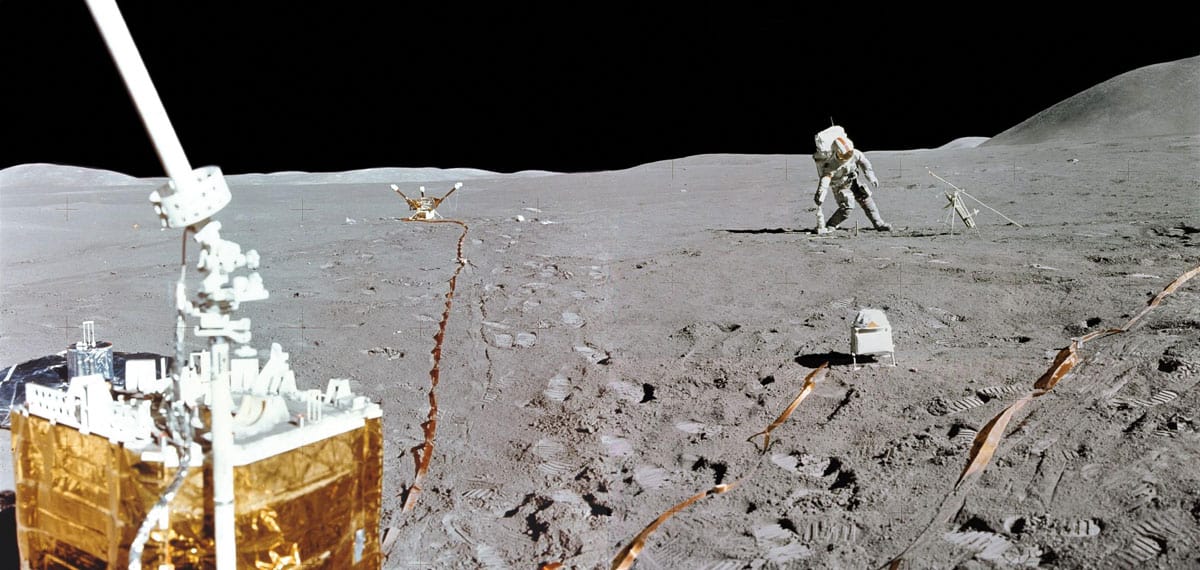
Lab on the Moon: Installed in July/August 1971, the Apollo 15 science payload included the ALSEP Central Station (foreground), the Passive Seismic Experiment (background, left) and the Solar Wind Spectrometer Experiment (slightly right of centre). Behind this, David Scott can be seen putting down the Apollo Lunar Surface Drill. (Courtesy: Jim Irwin/NASA)
The mission also had a detector that measured the accumulation of lunar dust and the radiation damage to the solar cells that were powering the experiment and communication devices. In addition, Armstrong and Aldrin collected samples of the solar wind using sheets of aluminium foil on a pole (switched to platinum foil on Apollo 16). Facing the Sun, the foils were exposed for different periods of time to check for variations in the make-up of the wind. They were then returned to Earth where scientists found isotopes of noble gases, which varied in quantity according to the wind intensity. The astronauts’ helmets also had cosmic-ray detectors that were analysed after they returned to Earth.
The mission was a huge achievement, but anyone hoping for evidence of life was disappointed. After returning to Earth, the astronauts, spacecraft and samples underwent a 21-day quarantine while the Lunar Receiving Laboratory sterilized the containers of samples and analysed sections of lunar rock using spectrometers and microscopes for gases, chemical and physical properties as well as testing for radioactivity and biological life. The lab reported that: “No micro-organisms of extraterrestrial origin were recovered from either the crew or the spacecraft.”
Upscaling the science
Science on the first crewed landing may have been a secondary objective, but in November 1969 it took centre stage with Apollo 12. The primary objectives this time included inspecting, surveying and sampling the Moon, and deploying the first full Apollo Lunar Surface Experiments Package (ALSEP). Excluding investigations that took place from lunar orbit and on the journeys to and from the Moon, the six Apollo missions that landed on the lunar surface performed a total of 53 experiments. However, the number and type of experiments varied from mission to mission.
For instance, Apollos 12, 14 and 15 had a Suprathermal Ion Detector Experiment to measure the flux, mass and relative energy of positive ions with energies less than 50 eV. The sources of these ions included the solar wind and atmospheric gases that were ionized by ultraviolet radiation. Increased levels were also recorded shortly after the Passive Seismic Experiments (deployed by missions 11, 12, 14, 15 and 16) registered meteoroid impacts. Higher-energy particles were studied using Apollo 14’s Charged Particle Lunar Environment Experiment, and the particle-track cosmic-ray detectors of Apollo 16 (April 1972) and Apollo 17 (December 1972).
Apollos 12, 14 and 15 also performed a Cold Cathode Ion Gauge Experiment to measure the pressure of the Moon’s tenuous atmosphere. While Apollo 12’s experiment lasted just a few weeks, those for 14 and 15 continued returning data to Earth from 1971 to 1975. Apollo 17 went on to measure the constituents of the atmosphere with the Lunar Atmospheric Composition Experiment, revealing that the primary gases present are neon, helium and hydrogen. When analysed in conjunction with seismic measurements, researchers found that levels of argon-40 increased during periods of high seismic activity. It is thought that the gas is produced by the decay of radioactive potassium-40 beneath the surface and is released when moonquakes create fractures.
Apollos 12, 15 and 16 included a lunar surface magnetometer, which measured the Moon’s magnetic field and contributions from external sources, namely the Earth and Sun. By measuring over several months, the fluctuating external fields could be excluded, revealing that the Moon’s own magnetic field varies over time in certain regions. Using the magnetometer observations as the Moon passes in and out of Earth’s magnetic field, it is also possible to estimate how the Moon’s electrical conductivity varies with depth via a technique called electromagnetic sounding.
The variety of science experiments deployed by the Apollo astronauts has provided clues about the lunar interior – and the data are still revealing the Moon’s secrets decades later. Take the lunar core, for example. While the Apollo magnetometer measurements did not require the Moon to have an iron-rich core, the results limited its radius to a maximum of 450 km – a figure supported by the seismic data. Meanwhile, the variations in the Moon’s rotation, observed by the laser ranging retroreflectors, constrained it further, implying that the radius is less than 350 km. But it wasn’t until 2011, when researchers re-analysed data from the Passive Seismic Experiments, that a more detailed picture of the core was achieved (Science331 309). Using seismic array-processing to enhance faint signals in the Apollo data, the scientists were able to deduce that the lunar core is iron-rich, and consists of a solid inner ball of about 240 km in radius and a 90 km-thick fluid shell. The re-analysis also suggests that the core contains a small percentage of light elements such as sulphur, which is similar to Earth’s core.
Moon dust and spacesuits
Not all of the Apollo missions’ science objectives went as planned. On Apollo 11, Armstrong and Aldrin collected 21.5 kg of soil and rocks but did not take a lunar environmental sample or a gas analysis sample. Nor did they complete all the planned sample documentation due to the mission’s time constraints.
All the Apollo astronauts were plagued by very fine Moon dust, which coats the lunar surface and is particularly “sticky” because solar radiation strips away electrons, making it static. The dust clogged up, wore down and interfered with spacesuits and experiments alike. Apollo 11’s Passive Seismic Experiment, for example, overheated and failed because of Moon dust, while Apollo 17 astronaut Harrison Schmitt not only reported it wearing through three layers of Kevlar-like material on his boot, but also complained of “lunar dust hay fever”.
The bulky spacesuits themselves also caused problems. Apollo 16 commander John Young tripped over a cable and broke the heat-flow experiment, reminding NASA that all spacecraft hardware needed to be more durable when its operators had limited mobility and were wearing spacesuits and helmets.
Despite Young’s accident, the rest of Apollo 16 was a success. Its scientific findings included the discovery of two new auroral belts around Earth and the first photograph of the geocorona in the hydrogen wavelength. The mysterious geocorona – part of the Earth’s outer atmosphere – is a gaseous cloud of hydrogen atoms that are luminous in far-ultraviolet light. The images confirmed that the hydrogen geocorona could be detected above the interplanetary Lyman alpha background – radiation emitted by distant galaxies from neutral hydrogen. Intriguingly, it was discovered in 2019 that this atmosphere extends beyond the Moon (J. Geophys. Res. Space Phys. 10.1029/2018JA026136), which means that the astronauts were actually within the geocorona too.
Members of the Apollo 16 crew also measured the composition of the lunar surface while they were in orbit, using X-ray fluorescence spectrometers (to look at magnesium, aluminium and silicon) and gamma-ray spectrometers (to identify thorium, iron and titanium). An alpha-particle spectrometer detected radioactive radon emission from the Moon and identified regions, such as the Aristarchus Crater, with higher activity, indicating areas where there is more uranium in the Moon’s crust.
Bigger steps
As the Apollo missions progressed, the time the astronauts spent on the surface during extravehicular activities (EVAs) – excursions out of the lunar module – increased and so did the science. From Apollo 15 they even took a battery-powered buggy – the Lunar Roving Vehicle – that let them explore further. By Apollo 17, NASA moonwalkers spent a record 22 hours performing EVAs, travelling a cumulative distance of about 35.9 km, performing 10 science experiments and collecting an impressive 741 rock and soil samples, including some from as deep as 3 m below the surface.
As the Apollo missions progressed, the time the astronauts spent on the surface increased and so did the science
In total, the Apollo astronauts brought back 382 kg of lunar rocks and soil. These pieces of lunar regolith ranged from volcanic basalt and ancient rocks from the Lunar Highlands, to breccia – sedimentary rocks containing fragments of other rocks or minerals – formed from the impacts that produced the distinctive craters visible from Earth. Soil samples from both Apollo 11 and 12 were even used on Earth to grow plants or exposed to seeds. Tests were done on 35 species and the conclusion was that lunar material was not harmful to plants.
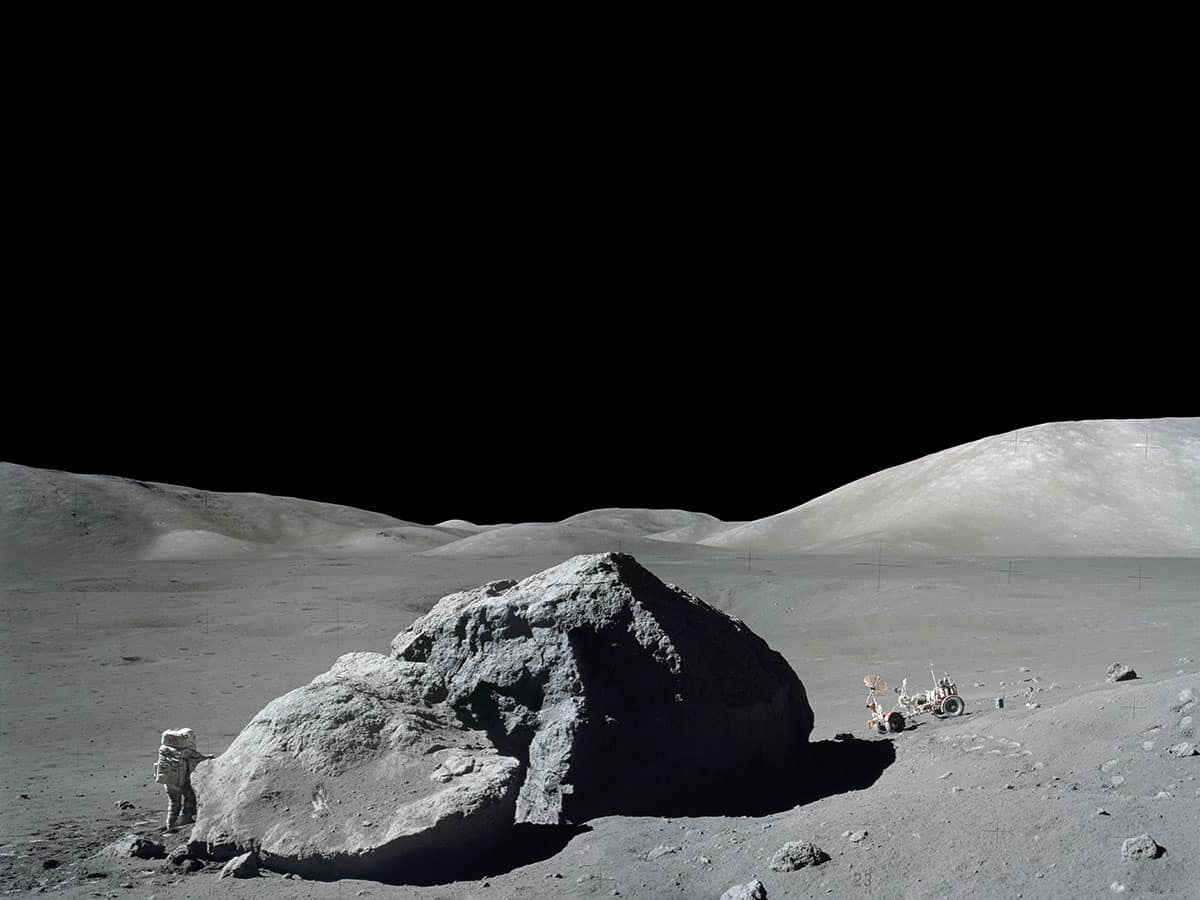
Rocky roving: Harrison Schmitt on 13 December 1972 during an Apollo 17 extravehicular activity at the Taurus-Littrow landing site. The Lunar Roving Vehicle, which transported Schmitt and Eugene Cernan to this location from their Lunar Module, is seen in the background. (Courtesy: Eugene Cernan/NASA)
Apollo 12’s cache included the Bench Crater meteorite – the first meteorite to be found on another world. But the largest sample of them all was from Apollo 14. “It was roughly the size of a water melon,” says Katherine Joy, a lunar geologist at the University of Manchester in the UK. She studies samples from the Apollo missions, supplied by NASA, and was part of a team that analysed the Bench Crater meteorite in 2013.
“From the Apollo samples we’ve learnt how the Moon’s crust formed,” Joy says. “The white areas of the Moon probably formed in a magma ocean. The early Moon was very hot and then it formed a crystalline crust out of that magma ocean – and that’s useful as it tells us how other planets have generated a crust.”
Considering images from the Moon show astronauts on a monotonously grey surface, it is the colours beneath the dust that Joy finds surprising while working with Apollo samples. “Some of the rocks are beautiful and crystalline,” she explains. “Some are brilliant white, some are brown, some are green. Some have large crystals that you can see with your eyes.”
A grey Moon full of colours
Despite all the science experiments, the only astronaut on the Apollo programme to have trained as a scientist is Harrison Schmitt, who got a PhD in geology at Harvard University in 1964. As part of the Apollo 17 mission, he and fellow crew member Gene Cernan were the last human beings to walk on the Moon. During the mission, Schmitt got extremely excited when he spotted some soil that was not grey, famously shouting: “It’s orange. It’s orange!” The orange colour was due to volcanic glass formed within the soil, though it can take on other hues too. “Some of the lunar soil is black, some is grey,” Joy explains. “There’s this beautiful bottled green soil from Apollo 15 that’s also volcanic glass. Ancient volcanoes covered the lunar surface with their pyroclastic products.”
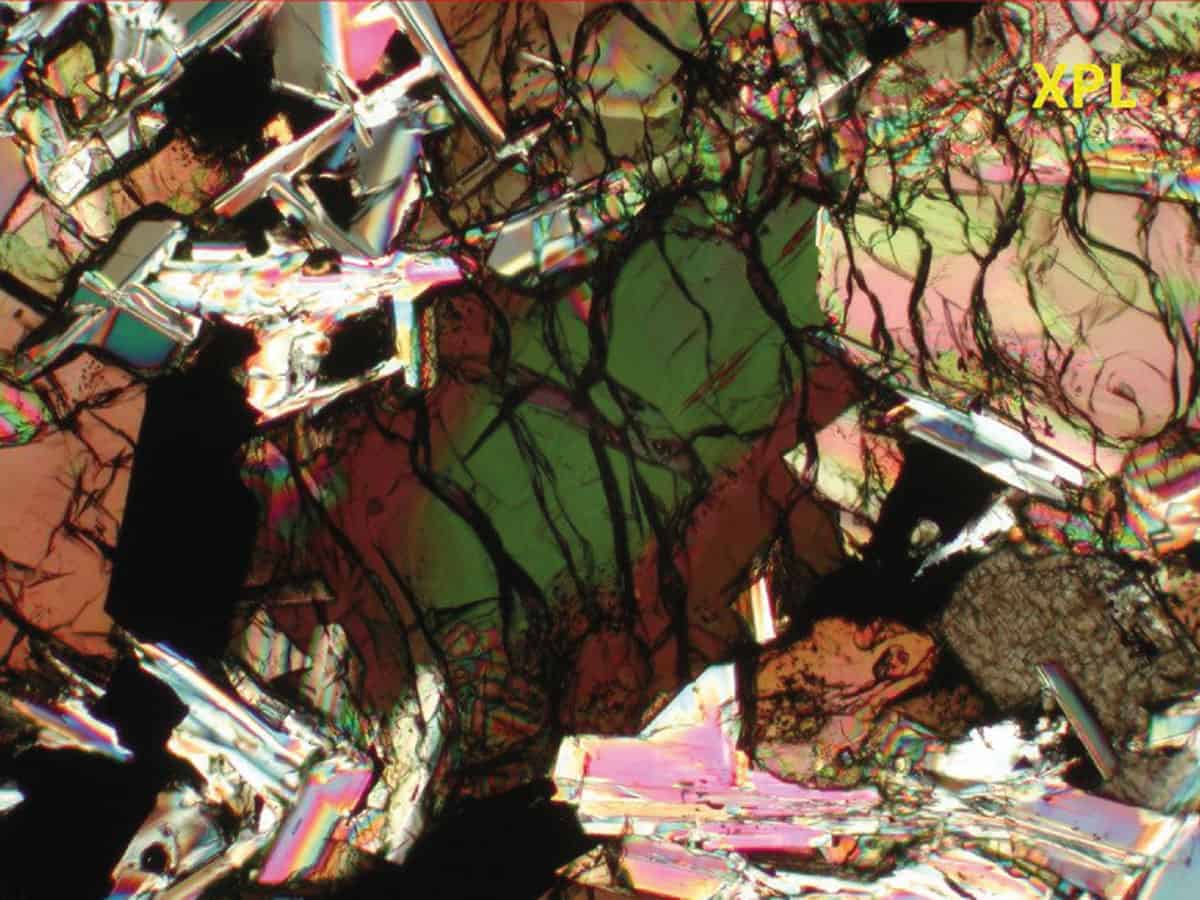
Moon of many colours: Photomicrograph of thin section of lunar sample 14053. (Courtesy: Larry Taylor/University of Tennessee )
Once the lunar samples were back on Earth, NASA allowed teams of scientists around the world to study them, which led them to deduce that the Moon once had active volcanoes on its near side during a period 3–3.8 billion years ago. “The black stuff is basalt like you get in Hawaii or Iceland,” Joy continues. “The white areas are made up of anorthosite, which is similar to granite. It’s a rock that’s dominated by a mineral called feldspar and the significance of that rock is that most of the Moon is made of it and it was formed in that earliest phase of the magma ocean. Then everything got bashed by impact so it’s all a big mix.”
Watery Moon
The lunar samples, when first analysed, registered small concentrations of volatiles – elements and compounds with low boiling points that vaporize easily. This includes nitrogen, hydrogen, carbon dioxide, methane and water, so it was assumed that the Moon was dry.
However, in 2010 this assumption came into question when a team led by Jeremy Boyce, at Caltech in the US, studied grains of the calcium phosphate mineral, apatite, within lunar sample 14053 – a chunk of basalt collected by Apollo 14 (Nature466 466). Using an ion microprobe, the team discovered hydrogen in the form of structurally bound hydroxyl groups (OH–) – implying that water could be present beneath the lunar surface. Indeed, in terms of the hydrogen, sulphur and chlorine content, the Apollo 14 apatite was indistinguishable from volcanic rock found on Earth, suggesting they were made through similar processes. Although this doesn’t mean the Moon is rich in water like Earth, it demonstrates that lunar geological processes can make at least one hydrous mineral.
The hypothesis that the Moon might not be as dry as we originally thought was confirmed in perhaps one of the greatest recent discoveries about our neighbour. In 2018 Shuai Li at the University of Hawaii and colleagues found direct evidence of water ice in regions of permanently shadowed craters at the lunar poles (PNAS115 8907). The finding was accomplished through optical methods and has implications for any future human presence or base on the Moon – especially for producing energy with hydrogen fuel cells using in situ resources.
Those trips to the Moon will depend a lot on the information and experience gained by the Apollo programme. And, as we develop and improve our analysis techniques, the Apollo samples and data could reveal more secrets. We may this year be celebrating the 50th anniversary of that famous “giant leap for mankind”, but the legacy of the Apollo missions is living on.
Astronaut hindsight
Scientist-astronaut: Harrison Schmitt collects lunar rake samples during Apollo 17 at the Taurus-Littrow landing site. (Courtesy: Eugene Cernan/NASA)
In April 2019 I attended a symposium at the US National Academy of Sciences in Washington to celebrate the 50th anniversary of the Universities Space Research Association, which had been set up in 1969 for scientists to study the lunar rock and soil brought back by the Apollo missions. One of the speakers was a former senator from New Mexico: Apollo 17 astronaut and trained geologist Harrison Schmitt. He showed a recent image of the Moon taken of his craft’s landing site by NASA’s Lunar Reconnaissance Orbiter – a mission that has been continuously mapping the Moon for the last 10 years. It revealed the dark grey dune tracks left by the lunar rover wheels while travelling for samples, which are still visible due to the lack of wind or atmosphere on the Moon.
Apollo 17’s Active Seismic Experiment deployed at the site showed that the regolith under Schmitt’s space boots was about 10–12 m deep. “Quite a bit deeper than elsewhere,” he pointed out.
When talking about deploying the scientific suite of instruments that made up his mission’s Apollo Lunar Surface Experiments Package (ALSEP), Schmitt was surprisingly harsh on himself. “Why didn’t I deploy the ALSEP right here,” he said, pointing to a region near the lunar lander that was obviously more exciting to a geologist like himself, “instead of walking 50 to 80 metres and putting it in a not-quite-so-good spot? And I can’t tell you.” Waiting for the laughter to die down, Schmitt, then 83, added: “Things look very different when you’re down in the craters.”
During that final mission, in late 1972, Schmitt and his fellow astronaut Gene Cernan also collected a sample core from the Taurus-Littrow Valley. It was sealed and has been left untouched since then. Earlier this year, it was announced that geologist Chip Shearer, from the University of New Mexico, will soon be unsealing the core to study it using the latest available techniques. The result is likely to further our scientific understanding of the Moon.