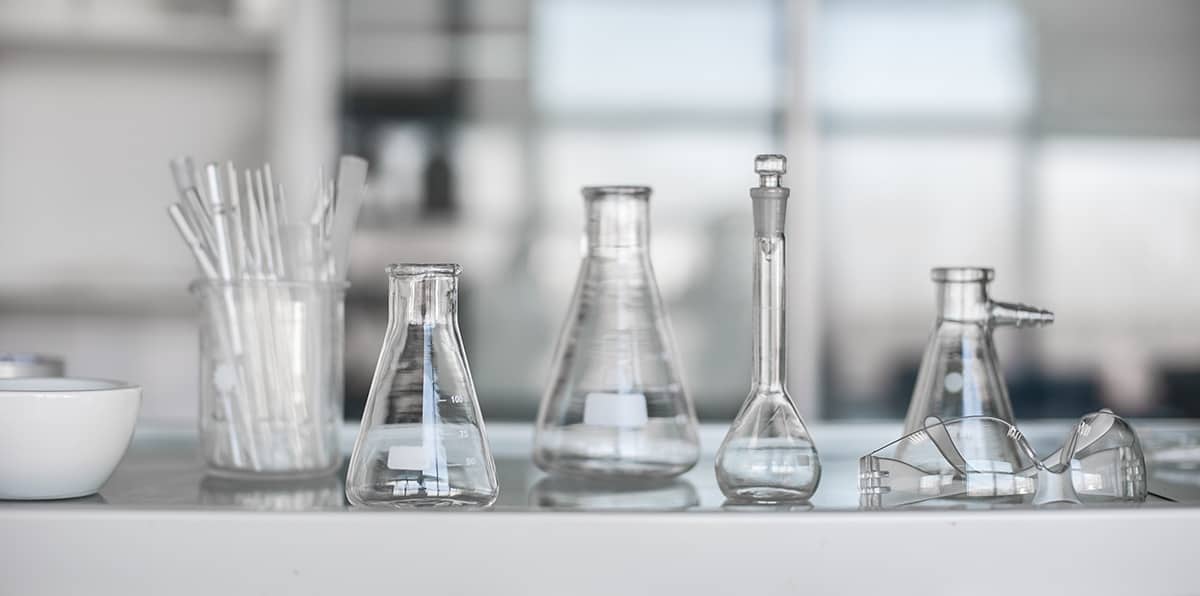
When I was a PhD student at the Cavendish Laboratory, Cambridge, in the 1990s, I was once standing in the queue for the lab’s storeroom when the then head of physics, Archie Howie, wandered by. Overhearing a physicist ask the storeroom supervisor for two ballpoint pens. Howie demanded to know why the physicist needed two Biros when you can only write with one at a time. Although I can’t remember if I slyly pruned back my own wish list for glass vials and bottles of solvent, Howie’s comment struck me as a small but perfect example of the old approach in physics of getting by with less.
Physics at Cambridge (and elsewhere for that matter) was not supposed to be about burning cash on expensive and unnecessary equipment, but about using money, materials – and probably even pens – ingeniously, prudently and wisely. It was the “string and sealing wax” way of doing physics developed in the early 20th century, which stipulated that rapid progress could be made (and indeed was more likely) with rudimentary resources. Some physicists even frowned on buying equipment from instrument manufacturers: far better (and quicker) to build it yourself.
Such attitudes might seem quaint in today’s world, where there’s pressure to get ever-bigger grants, plus countless hi-tech manufacturers that offer products far superior to anything that researchers could hope to knock up for themselves (just check out some of the companies that have placed adverts on this website.) Still, that old-fashioned, prudent approach to physics, exemplified by Howie, has one big modern-day advantage: it’s much better for the environment too.
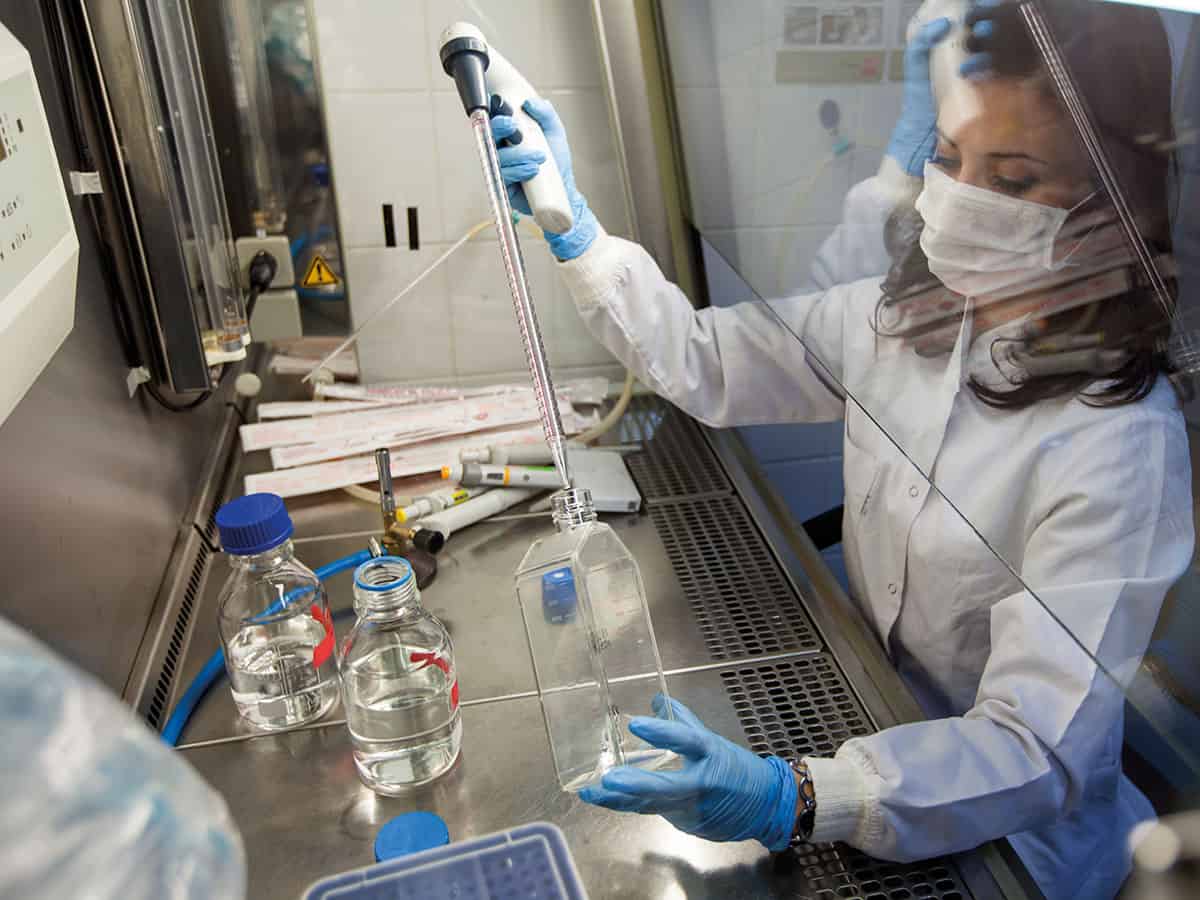
As the cover feature of the June 2019 issue of Physics World makes clear, being green doesn’t only involve using fewer disposable rubber gloves, though wasting less is vital. It’s also about expending less energy. The trouble is, many physics experiments are appallingly energy-hungry. With its countless radiofrequency cavities and liquid-helium-cooled superconducting magnets, CERN’s Large Hadron Collider, for example, uses 1.3TW of electricity a year, which the lab says is enough to power 300,000 UK homes.
So far, most initiatives and efforts to reduce researchers’ carbon footprint have come in the biological and life sciences, for example, through the My Green Lab in the US and the Laboratory Efficiency Assessment Framework in the UK. It’s now time for physicists to do their bit too – especially given that many physicists love to boast how they’re at the forefront of developing technologies for dealing with climate change.
At a simple level, that means turning off kit when not needed, closing fume cupboards and recycling or donating old electrical items (check out a list of top energy-saving tips in this feature. But it also means making energy efficiency an inherent part of all physics-research equipment – finding innovative ways to make them use as few resources as possible. Funding agencies may even have to insist on projects – especially big-science facilities – proving their green credentials before they get financial support.
It’s a cultural shift that’ll take a generation, but with the growing impact of climate change, there’s little time to lose.
Walk into the clean, sterile environment of a typical laboratory, with equipment neatly arranged and work spaces clearly delineated, you would be forgiven for thinking it is the model of efficiency. But look closer and you might be surprised.
Take the fume hood, which is used to suck hazardous fumes away. If left open, as is common, it can consume as much energy as 3.5 homes over the same period. What about that line of ultralow-temperature freezers across the wall? Many of these are unnecessarily cold, often storing only a few or even expired samples, and each one uses as much energy every day as an average home over the same time.
“Research labs consume 10 times more energy and at least four times more water [per unit area] than office spaces,” says Allison Paradise, founder of the Californian non-profit organization, My Green Lab. “And they are estimated to throw away around 5.5 billion kilograms of plastic annually worldwide, which is enough to cover an area 23 times the size of Manhattan [59.1 km2] ankle-deep.”
At least part of this is a necessary evil. Many labs require air-conditioned environments running 24/7, and contain specialist equipment that is unavoidably energy- and water-hungry. And with experiments often producing hazardous or contaminated waste, single-use plastic remains key to maintain safety. Even theorists shouldn’t feel smug: supercomputers may be key to doing calculations and simulations that were previously impossible, but they consume a lot of energy and resources, with the world’s current fastest device – Summit in the US – requiring 17,000 litres of water a minute to keep it cool.
But this doesn’t mean nothing can be done. Paradise set up her lab-sustainability organization in 2013 after an epiphany about her time working in a biomedical research lab. “I was taught to leave equipment on all the time ‘just in case’,” she recalls. “I never once questioned this at the time, and it wasn’t until years later, after I’d already left the lab, that it occurred to me that leaving equipment on overnight can be wasteful and is largely an unnecessary use of resources.”
Having since dedicated her career to improving the sustainability of research, Paradise aims to change scientists’ attitudes towards energy, water and waste through My Green Lab. This means looking at every aspect of how research is conducted: from retiring old, inefficient freezers to considering different ways to commute to campus, such as carpooling.
My Green Lab offers three main solutions for science to be more green. One is a recognized standard for laboratory sustainability, to which more than 200 labs across North America have signed up. There’s an eco-label for laboratory products like a food nutrition label that provides clear, transparent information about environmental impact. Finally, it offers an energy star rating for one of the worst carbon offenders in the lab – those ultralow-temperature freezers.
Upgrading labs and attitudes
But the effort to support labs becoming more environmentally friendly is not just a North American endeavour. One of the most active institutions is the University of Bristol in the UK. In reaction to its students’ concerns about their future, Bristol recently declared a “climate emergency” and pledged to become carbon neutral by 2030. Key to achieving this goal will be the efforts of Bristol’s labs, which occupy only 6% of the university’s space yet account for 40% of the total energy, water and waste. They will be encouraged to upgrade buildings and use smart technologies to improve energy efficiency, such as automatically turning off lights when nobody is in a room. Researchers will also have to change how they behave when they are in the lab. “There is no point in having efficient lab equipment and waste-management processes if lab users aren’t on board,” says Anna Lewis, the university’s sustainable labs officer.
Key culprit: Fume hoods that are left open can use the same amount of energy over a given period as 3.5 homes. (Courtesy: iStock/gevende)
The most striking example of these efforts occurred last year, when the university’s entire Biomedical Sciences Building – consisting of 25 teams and more than 170 individual labs – gained a 100% Green Lab Accreditation, a UK-recognized badge of sustainability achievement. The award was earned through a range of actions, including replacing energy-inefficient laboratory kit, introducing a lab-equipment sharing system, and implementing lab plastic recycling and reuse schemes. All told, these efforts resulted in a £85,000 cut in the university’s energy bill over two years.
Bristol is now working with other UK universities to develop a successor to the Green Lab Accreditation called the Laboratory Efficiency Assessment Framework (LEAF). Much like the Green Lab Certification in North America, or the UK’s own S-Lab Awards – which has been honouring international labs for green laboratory design, management and operation since 2012 – the LEAF accreditation will be given based on various lab sustainability criteria, such as procurement, waste, equipment and ventilation. Crucially, however, the programme also produces metrics on savings – in terms of both carbon and cash – to allow baselines, targets and measures to be developed. With LEAF being piloted in 16 UK universities this year, Lewis says, “The government and the public expect greater transparency and responsible spending from universities – LEAF provides a tool and a means to do this.” While the School of Physics at Bristol had previously not applied for any green lab awards, it has signed up for LEAF.
Other global initiatives are also helping by “gamifying” lab sustainability. For example, in the Freezer Challenge, labs are awarded points for reducing their freezer energy demands, while Shut the Sash is a competition that started in 2005 to combat the high energy consumption of fume hoods.
Yet this burst of voluntary challenges, accreditations and incentives raises the question: why are many labs still averse to going green? Unsurprisingly, the answer is complicated, but boils down to ingrained preconceptions and a lack of motivation.
Plastic laboratory waste can end up in landfill when it should be recycled. (Courtesy: iStock/Eplisterra)
A common belief is that green lab practices can hamper research quality or even be bad for health and safety. “The truth is actually the opposite,” says Lewis. “For example, efficient ultralow-temperature freezers that are maintained correctly have longer lifespans and are less likely to break down, improving sample security and long-term equipment costs.” Paradise agrees. “In many cases the more environmentally sustainable approach is also the safer, more economical approach as well,” she says.
For Lewis, motivating researchers to focus on sustainability has been the hardest nut to crack. With their priority being high-quality research, many scientists simply don’t have the time to think about green practices. That is why the University of Bristol is offering students a chance to volunteer in research labs to help work through the sustainability criteria. “This benefits the students by allowing them access to research labs that they wouldn’t ordinarily have, as well as gain a knowledge of the underbelly and workings of the university,” says Lewis.
Big issues for big labs
At a different scale, making large scientific experiments and facilities – which necessarily consume vast amounts of resources and energy – more sustainable requires an even more holistic approach. The new £700m Francis Crick Institute – a huge biomedical research laboratory in central London – does this by incorporating sustainability principles into the entire design of the building. For instance, the institute uses an on-site combined heat and power system with 1700 m2 of solar panels installed on its south-facing roof. It also incorporates “plug-and-play” laboratories that ensure facilities can be shared and readily adapted to future needs, while a third of the floor area is given over to plant space. There are even roof gardens to attract wildlife.
“Our BREEAM Excellent rating was a great achievement for the design and build of the Crick,” says Rajnika Hirani, head of sustainability and business, referring to the Building Research Establishment Environmental Assessment Method – an internationally recognized certification of a building’s sustainability. “We are now going for the BREEAM In Use accreditation, which should really make a difference to the individual labs,” she adds, talking about another BREEAM rating that measures sustainable improvements through operational efficiency.
A long journey ahead
Over in Sweden all waste heat from the European Spallation Source, which is currently being built in Lund, will eventually be connected to the local heating system rather than being vented into the atmosphere. But for many big-physics labs, sustainability cannot be ingrained in the design. Take the CERN particle-physics lab near Geneva. Largely built years before sustainability was even a consideration, the thousands of huge, helium-cooled superconducting magnets and countless other components in the Large Hadron Collider (LHC) and other particle accelerators on site consume vast amounts of energy.
CERN uses around one third of the energy consumption of the canton of Geneva – equivalent to about 300,000 UK homes
Over the course of a year, the whole of CERN uses 1.3 TWh of electric energy when in operation. “We are around one third of the energy consumption of the canton of Geneva, or 0.2% of the total electrical consumption in France,” explains Frédérick Bordry, CERN’s director of accelerators and technology. This is equivalent to about 300,000 UK homes for a year. “In terms of accelerators, CERN is the biggest and therefore most energy-hungry facility in the world.” Even the magnets’ superconducting cables require as much energy to be cooled to their operating temperature (1.9 K) as they save in carrying current without resistance.
To improve CERN’s energy efficiency on a limited budget, Bordry has had to prioritize sustainability improvements. “Every time I have people come in they say, ‘Why are you not doing photovoltaics (PV) on the buildings?’” he says. “Our new buildings do have PV on the roofs and a lot of insulation, but if I have one or two million euros to spend, obviously it is better to inject it into the 90% of energy consumption [used by the machines, detectors and computing] rather than the 10% [the buildings use].”
Power hungry: The detectors at CERN are not only enormous, but consume vast amounts of energy too – and only CMS took account of energy consumption in its design. (Courtesy: CERN)
One example of this spending in action is the ongoing renovation of the PS East Experiment Area, one of the oldest and largest structures at CERN, housing multiple beam lines. “We will install new special software, and new magnets and power converters that will run in pulsed mode instead of DC mode,” says Bordry. “These will save 90% of the energy.”
CERN has also introduced design criteria for new accelerators and equipment that focus on sustainability, including the 10-year cost instead of simply the purchase price. This means that when people are upgrading or buying new equipment, they see “the consequences of their spending to inform their consciences” in the form of a “virtual invoice”.
Of course, CERN is limited in what it can do to go green. For example, the four huge and expensive detectors installed in the LHC were intended to last for the life of the facility, but only one – CMS – took account of energy consumption in its design. CERN will have to wait until the LHC’s successor – whatever that may be – is installed in the 2040s and 2050s before it can claim its flagship accelerator has any meaningful green credentials.
Equally, upgrading or replacing the other energy-hungry CERN accelerators will take time, given that some are as old as the organization itself. But with energy efficiency and sustainability now hardwired into every new purchase and decision made at CERN, it too is showing that science, however energy intensive, is taking its responsibility seriously in leading efforts to reduce our collective carbon footprint.
Top five tips to go green in the lab
(Courtesy: iStock/guruXOOX)
Turn off equipment when not in use. “Use outlet timers for equipment that has heating/cooling elements so that the equipment reaches the correct temperature before you arrive in the lab,” advises Allison Paradise, founder of My Green Lab in the US.
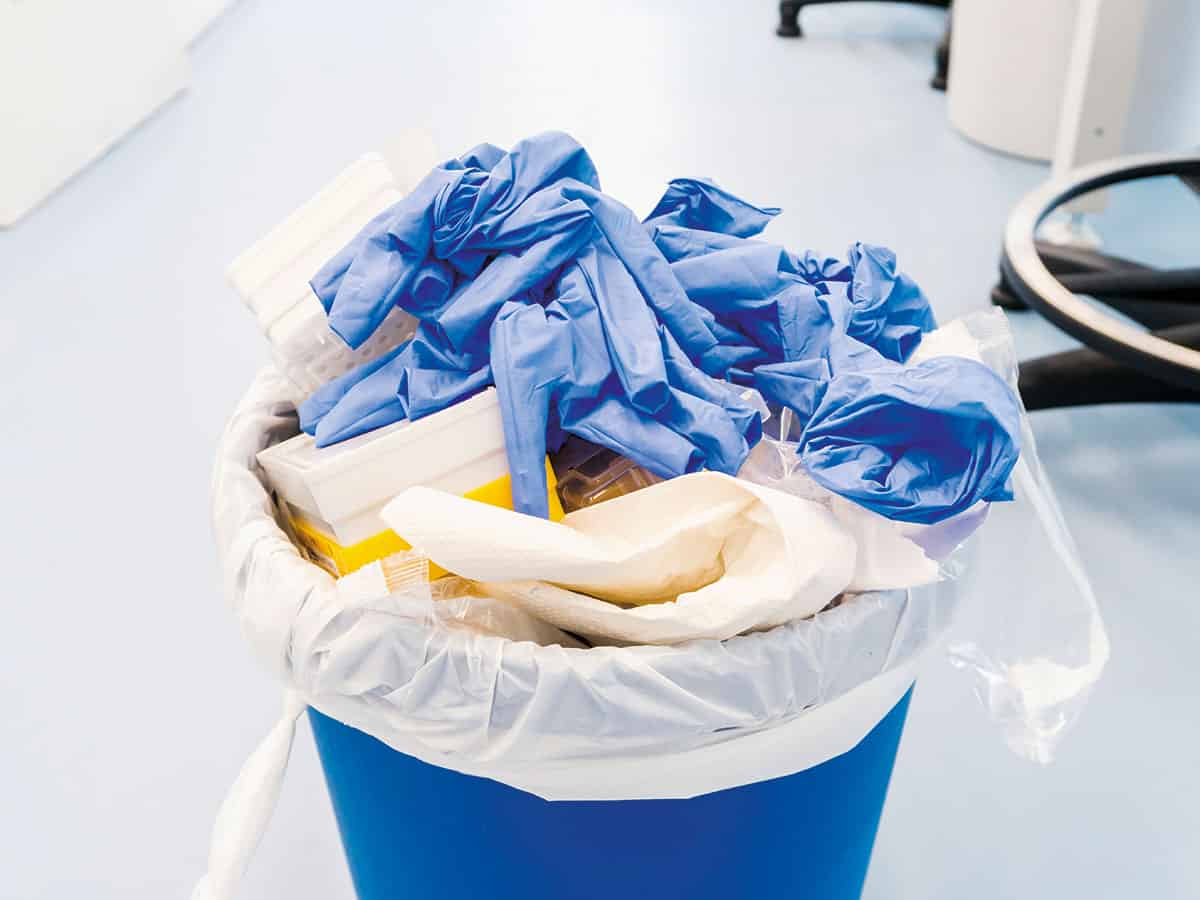
Use glassware whenever possible and take advantage of plastic and other recycling and take-back programmes. Gloves, Styrofoam coolers, water purification cartridges, packaging, pipette tips and many more items don’t have to go to landfill.
Get your lab organized. Creating and maintaining a decent inventory system allows you to remove broken equipment and expired samples, avoid replicating purchases and frees up space, meaning some equipment can be switched off.
Set up an equipment sharing, donating or renting system. “We ask lab users to share their space and equipment and check that they aren’t purchasing something that they could borrow or use from elsewhere in the university,” explains Anna Lewis, sustainable labs officer at the University of Bristol, UK.
Exchange ideas. Joining schemes such as My Green Lab, S-Lab and LEAF allows you to see what other labs and institutions are doing to improve their sustainability. “There is so much going on that we are all happy to share to collectively reduce our impact on the environment,” says Rajnika Hirani, head of sustainability and business at the Francis Crick Institute in the UK.
“If environmental policies do not account for the emissions embodied in imports, global emissions are likely to rise,” write Moinul Islam and colleagues at Kyushu University and the Research Institute for Humanity and Nature in their paper in Environmental Research Letters (ERL).
Islam and colleagues expect their results to help formulate trade policies that minimize greenhouse gas emissions for all parties. Until now, most nations and corporations have not considered embodied emissions, as they do not affect the cost of goods.
“Universal carbon taxes have been suggested to correct this,” says Shunsuke Managi. “Once introduced, firms will be motivated to seek alternative, less carbon-intensive trade partners, and total emissions will be reduced.”
Currently, governments can apply tariffs to specific commodities to protect their own industries within domestic markets. Outside specific trade agreements, however, the World Trade Organization (WTO) obliges member states to apply any given tariff to all nations without exception.
Apart from the continuing trade war between China and the US, import tariffs have generally decreased over the last few decades. Since trade boosts the global economy, this is usually seen as a positive development. Wealthier nations can also benefit in a second way: polluting industries tend to relocate to less economically developed countries, where regulations are often less stringent, bringing improvements in the wealthy nation’s local environment.
Less often considered is how trade barriers influence the carbon dioxide emissions embodied in a nation’s imports. Yet accounting for changes related to tariff regimes in this embodied carbon is crucial to planning national carbon-reduction commitments.
Estimating the emissions embodied in imports is hard because of the complexity and scale of global supply chains. Islam and colleagues turned to a continuously updated list of carbon dioxide outputs for hundreds of commercial sectors across 187 countries. From this, they compiled embodied emissions for mined and manufactured goods imported to the G20 countries between 1990 and 2013. They compared these embodied emissions to tariffs applied over the same period.
Lowering tariff barriers to trade would increase emissions embodied in imports overall, the researchers found. Economic activity is currently still coupled to carbon dioxide output, so anything that raises gross domestic product tends also to raise emissions.
The detailed picture depends on a number of additional variables, however, including the nature of a given nation’s imports, and the size of tariffs currently applied. Countries with high tariffs on carbon-intensive products are likely to see import-embodied emissions rise drastically under conditions of free trade.
Also important is the size – both geographically and economically – of the importing country. “Consumption in larger countries is greater than consumption in smaller countries,” says Keiichiro Kanemoto. “It is easy to imagine that New York imports more products – like iPhones from China – than Philadelphia does. We can say the same thing at the country level.”
Perhaps less obvious is the effect of distance between the source and destination countries. Although long-distance transport is more carbon-intensive than local trade, it also adds to the cost of the product, suppressing demand. This means that lowering tariffs on goods traded over long distances increases embodied emissions less than it does for more local routes.
Using a new Juno reference model (JRM09), scientists at Harvard University have detected that Jupiter has an internal magnetic field that changes over time. This phenomenon is known as secular variation and has previously only been detected on Earth.
The researchers – a collaboration from the US and the UK – created the new JRM09 model by taking close-up measurements of Jupiter using Juno’s magnetometer to measure the strength and direction of the magnetic field. They could then compile this data into a three-dimensional image.
By comparing the new images provided by JUNO to legacy data from between 1973-1992 using the Pioneer 10, Pioneer 11, Voyager 1 and Ulysses spacecraft, researchers were able to identify minute changes in the magnetic field over time. They found that over the 45 year time frame, there were systematic changes in Jupiter’s magnetic field.
Deeper understanding
Launched in 2011, Juno’s mission was to improve our understanding of the Solar System’s beginnings by revealing the origin and evolution of Jupiter. As it is our primary example of a giant planet, understanding the ancestry of Jupiter may shed light on how planetary systems are formed around other stars.
The magnetic field of a planetary body is thought to be described by the dynamo theory. This proposes that rotating and convecting fluid, such as iron in the Earth’s crust, is the driving force behind the field. The continuous motion of fluid causes electric currents to flow, which gives rise to a magnetic field. Jupiter has the strongest planetary magnetic field in the Solar System and understanding the secular variation, could give insights into its dynamo and by association, its internal structure.
An important question for the researchers to answer now is what is the cause of the shift in Jupiter’s magnetic field? On Earth, the change is thought to originate in the planet’s core, however the best explanation for secular variation on Jupiter is in its deep atmospheric (zonal) winds. These winds extend up to 3000 km into the surface of the planet, where the conductive metal fluid is situated. Although the origin of zonal winds is still uncertain, they are believed to interrupt the magnetic field distribution.
The discovery will likely have implications for the study of our Solar System. Kimee Moore, a graduate student from the University of Cambridge and lead author of the report on the findings, says that in the future “scientists will be able to make a planet-wide map of Jupiter’s secular variation” and this latest finding may even help “scientists studying Earth’s magnetic field, which still contains many mysteries to be solved”.
A new technique for the ultrafast imaging of nonluminous objects has been unveiled by Feng Chen and colleagues at Xi’an Jiaotong University in China. Their system captures up to 60 high-resolution images at a rate of almost 4 trillion frames per second by storing frames in overlapping subregions of a charge-couple device (CCD) array. The technique could soon be used to explore a variety of high-speed physical processes in unprecedented levels of detail.
Today’s fastest cameras use CCDs to capture the motions of molecules at speeds of over a trillion frames per second. This is done by temporarily storing consecutive image frames on separate subregions of the CCD, before moving the frames into longer-term storage. However, only a handful of consecutive frames can be captured in this way because the CCD array will quickly run out of space for new subregions – which cannot normally overlap.
In their study, Chen’s team introduce a technique called compressed ultrafast spectral-temporal (CUST) photography, which allows different subregions of a CCD to overlap. The technology comes in three modules. First, a “spectral-shaping” module selects a narrow band of wavelengths within a light pulse to be used for imaging. The pulse is then lengthened by a “pulse-stretching” module, which uses a series of lenses and diffraction gratings to create a pattern where higher frequencies lead the pulse, while lower frequencies follow behind. This ensures that the frequency of every part of the pulse corresponds with its time of arrival at the sensor – which allows images to be taken in quick succession.
Random patterns
Finally, the beam is broadened perpendicular to its direction of propagation, before hitting the CCD sensor, where specific frequencies are encoded into random binary patterns. These patterns are recorded as a series of compressed 2D images, which can then be stored in overlapping subregions of the CCD array. Later, the pattern associated with each frequency can be extracted from the array, allowing researchers to assemble a time-ordered video of the pulse.
Through CUST photography, Chen’s team could capture as many as 60 images at intervals of just 260 fs and at sub-nanometre resolution. To demonstrate these capabilities, they captured a video of a short, intense light pulse passing through a transparent solid, altering the refractive index of the material to reveal its location over time. They also took a video of a pulse leaving the same material, disappearing and being reflected by an unseen mirror, then reappearing. Finally, the researchers took a rapid series of images of a dye-filled letter A. Since each frame corresponded with a specific frequency, they could assemble a frequency spectrum of the dye.
The technology offers a new and advanced way to precisely record light propagation, reflection, and self-focusing in nonlinear media. The team says that CUST photography will also offer a simple way to measure high-speed physical processes including lattice vibrations, plasma dynamics, and chemical reactions.
The shimmering turquoise seas that surround the 7641 islands of the Philippines host a colourful array of wildlife. But there’s one spot, the Monad Shoal, that has a special claim – it’s the only place in the world where you can reliably see the pelagic thresher shark. These ocean-roaming animals – also known by their biological name Alopias pelagicus – are the smallest of the three types of thresher sharks. Typically reaching about 3 m in size, around half that length comes from their extremely long tail fins, which they use to whip and stun prey.
Lying in the Visayan Sea about 8 km from Malupascua Island, the Monad Shoal is a 1.5 km-long underwater rise, or “seamount”. In places, it comes to within 20 m of the water’s surface but drops to depths of 250 m at the edges. The pelagic thresher sharks visit this flat-topped structure to be cleaned at discrete “stations” by specialized fish that snack on the parasites infesting the sharks’ skin, gills and cloacal region (the area from which the animal excretes both urine and faeces).
The rare sharks draw tourists to the seamount from far and wide. The economic benefit of dive tourism has encouraged the local community to fund an organization called Bantay Dagat – or the “Guardians of the Sea” – to protect the sharks from being illegally fished. But the pelagic thresher sharks are highly migratory and, when they venture further afield, they find themselves being targeted for their meat, fins, skin and liver oil. Fishing lines set for smaller fish threaten them too.
Combined with the animals’ low rate of reproduction due to small litters (maximum two pups) and long gestation periods, these pressures mean that the numbers of pelagic thresher sharks are declining. Indeed, the species is listed as vulnerable by the International Union for the Conservation of Nature, which is made up of some 1400 governmental and non-governmental agencies around the world.
Roaming to the unknown
Until recently, scientists had little idea how far individual sharks that visit the seamount roam. With that in mind, Simon Oliver, a marine ecologist from the University of Chester in the UK, and his colleagues set out in 2014 to track the sharks using acoustic tagging (Biological Conservation230 58). “We decided that we needed to understand how these animals use this part of the Indo-Pacific Ocean in order to better protect them,” says Oliver, who has studied threshers for 15 years and was the first to explain why these sharks frequent the seamount.
Deep data Scientists deploying a data logger at Monad Shoal that will receive transmissions from any tagged shark swimming nearby, recording their movements, and when and where they visit particular cleaning stations. Once the experiment is over, the logger is removed from the water and the data are downloaded. (Courtesy: Mischa Schwarzmeier, Thresher Shark Research and Conservation Project)
As the sharks are sometimes skittish, the researchers couldn’t attach the tags by sending down scuba divers, whose noisy bubbles would scare the animals and prevent them from approaching the sharks closely. Instead, they used free divers (who can hold their breath for long periods) and divers on rebreathers (closed life-support systems that don’t emit bubbles). “It’s not easy,” admits Oliver when talking about attaching the tags. “We have to be within a metre of the animal and aim in to a precise muscle group behind the dorsal fin.” Indeed, it took the team three weeks to attach 14 tags.
Each tag transmitted pulses of sound – or “pings” – at a unique transmission frequency, enabling the researchers to identify individual animals. To passively track the sharks, the team used four moored submersible data loggers, each around half a metre high, placed around Monad Shoal at known cleaning stations. These instruments recorded data for 66 days, and the researchers found that each shark had favoured cleaning stations, which it would mostly visit in the early morning before moving away from the seamount.
Once a tagged shark was on the move, the team could continue to track it using acoustic telemetry. The sound emitted by the tags was picked up by a hydrophone – or underwater microphone – installed on a boat, allowing the researchers to listen in on headphones and follow the pinging sharks from above. This active tracking revealed that most sharks swim along a specific corridor that the researchers dubbed the “shark highway” on their way to forage for food – a supposition supported by depth and pressure changes recorded by the tags.
Acoustic toolbox
Sounds good Researchers listening on hydrophones to the “pings” from a travelling thresher shark tagged with an acoustic tracker to determine the routes that these animals take when they approach and leave the cleaning stations at Monad Shoal in the Philippines. (Courtesy: Thresher Shark Research and Conservation Project)
In water, sound can travel a long way, with the precise distance depending on the frequency. Indeed, low-frequency sound from baleen whale calls can travel up to 3000 km. Some animals, such as dolphins, also use sound to communicate with each other underwater, whether within their family groups or across distances to others nearby. They also use echolocation to find prey at distances of over 100 m by detecting the bounce back of the sounds that they generate.
As well as detecting the sounds animals themselves make, scientists exploit acoustic tagging, which has become a standard tool in the marine biologist’s arsenal. Indeed, researchers have been using high-frequency sound between 60 and 180 kHz to track animals underwater for more than 50 years. The smallest tags are now only 5 mm long, allowing scientists to even track juvenile fish.
Hunted hunters
The tracking also revealed that the pelagic threshers move at an average speed of nearly 4 km/h. Travelling at this rate means the sharks can in principle swim through five jurisdictions on any given day (although the tracking research did not verify this as it was too localized). Unfortunately for the animals, their degree of protection varies as they travel. In the Leyte jurisdiction, the sharks are at risk of becoming bycatch in Indian sardine fisheries or of being targeted because they foul fishing gear. In Cebu they are protected because they generate tourist revenue but may be at risk from fisheries in areas with fewer tourists. In other jurisdictions, the animals are targeted for their meat and fins. At least five territorial governments in the Philippines would have to co-ordinate their efforts if the sharks are to be effectively protected.
Oliver hopes to improve conservation measures throughout the archipelago with his Thresher Shark Research and Conservation Project. He also aims to continue investigating the thresher’s movements by using satellite tagging. The problem with acoustic monitoring is that it is only local and you need to be in a certain range to pick up the “pings”. Satellite tracking, in contrast, would allow the team to monitor the animals’ movements on a much larger scale. After attaching the satellite tags to the sharks, the scientists would have to wait patiently until the tags detach after a pre-programmed time interval of some months, then float to the surface and transmit data to a receiving satellite.
Oliver also plans to study the genetics of the local population to determine whether there is risk of inbreeding or a healthy exchange of different animals visiting the site. Thankfully, his research is supported by members of the local community, who are well aware of the importance of dive visitors who come to see the rare sharks, and make a significant contribution to the local economy.
Every once in a while you come across a website that renews your faith in the Internet. The Dumb Or Overly Forced Astronomical Acronyms Site (or DOOFAAS) site has done just that by listing a whopping 427 dodgy acronyms dreamt up by astronomers.
Classics include the bonzer CANGAROO (Collaboration between Australian and Nippon for a Gamma Ray Observatory in the Outback) and the expletive GADZOOKS! (Gadolinium Antineutrino Detector Zealously Outperforming Old Kamiokande, Super!).
Sticky tape holds a special place in the history of science because it was used by Andre Geim and Kostya Novoselov to isolate freestanding graphene – winning the University of Manchester physicists a Nobel prize a few years back.
It turns out that sticky tape itself has long fascinated physicists, as Ryan Mandelbaum explains in Gizmodo. Scientists are particularly interested in how tape peels away from a surface, which is a surprisingly complicated process to explain theoretically.
In April astronomers and astrophysicists unveiled the first-ever up-close images of the region surrounding a black hole. Now, the Perimeter Institute for Theoretical Physics (which played an important role in acquiring the images) has put together a quiz to “Test your black hole brilliance” about the images and how they were acquired.
US agencies have warned against the uncontrolled use of the new 5G spectrum band, which they say could significantly affect weather forecasting. Wireless companies that won an auction – held by the Federal Communication Commission (FCC) in March – will now begin using the 24 GHz band for 5G technology, which will operate about 100 times faster than current networks. Yet the National Oceanic and Atmospheric Administration (NOAA), part of the Department of Commerce, and NASA say that its use could interfere with the detection of water vapour in the atmosphere.
It would be like noisy neighbours moving in next door with a very loud transmitter
Jordan Gerth
The disagreement between US government departments and the mobile-phone industry over 5G use has been largely private for several months but the issue was made public in Congressional testimony on 22 May. Acting NOAA head Neil Jacobsasserted in a hearing that potential interference from 5G networks could reduce the accuracy of weather forecasts by up to 30%. That loss would leave forecasts no better than they were in 1980, Jacobs added, and it would give coastal residents two to three days fewer to prepare for impending hurricanes.
Jordan Gerth, a meteorologist from the University of Wisconsin-Madison, says that the water-vapour signal lies in the spectrum band between 23.6 and 24 GHz and that 5G transmissions could easily leak into that range. “It would be like noisy neighbours moving in next door with a very loud transmitter,” he told Physics World.
A question of sensors
Yet the Cellular Telecommunications Industry Association (CITA) – a trade association that represents the US wireless industry — disagrees. “The dire predictions right now…about the impact of 5G on current weather forecasting are wrong on the merits, on the facts, and on the process,” Brad Gillen, CITA executive vice president, wrote in a blog. “Now, in a last-ditch effort to undo five years of work and multiple administration and FCC decisions, the commerce department is misleading Congress and the press.” In the blog, Gillen says that the move to stop the use of 5G is based on protecting a weather sensor – the conical microwave imager/sounder (CMIS) — that does not exist as it never went into operation having been cancelled in 2006.
Gerth, however, says that the CMIS’s successor — the Advanced Technology Microwave Sounder (ATMS) – is in operation aboard the Suomi NPP polar-orbiting satellite and is currently working at 23.8 GHz, which is within the range of the 5G wireless transmissions once they start at 24 GHz. Yet the CTIA’s chief communications officer Nick Ludlum asserts that the ATMS is “smaller and has a wider beam width” than the cancelled CMIS sensor, which “makes it less sensitive to the nearly 5G signals”.
Many want the issue to be resolved before the World Radiocommunication Conference, which will begin on 28 October in Sharm El-Sheikh, Egypt. That meeting is set to debate the future and growth of 5G radio technology and it is hoped that the US agencies will have settled the argument by then and will have put forward a unified proposal. One potential compromise, which Congress is exploring, would permit 5G telecommunications at 24 GHz but set a limit on their volume.
Meanwhile, forecasters express concern that the growth of 5G could threaten other spectrum bands. Gerth says that fresh debates may emerge around the use of 36-37 GHz, which is utilized to spot rain and snow or 50 GHz that detects atmospheric temperature. “It’s not as if 5G has to go into 24 GHz or nobody gets it,” he adds. “There’s plenty of spectrum away from the weather bands.”
A new platform to image single molecules in 3D could allow researchers to investigate complex biomolecular interactions within biological cells. The platform, which uses spectroscopic single-molecule localization microscopy (sSMLM) improved with a two-mirror system, can image molecules at much greater depths than was possible before.
Spectroscopic single-molecule localization microscopy is a relatively new extension of super-resolution microscopy and it can provide information on where molecules are located in space and how these molecules interact with light. Since sSMLM records the full fluorescent spectra of emission from all the molecules in a sample, it can, in principle, differentiate unlimited numbers of molecular species within a predetermined spectral range.
The system fundamentally suffers from a limited photon budget, however, because the emitted photons have to be divided into two independent channels for spatial and spectral imaging. This means that it is challenging to localize molecules in 3D using sSMLM in its current form.
A pair of mirrors improves sSMLM
Researchers from Northwestern University led by Hao F. Zhang and Cheng Sun have now improved this platform by combining existing sSMLM with a pair of mirrors, so allowing it to image molecules in 3D at a much greater depth without inducing additional photon loss.
To extend sSMLM to 3D, the researchers initially tried adding a cylindrical lens into the spatial imaging channel, but the inherent astigmatism of the lens makes it difficult to calibrate the light spectra of different molecules and produces non-uniform lateral resolution at different depths.
“The two mirrors work by introducing an optical path length difference between the spatial and spectral imaging channels that improves the way the system exploits photons,” explains Zhang. Unlike a lens, a mirror does not generally attenuate the light it reflects, which means that more photons can be used to create a sharper image and extend imaging into the 3D-depth range.
Detecting single molecular emission
“The optical path length difference in fact generates different focal planes for spatial and spectral imaging and we are thus able to detect single molecular light emission with different point-spread-function sizes in the spatial and spectral imaging channels,” he says. “We encode the depth information of individual molecules as the difference between the point-spread-functions and retrieve this information using a pre-determined calibration curve directly correlated with the optical path difference.”
The new system can detect the minute differences in molecular emission from every different molecule in a sample and analyse the spectra of these molecules to differentiate between them. It can be used to image molecules and biomolecules, such as DNA, RNA and proteins that can be labelled with fluorescent tags, says Zhang. Any nanoparticles that blink can also be used as an imaging agent.
A lateral spatial precision of 20 nm
Indeed, the researchers have already used their technique to image microtubules and mitochondria in COS-7 cells immuno-stained with Alexa Fluor 647 and CF 660C dyes. They showed that they could image the structures with a lateral spatial precision of 20 nm at an average photon count of 560, and a spectral precision of 4 nm at an average photon count of 1250. The spatial resolution in the vertical direction is 50 nm.
“The new platform will allow researchers to investigate complex biomolecular interactions within cells, particularly those related to transcription processes, and understand how their spatial organization impacts specific molecular biology/biochemistry mechanisms associated with diseases,” Zhang tells Physics World. “For instance, we are now characterizing how proteins are arranged in nuclear pore complexes, which are the nanochannels that transport genetic information across the nuclear envelope to the cytoplasm. Our technique will allow us to simultaneously detect multiple subunits in the nuclear pore complex in 3D.”
The researchers, reporting their work in Optica, are now trying to further push the limit of spatial resolution in their technique by looking for new way ways to correlate the spatial and spectral information obtained. “We would also like to understand the fundamental limits of this resolution,” says Zhang.
Continuous-variable quantum key distribution (CV-QKD) systems in China have shattered distance and speed records when implemented on commercial fibre networks. Operating in two cities, the systems distributed cryptography keys up to 50 km (three times further than the previous record) and with secret-key transmission rates more than 100 times faster than previous systems.
Quantum key distribution (QKD) involves two people (usually called Alice and Bob) sharing a secret key that they can use to encode and decode messages. The key is encoded into a string of quantum entities (usually photons), so that any eavesdropper (Eve) attempting to copy the key as it passes from Alice to Bob reveals her presence by virtue of the laws of quantum mechanics. These laws dictate that the act of measuring affects the system being measured.
In CV-QKD, the quantum key is encoded in the phases of weak coherent laser pulses – the phases being continuous variables. CV-QKD offers several benefits over early implementations of QKD, which used single photons. CV-QKD can be implemented using standard optical telecoms components, for example, and can also operate at higher secret-key transmission rates on city-sized (metropolitan) networks.
Dark fibre links
In this latest demonstration, Hung Guo, Yichen Zhang, Song Yu and colleagues at Peking University and Beijing University of Posts and Telecommunications operated CV-QKD systems in Xi’an and Guangzhou using commercial fibre links. In both cases the links were “dark”, which means that they carried no other telecoms traffic during the tests.
In Xi’an the team transmitted secret keys a distance of 30 km, whereas nearly 50 km transmission was achieved in Guangzhou – smashing the previous record of just over 17 km for CV-QKD over commercial fibre. Although quantum cryptography has previously been achieved over distances of hundreds of kilometres, these demonstrations were done on dedicated fibres rather than on commercially-deployed telecoms links.
A secret key transmission rate of about 6 kilobits per second (kps) was achieved, much faster than the previous record of about 0.3 kps.
The ability to operate CV-QKD on commercial networks will be crucial to the widespread adoption of the technology – which Guo says could be used to protect banking information, email messages and passwords. However, quantum information is very fragile and this makes deploying CV-QKD in a commercial network is a significant challenge.
“Deployed commercial dark fibres are inevitably subject to much stronger perturbations from changing environmental conditions and physical stress,” explain Zhang and Yu, adding, “This in turn causes severe disturbances of the transmitted quantum states”. They add that the networks, “also suffer from higher losses due to splices, sharp bends and inter-fibre couplings”.