Battle of the elements: silicon builds digital revolution from sand

Silicon is the element that driven the biggest changes in our modern lives. Silicon chips in computers, phones, and all sorts of other gadgets have revolutionized both the way we work and the way we play, while optical fibres made from silica criss-cross the globe to create the communication networks at the heart of our connected world.

Yet this digital revolution is only a very recent phenomenon. As a school student in the early 1980s, I remember the excitement surrounding our very first “computer suite” – a narrow room reclaimed from the back of a maths classroom that was equipped with a Commodore PET, two BBC Micros and a printer. It all seemed very futuristic, even if all we did was to experiment with infinite GOTO loops and play primitive games on the monochrome screens, but little did we know then how the computer chip would transform our lives.

Into the solid state

The power of silicon electronics stems, of course, from the element’s semiconducting properties, which allows solid-state devices to be created that can be switched repeatedly between  “on” and “off” states. But silicon is not the best electronic material – germanium, for example, supports faster electron transport, and was a serious rival to silicon when semiconducting transistors were being developed in the 1950s. Silicon, though, has important advantages for mass-market adoption: it is cheap and plentiful – with silicon being the second most abundant element in the Earth’s crust – and thin insulating layers needed for transistor structures are easy to make by heating silicon wafers in a furnace to form stable silicon dioxide.

The first silicon transistor to operate at faster speeds than germanium was demonstrated in 1961 by physicist Jean Hoerni of Fairchild Semiconductor, who added gold dopants to control and enhance silicon’s natural electronic properties. Hoerni’s work was funded by Cray, who went on to build the world’s first supercomputer from 600,000 individual transistors that were packaged in a specially designed module to minimize connection lengths.

But it was the emergence of silicon integrated circuits in the early 1960s that brought computers into the mainstream. The number of components that could be combined on a single chip first doubled every year, and then from 1975 once every two years – as predicted by Gordon Moore, who was Fairchild’s director for R&D. Moore’s Law has since then become a self-fulfilling prophecy that has driven continued innovation in the silicon industry, with the latest designs using nanoscale fabrication techniques to cram more than a billion transistors onto a single chip.

The manufacturing capability and low cost of silicon microelectronics has spawned other applications too. Solar cells made of crystalline silicon dominate the photovoltaics market, accounting for more than 90% of installed devices, even though silicon’s less-than-perfect optical properties limit conversion efficiencies to around 20%. And researchers are pushing the boundaries of what’s possible with silicon photonics, developing all-optical chips that would boost transmission speeds for datacoms and on-chip interconnects, and recent work has exploited silicon to demonstrate the building blocks of quantum processors.

Purity and abundance drives applications

Critical to these high-tech applications is the ability to create ultrapure silicon wafers. Enormous cylindrical ingots, or “boules”, of almost defect-free single-crystal silicon can be formed by pulling a seed crystal from molten silicon, and these boules are then sliced and polished to form wafers up to 450 mm in diameter. Dopants can also be added to the melt, providing engineers with precise control over the wafers’ electronic properties.

But only a small percentage of elemental silicon is produced with such high purity. Other applications, which include metals manufacturing and the production of chemicals such as silicones, can tolerate higher impurity levels and can be produced using cheaper industrial processes.

Meanwhile, the vast majority of silicon used in everyday life exploits its natural form, with crystalline silicon dioxide – in the form of sand and quartz – making up about 12% of the Earth’s crust. This silica is chemically inert and has a high melting point, making it a popular ingredient in construction materials, ceramics, food, and cosmetics – and even the little sachets that remove moisture from packaged goods.

Silica can also be transformed into glass, which is made by heating sand to around 1600 °C and then cooling it quickly to form an amorphous solid. Pure silica glass is mainly used for demanding applications that demand high thermal resistance and chemical stability, such crucibles and furnace tubes, while the glassware found in science labs typically contains about 80% silicon dioxide.

Into the Internet

More recently, silica glass has found new importance as the material of choice for most of the optical fibre used in today’s communications networks. Silica offers good optical transmission at the telecoms wavelengths of 1.55 µm, but it wasn’t until 1986 – when David Payne of the University of Southampton and Emmanuel Desurvire at Bell Labs invented the erbium-doped fibre amplifier – that all-optical systems became a viable option for inter-continental links. Combined with the invention of wavelength-division multiplexing, which allows multiple optical signals to be transmitted through a single fibre, these all-optical systems enabled telecoms companies to double the capacity every six months between 1992 and 2001, by which time the data rate had reached 10 Tb/s.

Silicon, then, has not only allowed device engineers to pack more computer power into ever smaller devices, but has also delivered the high-speed data links that enable us to stay connected, to collect and process vast amounts of scientific data, and to stream videos on our phones. And even more astounding is that this high-tech world is, quite literally, based on sand. For this reason, silicon gets my vote.

What’s your favourite element? Contact us at pwld@ioppublishing.org with your pick – and the reason why – or via Twitter using the hashtag #battleofelements.
Dual-energy CT for proton therapy planning reaches the clinic

Researchers at OncoRay in Dresden have introduced a technique for more accurate proton therapy planning into routine clinical use for the first time. From April 2019 onwards, they are implementing a novel, patient-specific method of proton range prediction based on dual-energy CT (DECT).

Acquiring images at two X-ray energies allows patients’ tissue properties to be measured more directly, leading to more accurate estimates of proton range. As a result, treatment margins can be shrunk by as much as 40%, reducing radiation damage to healthy tissue surrounding the tumour and making proton therapy even more tolerable.

The advantage of proton therapy over conventional X-ray radiotherapy lies in the narrowness of the particle’s Bragg peak — the distance over which it deposits its energy in a medium. Whereas the energy delivered by photons falls off gradually with distance, the dose distribution for charged particles like protons rises sharply beyond a certain depth, and then drops even more suddenly. The exact position and shape of the peak depend on the initial velocity of the particles in the beam, and on the properties of the tissue along its trajectory.

This difference between the behaviour of photons and charged particles means that proton dose patterns can be tailored to fit the shape of the tumour, sparing nearby tissue and organs. Unfortunately, it also means that translating planning images made using X-rays into dose maps for protons is not a simple operation.

Typically, medical physicists use a look-up table to convert X-ray radiopacity (CT number) into proton stopping power ratio (SPR), but this introduces into the process an uncertainty that can only be managed by expanding the volume of irradiated tissue — otherwise parts of the tumour might escape treatment. The unavoidable tradeoff is that some surrounding healthy tissue is bound to be irradiated too, increasing the risk of damage to organs and triggering secondary cancers later in life.

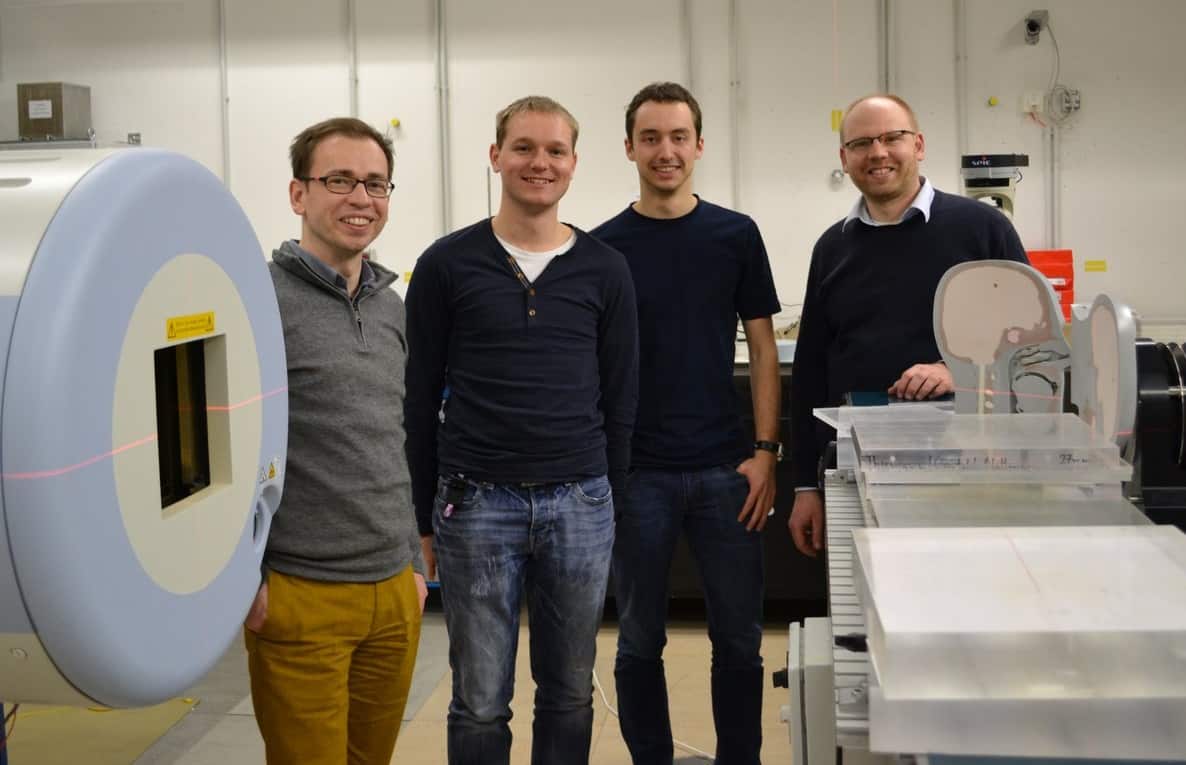
Christian Richter and colleagues from OncoRay introduced DECT for proton treatment planning at the University Proton Therapy Dresden (UPTD) in 2015. The technique yielded higher-quality images compared with single-energy scans, but standard look-up tables were still used for range prediction. Later, Richter and his translational research team used the growing database of clinical DECT scans to evaluate the clinical benefit of a more sophisticated, patient-specific method of range prediction.

DirectSPR team

Direct determination

When X-rays interact with tissue, photons can be either scattered or absorbed. The strength of each effect depends on two material properties — relative electron density (RED) and effective atomic number (EAN). The contributions made by each of these attributes vary independently according to the photon energy, so capturing images at two different X-ray energies provides two sets of complementary data.

“Simplistically speaking, with one scan, we can determine one unknown. With two non-identical scans we can determine two quantities,” says Richter. This extra information allows RED and EAN, both important input parameters for calculating SPR, to be determined directly instead of relying on approximations.

Working with colleagues from the German Cancer Research Center (DKFZ) in Heidelberg, the OncoRay team validated the accuracy of the new approach, called DirectSPR, in a phantom and biological tissues, and found that safety margins around the treatment volume could be reduced by 35–40%. The reduced margins achieved with DirectSPR are now applied clinically at UPTD. “The range accuracy, which has remained practically unchanged for more than 30 years, is thus for the first time significantly improved,” says Richter.

Because the two scans are captured sequentially, DirectSPR is so far limited to static regions such as the head and pelvis; images taken of the chest would be too badly compromised by movement between acquisitions. Richter and colleagues have shown, though, that the technique is compatible with 4DCT — in which patient motion is recorded as a video sequence — so DirectSPR could be used in thoracic cancers soon.

For the time being, DirectSPR is available only in Dresden, where it has entered into routine operation. Although the method could in principle be employed using any DECT system, Richter and his team are collaborating with Siemens Healthineers to develop a commercial version for release this year, in which the DirectSPR calculation is integrated with the CT software.

Changing rainfall poses dilemma on dams

For the builders of hydro-electric schemes – usually multi-billion dollar projects involving vast amounts of complex engineering work – changing rainfall is a serious problem.

With climate change either on the horizon or already happening in many regions of the world, rainfall patterns, on which hydro schemes ultimately depend, are becoming ever more unpredictable.

Christian Rynning-Tonnesen is CEO of Statkraft AS, Norway’s biggest power producer and a major player in the international hydro power business.

In an interview with the Bloomberg news agency, Rynning-Tonnesen says his company has had to double its spending over the last 10 years to reinforce dams in order to cope with heavier rains. He says climate change is hard to ignore when you’re in the hydro-electric business.

“The general trend all over the world is areas that are dry become more dry and areas that are wet become more wet.”

Norway has seen a 5% rise in rainfall over recent years, says Rynning-Tonnesen.

Others say planning processes behind dam building have to be revised in the face of climate change.

Emilio Moran, a visiting professor at the University of Campinas in São Paulo state in Brazil, says that in one of the world’s biggest hydro-electric building programmes, a total of 147 dams have been planned in the Amazon Basin, with 65 of them in Brazil.

Output fears

In a study published in the Proceedings of the National Academy of Sciences journal, Moran and his co-authors say many of the dams in Brazil − either completed or still in the planning stages − are likely to produce far less power than anticipated, owing to climate variability.

The Amazon Basin is predicted to receive less rainfall and to be hit with higher temperatures in future.

“Depending on water as the main source of power in future when we’ll have less of this natural resource looks like an unreliable strategy”, says Moran.

“To reduce its vulnerability with regard to energy in the context of global climate change, Brazil must diversify its energy mix. It’s still too dependent on hydro-electricity. It needs to invest more in other renewable sources, such as solar, biomass and wind.”

Rainfall drops

Deforestation is expected to create further water shortage problems for hydro plants in the Amazon region. About half the area’s rainfall is due to recycling within the forest.

“Deforestation will, therefore, lead to less precipitation in the region aside from the expected decline due to global climate change”, say the study’s authors.

They say that if the building of large dams in developing countries is to continue, full consideration has to be given to their social impact, the overall cost to the environment and to climate change.

International tensions

In many cases, this doesn’t seem to be happening. Turkey is spending billions on ambitious dam building projects on the Euphrates and Tigris rivers in the south-east of the country. Climate change is predicted to alter the amounts of water available to drive the operation of these dams.

The rivers flow onwards into Syria and Iraq: already water flows downstream are severely reduced at certain times of the year, creating regional tensions and putting in jeopardy the livelihoods of millions dependent on the rivers for drinking water and for agricultural production.

One of the world’s biggest dam projects is in East Africa − the Grand Ethiopian Renaissance Dam (GERD) on the Blue Nile, which flows into the Nile itself. Ethiopia wants to sell electricity generated by the dam to neighbouring countries.

Critics of the GERD project say climate change, including reduced rainfall in the Blue Nile’s catchment area, could seriously affect the dam’s generating capability.

Google reignites the cold fusion debate and Oxfordshire boasts its quantum credentials

In this episode of the Physics World Weekly podcast, we’re focussing on quantum physics and the contentious idea of cold fusion. First up, Anna Demming reports on her trip to the House of Commons in London, where she attended a special event about Quantum Technologies in Oxfordshire. Later in the show, we bring a discussion of some of the other research highlights making the headlines this week. That includes the news that Google and several research institutes in North America have reopened what they call the “cold case” of cold fusion. Despite the many failures to observe cold fusion, the scientists maintain that the case is not yet closed.

If you like what you hear then please subscribe via your chosen podcast app and we’re also available now to follow on Spotify.

Magnetic microrobots line up for stem cell therapy

Microrobots

Researchers from South Korea and Switzerland have developed magnetically actuated microrobots and used them for precise stem cell delivery and transplantation in vitro, ex vivo and in vivo. They also demonstrated that the microrobots could transport cancer cells through a body-on-a-chip model of a liver tumour network (Sci. Robot. 10.1126/scirobotics.aav4317).

Stem cell therapy is an emerging method for restoring damaged tissues or treating a variety of diseases, from cancer to degenerative neural disorders like Alzheimer’s disease. Precise delivery of stem cells to the desired target is, however, crucial for the success of transplantation. Small, minimally invasive and wirelessly controlled, magnetic microrobots have ideal qualities for use in stem cell therapy, but must be further improved before application in the clinic, the authors say.

In this work, Sungwoong Jeon from the DGIST-ETH Microrobotics Research Center and colleagues combined various pre-existing strategies of biocompatible microrobotic design to create spherical and helical microrobots. Fabricated by 3D laser lithography, the microrobots’ porous structure facilitates the attachment, proliferation and differentiation of various stem cells.

Upon application of a rotating magnetic field, the spherical and helical microrobots respectively exhibited rolling and corkscrew motions that propelled them through 3D spaces — such as a blood vessel isolated from a rat brain and a ventricle within a slice of mouse brain — enabling precise targeting of transplanted stem cells. The authors note that propulsion via rolling or corkscrewing motion is more efficient than that generated by a pulling motion and, as such, is more suitable for use in biological fluids.

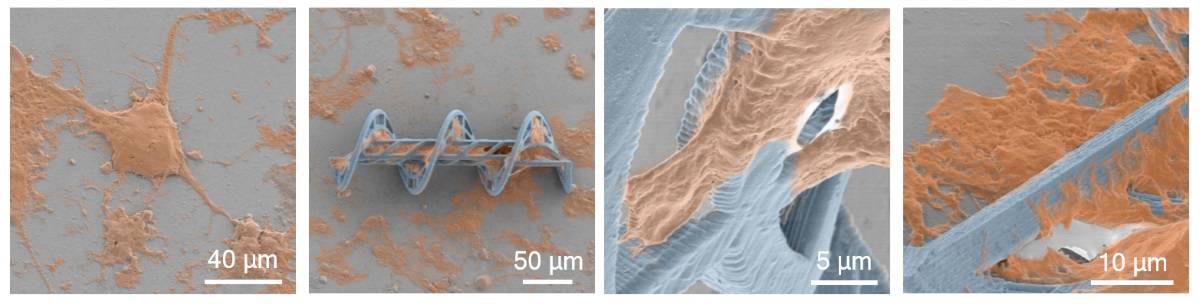
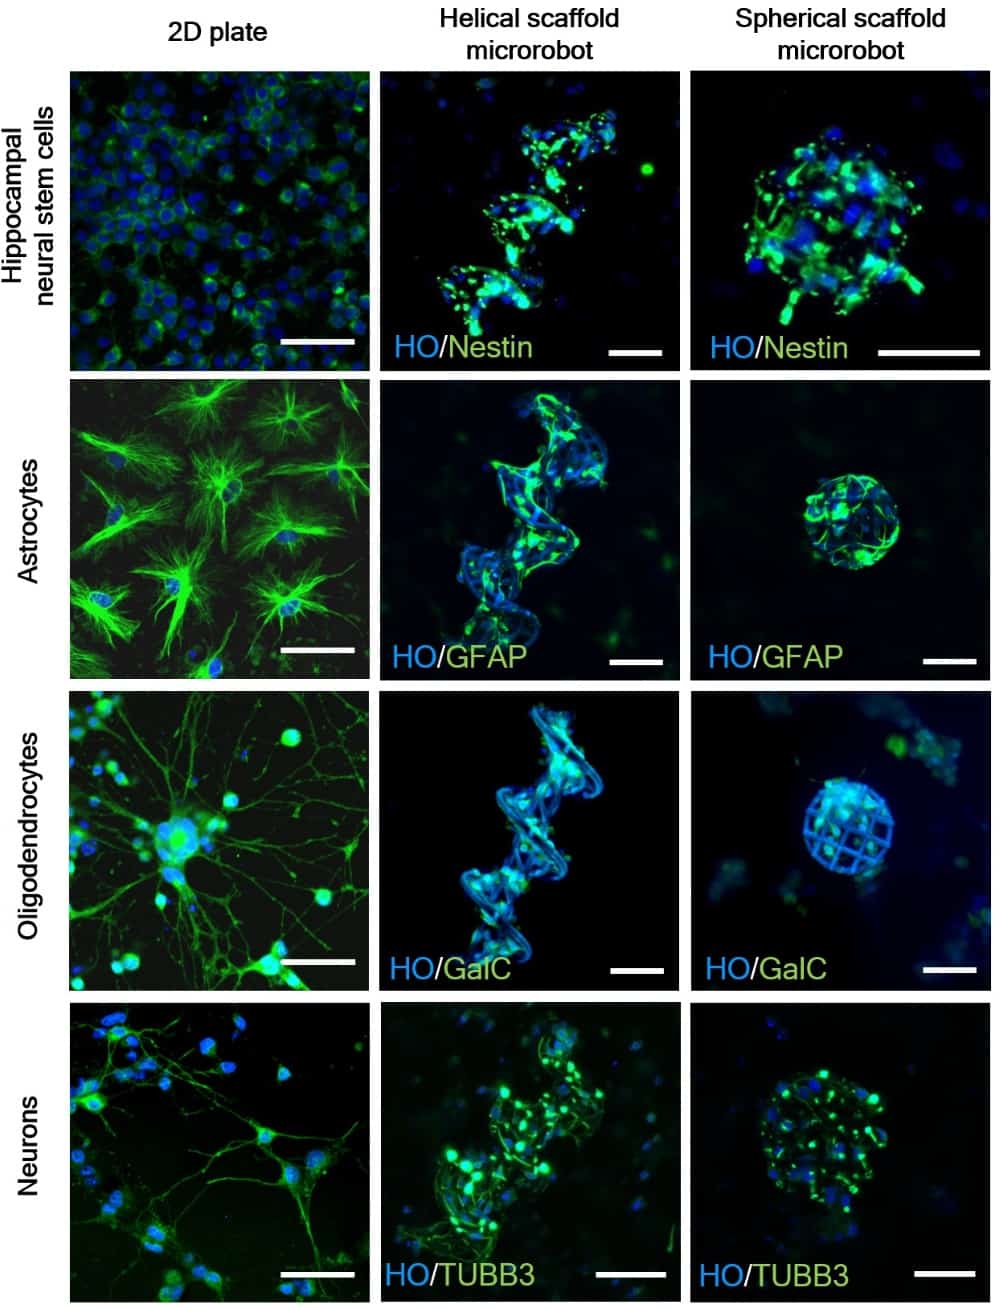
The researchers examined hippocampal neural stem cells (NSCs) grown on the microrobots. Immunofluorescence staining showed that, after 72 hours, NSCs on the microrobots differentiated into astrocytes, oligodendrocytes and neurons. Scanning electron microscopy revealed that the differentiated neurons became attached to and entangled with the microrobot scaffolds. The team also demonstrated magnetic manipulation of helical and spherical microrobots with attached hippocampal NSCs.

Neural stem cells

Next, Jeon and colleagues established the feasibility of targeted cell delivery using microrobots loaded with human colon cancer cells in a body-on-a-chip microfluidic cell culture platform that mimics parts of a liver tumour network. Applying an external magnetic field enabled the microrobots to be moved to a target location in the body-on-a-chip.

Finally, the team demonstrated in vivo stem cell transportation using the microrobots in a live nude mouse. They cultured mesenchymal stem cells derived from the human nose on spherical microrobots for transplantation in the mouse, and showed that an externally applied magnetic field could manipulate the cell-loaded microrobots within the animal’s hollow abdominal cavity.

These results confirm the feasibility of using microrobots for targeted stem cell transportation and transplantation in various physiological fluidic environments. In future work, the researchers hope to improve the controllability of the microrobots and reduce the strength of the magnetic field required to manoeuvre them.

Warm weather drives Antarctic krill south

Populations of Antarctic krill (Euphausia superba) in the Southern Ocean’s southwest Atlantic sector have moved south since the early 20th century, researchers have found.

The latitude marking the species’ mean north–south distribution was 57°S in the early 20th century but is 61°S today. That change has been accompanied by a drop in krill density, and an even steeper decline in the population of juvenile krill.

Angus Atkinson of Plymouth Marine University, UK, Simeon Hill of the British Antarctic Survey and colleagues from Canada, Germany and the UK mapped the krill’s movements from 1926 onwards using catch data from thousands of samples in KRILLBASE.

The researchers attribute these effects to a change in the weather brought about by a band of circumpolar winds shifting periodically towards the south. Since the 1920s the Southern Annular Mode (SAM) – an index of atmospheric circulation – has seen more positive anomalies, bringing warm, cloudy and windy conditions to the Southern Ocean and later formation of sea ice. How exactly this affects krill egg production and larvae survival is still uncertain.

“We do not know exactly what the mechanisms are at this stage, but we found that this link between SAM and krill density held throughout the austral summer, autumn and winter,” says Atkinson.

The researcher speculates that overcast skies and greater ocean mixing limit the availability of phytoplankton for larvae to feed on during the summer. Then, late ice formation in autumn leads to fewer sea-ice algae to eat during winter.

The poles are forecast to warm disproportionately as climate changes. Antarctic krill are especially sensitive to temperature but because lines of longitude converge at these latitudes, moving south into colder water means occupying ever-smaller habitat.

Krill populations have already become concentrated on the coast of the Antarctic Peninsula. Further southward movement will eventually be blocked by the greater Antarctic continent. What will happen if warming oceans and diminishing sea ice restrict krill to the continental shelf?

“This is not known,” says Atkinson. “The larvae historically tend to be found over deeper water (more than a kilometre), suggesting that krill really do need access or proximity to deep water to spawn successfully.”

“Our results suggest that southern areas have been relatively resilient to these changes and that juvenile krill can still be plentiful in some years,” Hill adds. “These differences offer some hope that krill and its predators will survive into the future. Nonetheless, this is a clear sign that ecosystems can change rapidly in a changing climate.”

Antarctic krill is found throughout the Southern Ocean but is especially common in the southwestern part of the Atlantic. Not only is the creature a crucial component of marine food webs – its huge total biomass directly or indirectly supports all of the region’s large animal species – but its digestive processes fertilize the oceans by mobilizing iron bound up in glacial sediment.

Angus Atkinson and colleagues reported their findings in Nature Climate Change.

Sensor-covered glove could lead to better prosthetic hands

A glove that measures how a person grasps, feels and weighs objects has been unveiled by researchers at the Massachusetts Institute of Technology in the US. The low-cost device has hundreds of pressure sensors, which produce a sequence of high-resolution “pressure maps” when a wearer manipulates an object. The maps are fed into an artificial-intelligence system, which can recognize objects being held in the glove.

As well as providing important information about how the hand works, the research could also help with the design of prosthetic hands, robotic graspers and human-machine interfaces.

Created by Subramanian Sundaram and colleagues, the glove is made from a fabric that is coated with a polymer with an electrical resistance that changes when pressure is applied to it. The fingers, thumb and palm are crisscrossed by 64 conducting threads creating 548 junctions where the conductivity of the polymer – and hence the local pressure on the glove – can be measured. The data output of the glove is a 32×32 pixel “pressure map” that records the pressure at each pixel on grey scale of about 150 gradations. Data are acquired at a rate of 7.3 frames per second and the glove cost about $10 to make and readout electronics cost and additional $100.

Tactile database

The glove was used to acquire a “tactile database” of 135,000 pressure maps. This was done by having the wearer manipulate 26 everyday objects in one hand in sessions that lasted 3-5 min. The items included a pair of scissors, a roll of tape, a mug and a drinks can.

To identify objects, the team created a convolutional neural network (CNN), which is a type of artificial-intelligence system that is used to classify images. The CNN was designed to mimic how a person can identify an object by grasping in several different ways. Holding a roll of tape across its full diameter as well as grasping it by its much thinner ring, for example.

“Humans can identify and handle objects well because we have tactile feedback. As we touch objects, we feel around and realize what they are. Robots don’t have that rich feedback,” says Sundaram.

When evaluating an object, the CNN first groups similar pressure maps together into clusters – with each cluster corresponding to a specific grasp of the object. Then, a representative map from each of the clusters is selected to create a set of maps that are associated with a specific object. Finally, the CNN is trained to recognize a manipulated object by comparing the object’s pressure maps to the sets of representative maps.

Pressure drop

To estimate the weight of an object, the team created a separate data set of 11,600 pressure maps that were acquired while objects where picked-up, held and then dropped. In this case the CNN was trained to calculate the weight of the object from the pressure required to hold it.

According to the team, the system is able to recognize objects being manipulated with an accuracy of 76% and determine their weights to within about 60 g.

The glove also provided insights into how different parts of the hand work together to perform certain tasks. They found that when a subject uses the middle joint of their index finger, for example, they rarely use their thumb. Conversely, they found that using the tips of the index and middle fingers always corresponds to thumb usage. “We quantifiably show, for the first time, that, if I’m using one part of my hand, how likely I am to use another part of my hand,” says Sundaram.

The research could help engineers mimic the function of the hand to create better prostheses and robotic graspers. Covering mechanical hands with tactile gloves could give the devices a sense of touch and allow them to operate in a more life-like manner. In addition, computer-vision algorithms could be adapted for use with the glove, leading to new technologies involving tactile sensing.

The glove is described in Nature.

Thermal spectrum of analogue black hole puts Hawking radiation in a new light

Physicists in Israel have shown that radiation from an analogue black hole has a thermal spectrum. This allows them to assign the “black hole” a temperature, providing indirect experimental evidence for the existence of Hawking radiation.

The popular conception of a black hole is a remorseless cosmic vacuum cleaner that sucks everything in and lets nothing – not even light – escape. When quantum mechanics is added to the mix, however, things get more complicated. In 1974, Stephen Hawking showed theoretically that pairs of photons are created at a black hole’s event horizon – one with positive energy and one with negative energy. The negative energy photon is drawn into the black hole, whereas the positive energy photon is emitted into space. This provides a steady energy flux from the black hole.

The theoretical implications of this are revolutionary, because it suggests that black holes have temperatures. Temperature is defined in statistical mechanics by the average energy in a system that has a large number of degrees of freedom (such as a gas comprising many molecules). In Einstein’s general theory of relativity, however, a black hole is defined purely by its mass, charge and spin. Assigning a black hole a temperature, therefore, requires either giving it additional degrees of freedom or redefining the concept of temperature itself.

Major accomplishment

Detecting Hawking radiation from a black hole would therefore be a major accomplishment – but also a near-impossible task. The problem is that all known black holes have predicted temperatures below the temperature of the cosmic microwave background. This means that any radiation black holes emit would be masked by the radiation they absorb.

One way forward is the fact that the equations governing general relativity are mathematically analogous to those describing wave propagation in moving media. In 1981, William Unruh of the University of British Columbia in Canada showed theoretically that such systems should exhibit Hawking radiation. Several groups have since tried to simulate Hawking radiation using water waves, light in fibre optics and various other systems, but these experiments are fraught with difficulty. Some reported observations of Hawking radiation have later been shown to be erroneous, whereas other claims are still disputed.

For several years, Jeff Steinhauer and colleagues at Technion in Haifa have worked on black-hole analogues that are based on Bose-Einstein condensates – which are ultracold ensembles of trapped atoms. On the high side of a potential-energy step, Steinhauer’s condensate flows slowly. At the low-energy side of the step, however, the flow speeds up. Either side of this “sonic horizon”, pairs of phonons (quanta of sound waves) are created. Above the step, the speed of the sound in the condensate is greater than the speed of the condensate itself, so the phonon escapes. Below the step, however, the sound speed is lower than the condensate’s flow speed. This phonon is therefore swept inexorably into an analogue “black hole”.

Quantum entanglement

In 2014, Steinhauer claimed to have observed self-amplifying Hawking radiation from an analogue black hole with two horizons. Subsequently, in 2016, he detected quantum entanglement between the emitted waves and the waves swept into the black hole. In both these cases, however, there have been sceptics. “His experimental demonstration of a black hole laser was actually something completely different,” says Ulf Leonhardt of the Weizmann Institute of Science, also in Israel, who studies black hole analogues in optical fibres; “And I did a re-analysis of his 2016 paper, concluding what he had seen was a statistical artefact.”

To demonstrate the phenomenon conclusively, Steinhauer’s team made 21 improvements to the experiment over almost three years. As a result, they could measure the energy emitted at each different frequency and show that the radiation had the energy spectrum of a black body, with a well-defined temperature.

Important step

Leonhardt is convinced: “I really congratulate Jeff on his work, which is an important step for the community. It’s something he should be proud of and something we should all celebrate as an excellent paper.”

Theoretical physicist James Anglin of the University of Kaiserslautern in Germany agrees, but he suspects that insight into real black holes will not come from such a clean system as Steinhauer’s. “The truth is that all the important mysteries about quantum effects with black holes are about nonlinear dynamics,” he says. “So what I’d really like to see next would in some ways be a step back from what Jeff has heroically done: to let nonlinear effects in a sonic black hole do some damage, and see just what damage they do.”

Anglin adds that this could help answer important questions about black hole physics such as: “Does emitting thermal radiation make black holes shrink? If so, does the information trapped inside the black hole come back out during shrinking, does the shrinking stop at some remnant quantum object that still holds all the information, or does the information just die? Does the black hole surface area really count as entropy? Is there a deep connection between quantum mechanics, thermodynamics, and gravity?”

The research is described in Nature.

Views differ on renewable energy futures

As ever, BP’s annual Energy Outlook has renewable energy making only a small primary energy contribution – around 4 billion tonnes of oil equivalent by 2040, i.e. 15% or, including hydro, 22% combined. Non-hydro new renewables do grow rapidly in its scenario, faster than anything else, and coal and oil take a big dive, but gas remains king. Nuclear stays low. But even in BP’s rapid transitions scenario, by 2040 renewables still only hit 29% of global energy (38% with hydro).

To put all this in perspective, IRENA, the International Renewable Energy Agency, looks to renewables supplying around 60% of total primary global energy by 2050. BP’s projections look a bit better in power terms — nearly 30% excluding hydro by 2040 (maybe 46% with hydro), but they’re still well behind the electricity projections from IRENA (85%) and even the IEA (around 70%), especially since electricity demand fell in 18 out of 30 IEA member countries over the period 2010-2017. Obviously, as the IEA keeps saying, we will also need heat and power, as well as a lot of energy saving, but IRENA says renewables, along with efficiency, can help us make 90% of the emission cuts needed to keep below 2 °C by 2050.

That’s very different from the gloomy scenario painted in Jeremy Grantham’s grim GMO white paper: renewables will boom, but not fast enough to avert climate change. BP says basically the same. They do look at scenarios with more of a push on carbon dioxide reduction and with less globalization. But the main message in both studies is that, in all cases, though renewables boom and dominate, fossil fuel will still be large. And so BP’s central scenario expects carbon emissions to grow 10% by 2040, as world energy demand grows by a third and fossil fuels continue to play a key role.

Views clearly differ. IRENA’s recent publication A New World – The Geopolitics of the Energy Transformation is very optimistic, with IRENA’s director general saying that a transition from fossil fuels is “a move away from the politics of scarcity and conflict to abundance and peace with new opportunities for many countries”. Certainly, the geographic concentration of fossil fuels in just a few countries has had a significant impact on the wealth and security of many of them. An energy transformation driven by renewables could bring changes just as radical in scope and impact with a democratization of energy. However, that transition won’t be automatic — there may also be conflicts over access to renewable resources, since they too are not distributed equally around the world.

LUT goes bold

That’s the starting point for yet another new 100% renewables study from researchers at LUT University in Finland and Brazil’s University of São Paulo. “Each regional energy transition will proceed rather uniquely,” says the study. “Each country will have a specific optimal electricity supply mix, but solar PV [photovoltaics] will become the dominating source of electricity globally. Beyond 2040, PV will generate more than half of global electricity demand, and almost 70% in 2050. The 2020s will be most challenging due to the substitution of very high capacities of newly retired fossil fuel and nuclear capacities, and high capex. The transition will require a capex of around 22.5 trillion € (uncertainty range 19–25.5 trillion €), which is comparable to current power sector-related investments.”

Overall the research says: “A sustainable and carbon neutral electricity system based on 100% RE [renewable energy] is technically feasible and economically viable globally by 2050 due to the reasonable total system LCOE [levelized cost of energy] (26–72 €/MWh) with a global average of 52 €/MWh (uncertainty range 45–58 €/MWh).” And it concludes: “For decades the RE share has grown slightly. However, despite discussions about defossilization and decarbonization of the energy system, GHG [greenhouse gas] emissions keep on growing. In order to fulfill the Paris Agreement requirements as well as the United Nation’s Sustainable Development Goals, a greatly accelerated transition should be started soon.”

It’s a bold study: 22 TW of PV will generate nearly 70% of all electricity, and 3.2 TW of wind nearly 18%. Enough to save the day, with hopefully plenty spare for heat and transport – if LUT proves to be right. And if the costs are as low as the researchers expect. That is certainly claimed to be likely; in yet another challenging report, LUT and its research partner the Berlin-based Energy Watch Group (EWG) insist that 100% renewable EU scenarios will be more cost-effective than the current system. More on that in my next post.

Other views

Not everyone agrees. New modelling by Dutch researchers of seven scenarios for the European power system in 2050, based on 100% renewable energy sources, did find that “a 100% renewable European power system could operate with the same level of system adequacy as today when relying on European resources alone, even in the most challenging weather year observed in the period from 1979 to 2015”. However, they also said that realizing such a system by 2050 would be expensive: “Even when wind and solar photovoltaic capacity is installed in optimum locations, the total cost of a 100% renewable power system (∼€530 bn p.a.) would be approximately 30% higher than a power system which includes other low-carbon technologies such as nuclear, or carbon capture and storage (∼€410 bn p.a.).” That echoes the conclusion of a global study from Harvard University, US; 100% scenarios could be viable, but they might cost more than other approaches.

The relatively high costs of 100% renewables scenarios predicted in some studies could be reduced if demand could be cut more. The costs could fall further if reliance on relatively high-cost biomass sources was reduced, as could be the case if Power to Gas (P2G) conversion of surplus renewables output was used. The Dutch study does not look at that. LUT did and was also quite sparing in its use of biogas — it mostly used P2G instead for balancing, along with other storage options. That would no doubt be welcomed by Jacobson et al. at Stanford University, US, and elsewhere. In their 100% renewable global 2050 scenario, they avoid all use of biomass (landfill gas apart), and reckon their wind, water and solar mix will cost less than current approaches, even with balancing/storage costs added.

Given that renewable costs continue to fall, while nuclear costs are still rising and high-cost carbon capture and storage (CCS) — though not carbon capture and utilization (CCU) — is sliding out of policy focus, that view seems increasingly credible. And that ignores the likely high social and economic cost of continuing to use fossil fuels. In my next post I look in more detail at the latest 100% renewables scenarios – the LUT/EWG all renewable energy global study and an update of Jacobson’s all renewable energy study. They go way beyond the more conventional scenarios – from Shell, Statoil, Exxon, IEA, IPCC and others – reviewed recently by the World Energy Council, most of which, like BP’s scenario above, still have fossil fuels playing significant roles. Take your pick.

Assessing tumour hypoxia could personalize lung cancer treatments

Tumour hypoxia, a condition in which oxygen concentration in tumour cells is significantly low, causes radioresistance and often occurs in non-small cell lung cancer (NSCLC). Swedish researchers have now developed a method to calculate an optimum radiation dose for hypoxic target volumes in NSCLC tumours, based on the use of PET images to assess tumour oxygenation. They examined a range of fractionation schedules for “dose painting” treatment plans and investigated the feasibility of using their method for calculating the dose required in hypoxic subvolumes (Med. Phys. 10.1002/mp.13514).

Hypoxia is heterogenous and dynamic in nature, and there are no generally accepted radiotherapy approaches for hypoxia mitigation. Stereotactic body radiotherapy (SBRT) is a recommended treatment for NSCLC because of its ability to deliver precisely targeted, high-dose irradiation in a small number of sessions. However, its short treatment duration does not allow enough time for the global reoxygenation that results from tumour shrinkage in longer treatments. Such treatments with extreme hypofractionation would be more effective if their impact on hypoxic tumours could be estimated, and coverage of hypoxic areas of tumours could be determined.

Emely Kjellsson Lindblom

Led by Emely Kjellsson Lindblom from Stockholm University, the authors investigated the impact of imaging with 18F-flortanidazole (18F-HX4), a novel PET hypoxia radiotracer. The researchers applied a function that converts normalized tracer uptake to oxygen partial pressure (pO2) to the 18F-HX4 PET imaging data of 19 patients with NSCLC. They segmented hypoxic target volumes (HTV) based on a pO2 threshold of 10 mmHg, the upper limit of that conventionally considered the hypoxic threshold. The authors considered this to be the safest approach to ensure that all clinically relevant hypoxia would be included in the HPV.

For each patient, the researchers adjusted the gross tumour volume (GTV) to include the HTV when it extended beyond the GTV. They calculated the prescribed uniform dose required for 95% tumour control probability for the HTV, the target for hypoxia-based dose painting. They also determined the prescribed dose for the GTV excluding the HTV and the clinical target volume (CTV) excluding the GTV.

“By segmenting the tumour in this fashion, the uniform dose prescription can be performed for individual subvolumes, each with a more homogenous radiosensitivity than in the whole tumour volume,” the authors explained. They also performed calculations for fractionation schedules ranging from conventional radiotherapy to extremely hypofractionated SBRT for each tumour.

Eleven of the patients had an adjusted GTV less than or equal to 1% larger than the original GTV. In five patients, the adjusted GTV was between 1% and 5% larger than the originally delineated volume. The largest change of 74% was observed in the patient with the smallest GTV, 6.2 cm3, which was adjusted to 10.7 cm3 to encompass the HTV.

For all but one patient (who had a negligible HTV), the HTV dose was consistently higher than both the GTV minus HTV and CTV minus GVT doses. Interestingly, for patients in whom the HTV ρO2 distribution was more favourable, a lower dose was required despite a bigger volume. The researchers noted that treatment regimens with several fractions produced higher levels of tumour control probability than the single-fraction treatment regimen.

The doses calculated for these 19 patients were highly individualized, which the authors state makes a strong case for the need to segment tumours based on hypoxia PET imaging. “Because the method refers to the calculation of the doses to be prescribed, the time required to create the subsequent dose plan should not be affected, provided that the doses to be prescribed to the different volumes do not result in a technical challenge with respect to fulfilling the clinical goals,” Kjellsson Lindblom tells Physics World. She says that the research team is currently investigating the feasibility of creating clinically relevant dose plans following segmentation and dose prescription based on tumour oxygenation.

“Hypoxia dose painting based on segmentation alone may not may not be sufficient with respect to achieving local control,” the authors observed. “By converting the normalised tracer uptake to pO2, subvolumes can be delineated based on a hypoxic rather than an uptake threshold, and the dose that is required in order to overcome the resistance resulting from the pO2 distribution within that volume can be calculated.”

The next step will be clinical validation. “The predicted outcome according to the model needs to be compared with the actual outcome of treated patients,” explains Kjellsson Lindblom. “Using the pre-treatment hypoxia imaging data and dose plans for already treated patients, the method would be used to calculate the expected outcome for these patients, and by comparing these with clinical outcomes, our model could be validated or adjusted and improved according to the clinical findings.”

Copyright © 2026 by IOP Publishing Ltd and individual contributors