Sea level rise may double forecast for 2100

If you are among the many millions of people who live near the world’s coasts, it will probably be worth your while to read this: sea level rise could be much greater than we expect.

A team of international scientists led by the University of Bristol, UK, has looked again at the estimates of how much the world’s oceans are likely to rise during this century. It concludes that the figure could be far higher than previous studies suggested.

In an extreme case, the members say, sea level rise over the next 80 years could mean that by 2100 the oceans will have risen by around six feet (two metres) − roughly twice the level thought likely till now, with “pretty unimaginable” consequences

In its fifth assessment report, published in 2013, the Intergovernmental Panel on Climate Change (IPCC) said the continued warming of the Earth, if there were no major reductions in greenhouse gas emissions, would see the seas rising by between 52 cm and 98 cm by 2100.

Sombre prospect

Many climate scientists have argued that this was a conservative estimate. The possibility that the eventual figure could be around double the forecast, threatening hundreds of millions of people with having to leave their homes, is sobering. It is published in the Proceedings of the National Academy of Sciences (PNAS).

The Bristol team used a different way of trying to gauge the possible effect of the way the ice is melting in Greenland, West and East Antarctica, not relying simply on projections from numerical models.

Their method used a technique called a structured expert judgement study, which involved 22 ice sheet experts in estimating plausible ranges for future sea level rise caused by the projected melting of the ice sheets in each of the three areas studied, under low and high future global temperature rise scenarios.

If emissions continue on their current path, the business-as-usual scenario, the researchers say, then the world’s seas would be very likely to rise by between 62 cm and 238 cm by 2100. This would be in a world that had warmed by around 5 °C, one of the worst-case scenarios for global warming.

“For 2100, the ice sheet contribution is very likely in the range of 7–178 cm but once you add in glaciers and ice caps outside the ice sheets and thermal expansion of the seas, you tip well over two metres,” said the lead author, Professor Jonathan Bamber, of the University of Bristol.

He added: “Such a rise in global sea level could result in land loss of 1.79 million sq km, including critical regions of food production, and potential displacement of up to 187 million people.”

For temperature rises expected up to 2 °C Greenland’s ice sheet makes the single biggest contribution to sea level rise. But as temperatures climb further the much larger Antarctic ice sheets become involved.

“When you start to look at these lower-likelihood but still plausible values, then the experts believe that there is a small but statistically significant probability that West Antarctica will transition to a very unstable state, and parts of East Antarctica will start contributing as well,” said Bamber.

“But it’s only at these higher probabilities for 5 °C that we see those types of behaviours kicking in.”

Mass exodus

Globally important food-growing areas such as the Nile delta would be liable to vanish beneath the waves, and large parts of Bangladesh. Major global cities including London, New York, Rio de Janeiro and Shanghai would face significant threats.

“To put this into perspective, the Syrian refugee crisis resulted in about a million refugees coming into Europe,” said Bamber.

Polar science is making striking advances in understanding what is happening to the Greenland and Antarctic ice sheets. New satellite measurements are showing ice mass loss happening faster than models expected, and there is also something called the marine ice-cliff instability hypothesis, which assumes that coastal ice cliffs can rapidly collapse after ice shelves disintegrate, as a result of surface and sub-shelf melting caused by global warming.

Serious risk

The chances of sea level rise as devastating as this are small, the Bristol team say − about 5%. But they should be taken seriously.

“If I said to you that there was a one in 20 chance that if you crossed the road you would be squashed you wouldn’t go near it,” Bamber said.

“Even a 1% probability means that a one in a hundred year flood is something that could happen in your lifetime. I think that a 5% probability, crikey − I think that’s a serious risk.

“If we see something like that in the next 80 years we are looking at social breakdown on scales that are pretty unimaginable.”

As quantum technology matures what industries should care?

“In the next 5-10 years a quantum computer will do a calculation that a supercomputer can’t do,” Rupesh Srivastava told around 65 invited attendees at the OxLEP led Quantum Technologies briefing at the UK’s House of Commons. No-one can predict the future, but as a Technology Associate at Oxford University’s Clarendon Laboratory working for Networked Quantum Information Technologies (NQIT) Srivistava is well placed for an educated guess, and there is increasing confidence that in the not so distant future, quantum phenomena will descend from the lofty realms of the wacky and inscrutable to be harnessed in technologies that are useful and eventually indispensable for human activities. However as to what those activities are and who should care, it seems the jury is still out.

As an example of the progress made in quantum hardware research, Srivastava pointed out that the latest commercial machine already has 20 qubits. While that may seem modest compared with the gigabytes handled by conventional digital technologies, where the data these machines manage scales linearly with the number of bits, the quantities quantum computers handle scales exponentially, essentially making 20 qubits equivalent to 220 conventional bits. Quantum computers can exploit “entanglement” between qubits, which means as Srivastava put it – if you tickle one the other laughs, and this opens up a whole new way of processing data in calculations. While this leads to enormous efficiencies it also makes quantum algorithms quite alien from their classical counterparts.

Srivastava stressed that the current challenge was less about increasing the quantity of qubits and more about improving their quality and “coherence”. He described the qubits in use today as “noisy primadonnas – everything destabilizes them”. However here too progress has been made with the current record for coherence at 50 seconds – “long enough to make a coffee, so long as it’s instant”. The current pace of progress is enough for some, Srivastava among them, to strongly advocate investing in quantum technologies now. “Get involved now because you need to learn about it,” advised Srivastava. “If you show a [conventional] software engineer a quantum algorithm they will think it is from Mars.”

Quantum sectors

There are a multitude of fields where there is at least an outside chance that quantum calculations could be useful, from optimizing personal medicine to organizing complex production lines in manufacturing. However, in all these proposed areas there is a lot of work to do to make a commercial success of the technology’s potential. As Andrew Macintosh, Chairman of Oxford Quantum Circuits (OQC) highlighted during the briefing’s discussion, making practical use of quantum technologies will likely progress faster by focusing on specific applications and collaborating with interested industry partners who understand the issues the application can address.

There still seems to be a range of opinion as to whether quantum technologies can add value in all sectors or whether cryptography is the only real industry with an urgent need to heed advances in the field. As is often the case, a lot of people sit somewhere in the middle. Marco Paini, quantum computing program manager at the Washington DC and London based QxBranch, works on the software side designing the algorithms that quantum computers can exploit. Like many he flags up the financial services as a key sector to gain from quantum algorithms on account of the largely mathematical nature of for instance portfolio optimization. However, he also highlights the fields of research it could benefit, not just in chemistry but also physics, such as superconductivity, which can be described by a “Hubbard model” that quantum algorithms could tackle well. In this way quantum computers may have an interesting role to play in providing insights into their own working.

“Quantum Valley” 

Oxfordshire has some unique advantages for quantum technology businesses and it was these that OxLEP hoped to highlight in putting the briefing together. According to Srivastava the UK already counts among the world leaders in quantum technology, although the challenge remains to maintain this position. The UK has four cross-institution quantum hubs in imaging, sensing, communication and computation, and Oxford University leads the quantum computation hub. As Macintosh points out, the expertise and commercial potential in quantum technologies that  Oxfordshire boasts was already sufficiently enticing to OQC’s founder Peter Leek to lure him from his then home in Switzerland before he founded the company, and OQC continues to attract employees skilled up to a level that could open doors for them in almost any competing institution of their choosing across the rest of the world.

While Oxfordshire may already be home to globally competitive pioneering start ups like OQC, the region has a history of similarly promising commercial outfits that have led the field with groundbreaking technology only to be swallowed up by other larger companies from abroad, such as Oxford Instruments’ pioneering NMR technology, which Siemens bought. If companies continue to invest in their foreign branches when they buy these smaller enterprises, it may be debateable whether this matters – the local job market and economy is still benefiting from the business. However, when the bottomline starts to squeeze the tendency is to cut resources in branches overseas rather than those closer to home. There was a lot of hope voiced at the briefing that Oxfordshire could establish itself as a “Quantum Valley” analogous to Silicon Valley in the US, but how the area’s potential ultimately unfolds remains to be seen.

  • This was edited 24th May 2019 to correct the spelling of a name

Improving the world’s most accurate clocks and connecting to the Internet via lights

In this episode of the Physics World Weekly podcast, we begin by looking at the latest developments in the world of atomic clocks. It’s a timely topic as this Monday was World Metrology Day, a celebration of the field of measurement science. Hamish Johnston reports from JILA in Colorado where he caught up with Jun Ye who explains why even more accurate timekeepers will help us to test the frontiers of physics including general relativity and theories of dark matter.

Later in the podcast, we take a look at the emerging communications technology known as LiFi. Standing for light fidelity, LiFi is an alternative to WiFi that allows people to connect to the Internet via data encoded into light bulbs – perhaps even the the lights in your own home. We’re joined by “the father” of LiFi Harald Haas who’s in conversation with Physics World’s industry editor Margaret Harris about the journey of innovation from concept to commercial product. Haas, the co-founder and chief scientific officer  of Pure LiFi, reflects on the progress made since he caught the public imagination with 2011 TED talk, which included a live demonstration of a prototype LiFi system in action.

As always, we also bring you a roundup of some of the research highlights making the headlines this week, including an update on the LISA Pathfinder mission and the progress for a new type of radiotherapy treatment. If you like what you hear then please subscribe via your chosen podcast app and we’re also available now to follow on Spotify.

Does the brain awaken via a continuous phase transition?

Further evidence that the brain undergoes a continuous phase transition when we awaken from sleep has been discovered by physicists in Brazil. The team studied patterns in the spiking of neurons in the brains of sleeping and awake rats and found evidence for a critical point where the transition occurs.

Waking up in the morning certainly feels like a transition between two states of mind, but scientists do not have a good understanding of how the brain shifts from one state to the other. Researchers do know that brain activity involves neurons creating small voltage spikes. By studying these spikes in mammals, scientists know that the spikes are emitted in synchronous repeated bursts during sleep and as asynchronous noise-like signals when the animals are awake.

An important unanswered question is how the brain makes the transition between these two different states – or phases – of consciousness. One possibility is that brain activity undergoes a continuous phase transition. This process occurs in a wide range of physical systems including the transition between the magnetic and non-magnetic phases of iron when the material is heated above a critical temperature

Spiky avalanches

This latest research was done by Antonio Fontenele and Nivaldo de Vasconcelos at the Federal University of Pernambuco and colleagues, who measured brain signals from rats and observed avalanche-like events in which many spikes occur in quick succession. They measured the number of spikes in each avalanche (which they define as the size of the avalanche) as well as the duration of each avalanche.

The team then plotted the incidence of avalanches as a function of size and duration. The plots revealed power law distributions of both avalanche size and duration at the transition between asleep and awake states. These power law distributions are indicative of the existence of a critical point in a continuous phase transition, say the researchers.

As well as analysing their observations of the brain activity of eight rats, the team also looked at brain-spiking data from independent studies of a monkey and mice and found similar power-law distributions.

Intriguingly, the observed power laws are incompatible with a popular model that describes the awakening process as a percolation-like phase transition between quiescent and active states. Instead, the observations are somewhat in line with the “critical oscillations” (or CROS) model of neuronal avalanches. The CROS model, however, does not currently provide a critical point and the team believe that their findings will help with the further development of this and other models.

The research is described in Physical Review Letters.

Seeing cancer in a new light: creating an atlas of blood flow in tumour tissue

Tumour map

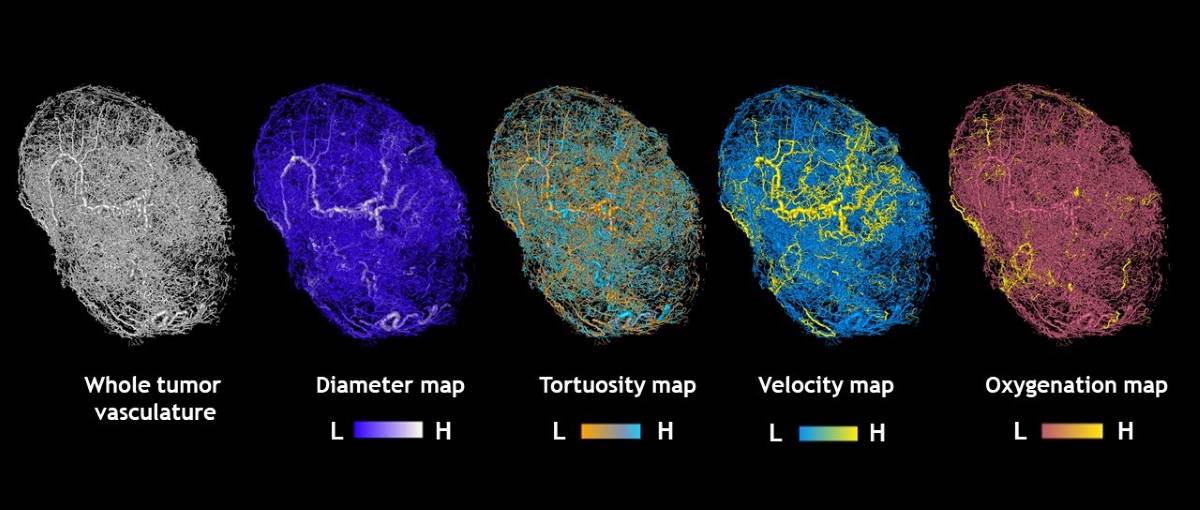
Non-invasive image-based methods for quantifying changes in tumour growth have been under investigation for years. Using the latest advances in imaging and computing, Johns Hopkins Medicine researchers have developed a framework that’s able to reveal the structural and functional changes in the blood vessel network required for growth of a tumour.

The team used high-resolution 3D imaging of tumour blood vessels paired  with sophisticated mathematical formulae to generate a model framework. The model represents the microenvironment of tumour tissue, including the flow of blood and oxygen, the complex blood vessel network and structural changes occurring over time (Nature Sci. Rep. 10.1038/s41598-019-40888-w).

The image-based model

To create a model that reflects the structural and behavioural aspects of tumour growth, Eugene Kim from Arvind Pathak‘s research team implanted human breast cancer cells in mice. Those cancer cells grow into tumours that the researchers imaged using 3D magnetic resonance microscopy and micro-CT to create high-quality 3D images with information about tumour’s volume and the network of its blood vessels.

Once the underlying vascular network had been mapped, the researchers next considered how to quantify the functional characteristics of these tumour vessels. They then searched for previously published data on blood flow/pressure and volume in blood vessels similar to those seen in their tumours. To understand how these structures would behave in a living system, Pathak’s team collaborated with Aleksander Popel‘s Systems Biology group at Johns Hopkins.

Spyros Stamatelos from Popel’s group created a set of graph theory formulae to represent various aspects of the tumours and developed a model to describe blood and oxygen flow by combining their data with information already published in the scientific literature. This work was continued by Akanksha Bhargava who made the final classification and integrated the images with the simulation results.

Google Maps for cancer

The researchers suggest that the visualizations resulting from these simulations can be described as “Google Maps for cancer”, since  they work in a similar fashion. Google Maps shows geographical maps superimposed with useful information such as speed limits, average speed, travel time and traffic activity. Likewise, these tumour models generate hundreds of thousands of data points about the predicted blood flow and oxygenation in tumours and  superimpose these data on the blood vessel architecture.

The researchers believe that their image-based computer model will add further details to the growing “atlas” of cancer, a collection of information useful for documenting the disease, and from which artificial intelligence can be used for applications ranging from predicting drug delivery to tumour behaviour. Access to the finer details of tumours will help bioengineers and cancer biologists develop and test in silico applications such as drug targets. The model can be also used to understand the complexities of other tissues (for example, heart and brain) and related diseases such as cardiac arrest and stroke.

While this approach is not applicable directly to studying cancer growth in humans, the researchers are hopeful that as high-resolution tumour imaging in patients improves, their tools can be used to detect signs of cancer at earlier stages, predict the behaviour of cancer and customize the therapy to the patient.

Physicist creates remarkable tennis-ball towers, including one made from 46 balls

As a physicist and keen tennis player, I would like to share an amusing “discovery” I recently made. In my office, I have about 20 used tennis balls and so decided to try building some tennis-ball “pyramids”.

Tennis balls

As you might expect, a four-level pyramid has a triangular cross-section, with 10 balls at the bottom, followed by six in the next layer, then three and finally one ball on top (image top right). When I carefully removed the three corner balls from the bottom layer plus the upper-most ball, I ended up a with a beautiful, symmetric structure of 16 balls with three hexagonal and three triangular sides (image top left).

Interestingly, the corner balls in the second-bottom layer are kept in equilibrium, hanging over the layer below. These “exposed” balls are held in place because the balls directly above press down on them and into the two adjacent balls of the bottom layer – producing a pair of reaction forces to balance their weight. The torques are balanced too, with enough friction between the felt-covered balls to guarantee equilibrium.

Intrigued, I recreated my original 20-ball pyramid and found that when I removed all three corner balls in the lowest layer but left the single ball on the very top, I was able to take out the three corner balls in the second-bottom layer. What I ended up with was a bizarre, Christmas-tree-like structure made of 14 balls (image middle right).

It then occurred to me that the top three layers ought to remain in equilibrium even if the lowest layer were not there. So when I rebuilt the Christmas tree without that bottom layer, I created a beautiful and delicate seven-ball structure (image bottom right). The top ball is crucial for keeping the structure steady: it presses down on the three balls in the layer below, which in turn presses down on the three balls on the table. Their counter reaction keeps the middle layer steady. Again, friction is vital: without it, there would be no torque balance and the balls would roll away.

Friction is vital: without it, there would be no torque balance and the balls would roll away

Moreover, I could make this seven-ball structure even higher by adding one extra three-ball layer after another, in which each tower has (3n + 1) balls, where n is the number of triangular layers. It got increasingly hard to make the towers as they got taller. Indeed, to create the seven-storey, 19-ball structure (image bottom left) I needed special “scaffolding” in the form of tennis-ball boxes and my hands to support the tower as it went up. I could remove the “scaffolds” only after putting the top ball on.

Since my letter on this subject appeared in the May 2019 issue of Physics World, I’ve also created a nine-storey tower, consisting of 25 balls, which you can see in the video below.

Photo of frustum pyramid made from 46 tennis balls

I’ve also recently managed to make an exotic 46-ball “frustum” pyarmid (image left).

I can find no mention of such structures online and am sure they would have interested Martin Gardner – that great fan of “recreational” science – were he still alive. I wonder even if my “discovery” could be turned into a board game of some sort, with players required to build complex structures from such balls?


Note from the editor: if you think the balls might have somehow been glued together, watch how this nine-storey tower, consisting of 25 balls, collapses when the top ball is removed.

Climate change could boost wind power in Texas

Photo of wind turbines

How will climate change affect wind and solar power? By 2050 wind power is likely to fall across the central US and increase in the east. Meanwhile, solar power looks set to decline in California but increase across the southeast US. A new study investigates how Texas, currently the US state with greatest installed wind and solar capacity, will cope as climate change kicks in.

Michael Craig from the US National Renewable Energy Laboratory (NREL) and colleagues used five global climate models to investigate the change in potential wind and solar energy for the state of Texas by 2050 under RCP8.5 – the most severe climate change scenario. The researchers used these figures in a unit commitment and economic dispatch model (UCED) to assess how the changes will affect power system operations.

By 2050 the extra energy in the atmosphere is likely to boost wind-speeds across Texas, according to the team’s climate model simulations, bringing a rise in wind power generation potential of between 1 and 4%.

The results for solar power were not so clear, with a possible increase or decrease in solar generation potential of up to 1%. There were lots of regional, seasonal and daily variations in both forms of renewable power.

“The spatial and temporal differences in our results highlight the importance of using high-resolution data sets to study the potential impacts of climate change on wind and solar power,” says Craig, whose findings are published in Environmental Research Letters (ERL).

Craig and his colleagues also showed that the impacts of climate change on wind and solar power are likely to have a knock-on effect on other generation technologies. This will alter electricity generation costs and carbon dioxide emissions. In the specific scenario they explored, the increased wind and solar generation could reduce carbon dioxide emissions by between 8 and 16 million tons, with electricity up to 1% cheaper. “These particular results are very dependent on the modelling assumptions,” says NREL’s Carlo Brancucci.

The researchers stress that their calculations are not forecasts. “Significant uncertainty surrounds many of our results, from the emissions and forcing pathways the world actually follows to the impacts of that pathway across space and time.” What’s more the calculations don’t take into account future changes in energy demand, population change or improved energy efficiency.

Nonetheless, the scientists believe that their research demonstrates the need to understand how climate change may affect power generation. Ultimately, calculations like these could feed into policy decisions such as power system planning and optimal placement of wind and solar farms.

Metal organic frameworks stiffen up for improved CO2 capture

Roasting metal organic frameworks (MOFs) could make them more effective at capturing CO2 to remove a key greenhouse gas from the atmosphere, according to recent research by Kumar Varoon Agrawal and co-workers at the École Polytechnique Fédérale de Lausanne. Reporting in Advanced Materials, they show that heating a membrane of zeolitic imidazolate framework 8 (ZIF-8) to an optimum temperature of about 360°C for about 3 to 5 seconds – what they describe as rapid heat treatment (RHT) – could lead to more selective CO2 capture.

Metal organic frameworks (MOFs)

Polycrystalline MOFs are a class of compounds consisting of metal ions or clusters linked together by organic ligands to form one-, two-, or three-dimensional porous structures. They have applications in a wide range of fields ranging from catalysis, gas storage, biological sensing and imaging, and drug delivery stems, among others.

Due to their small, tunable pore sizes and high pore volumes, MOFs are promising materials for use as an adsorbent to capture CO2. However, their flexible lattice structures render them less suitable for selective adsorption or separation of gases with specific molecular sizes.

Rapid heat treatment (RHT)

For the RHT in their study, Agrawal and colleagues used a 5 inch quartz tube furnace, with a 1 inch quartz tube placed inside to purposefully ensure uniform temperature throughout the sample. They then placed the ZIF‐8 membrane in a custom‐built sample holder – using a thermocouple for accurate temperature measurements. To reach the desired temperature, they then set the furnace to 500 °C, and inserted the sample for 3-5s, before pulling it out, sealing with epoxy and performing their permeation measurements.

Unprecedented gas selectivity

Agrawal and colleagues report that the RHT of the synthesized polycrystalline ZIF‐8 membranes distorts the material lattice structure and reduces its flexibility, preventing larger molecules from permeating. To prove this, they showed that an obtained temperature-activated gas transport led to different interaction strengths between various guest-molecules and the membrane because the activation energy increases significantly with molecular size (CH4 > CO2 > H2). Consequently, the researchers were able to achieve unprecedented selectivity in the ratio of the separated gases H2/CH4, CO2/CH4 and CO2/N2 in excess of 175, 30 and 30, respectively. This far outweighs the current maximum selectivity obtained for CO2/CH4 and CO2/N2, which is 5.

The scientists report that by choosing the RHT conditions, the performance of MOFs could be tuned to the desired rigidity for selective adsorption and separations.  They report, “In general, heat treatment to a higher temperature within an optimal window, a faster ramping rate, and higher treatment time (dwell time) led to a sharper molecular cut‐off”.

Terahertz light pulses speed up spin switching

A new technique to rapidly reverse a magnet’s polarity in a way that all of its spins coherently rotate could be used to develop more energy-efficient data storage devices and superfast computers in the future. The technique, which works by applying ultrashort pulses of terahertz-frequency light to the magnet, does not produce any waste heat and requires very little energy – just one photon per spin flip.

Modern-day computer hard drives encode data as binary zeros and ones by orienting the spins in magnetic materials using magnetic field pulses created by an electrical current. This process dissipates huge amounts of energy though (and is relatively slow). Indeed, today’s data centres consume between 2 and 5% of the world’s electricity and produce waste heat that, in turn, requires even more power, to cool the servers down.

Researchers in Russia, Germany, the UK and the Netherlands have now exploited a novel, unprecedented strong interaction between the electric field of terahertz light pulses and magnetic spins. The effect, which they discovered in 2016 in the antiferromagnetic material thulium orthoferrite, makes the spins oscillate with large amplitude. This interaction, they found, is still not strong enough to switch the orientations of the spins, however, even using the most powerful THz radiation sources.

To be able to switch spins with THz light, the team designed and fabricated a special nanosized antenna (made of gold) and placed it on top of the thulium orthoferrite magnet. The antenna possesses plasmonic modes (collective oscillations of the metal’s conduction electrons) that increase the coupling between light and the antenna.

Enhancing the local light field

The device collects and focuses light at THz frequencies and enhances the local light electric field by more than 10 times. “This electric field is now strong enough to steer the magnetization of all the spins over a potential energy barrier and into a new orientation, in just picoseconds,” explains team member Rostislav Mikhaylovskiy, formerly of Radboud University in the Netherlands and now at Lancaster University in the UK. “This is because the photon energies of THz radiation are comparable to the energy needed to align the spins in the magnet.”

And that is not all: the temperature of the magnet does not increase at all during switching since the process requires the energy of just one quantum of the terahertz light – a single photon – per spin, he adds.

“The speed of purely electrical spin switching is typically limited to the GHz range by capacitances and inductances in electronic circuitry,” explains team member Christoph Lange of Regensburg University in Germany. “Most importantly, however, electronics inherently suffer from Ohmic energy losses, and subsequent heating. The flow of data in modern-day systems is now so intense that this waste heat is already restricting the performance of data centres and supercomputing facilities. Our approach avoids this problem by replacing electric current with light pulses.”

Coherent spin switching

To prove that they had indeed observed coherent switching of all the spins in the magnet, the researchers monitored the spin orientation using the polarization rotation imprinted on a short optical pulse that is delayed relative to the THz pulse. “If the initial spin deflection is not sufficient for synchronous spin switching, we observe a sinusoidal, oscillating signal in the polarization rotation,” explains Mikhaylovskiy. “If, on the other hand, the spins are switched, we observe a ‘beating’ signature on top of the oscillations, which is the characteristic ‘fingerprint’ of the spins deflecting over a potential barrier into a neighbouring local potential energy minimum.”

Our work is a major milestone in the worldwide research effort towards complete control of spins by THz pulses, Mikhaylovskiy tells Physics World. “The technology we have developed could enable highly energy-efficient data storage at greatly increased speeds as compared to existing technology. What is more, the coherent dynamics made possible by the extremely low energy dissipation may even allow for quantum information processing based on solid-state spins at THz clock rates.”

The team, which also includes Stefan Schlauderer and Rupert Huber from Regensburg University, Alexey Kimel of Radboud University and Anatoly Zvezdin from the Russian Academy of Sciences, now plans to continue its research at the new ultrafast laser at Lancaster University and accelerators at the Cockroft Institute. These facilities are able to generate intense pulses of THz light and the new experiments will allow the researchers to determine the practical and fundamental speed and energy limits of magnetic recording using THz light pulses.

The research is detailed in Nature 10.1038/s41586-019-1174-7.

The story behind the first ever black hole image

In the May edition of the Physics World Stories podcast, Andrew Glester reflects on the biggest astronomy story of the year – the first ever image of a black hole and its “shadow”. Unless you’ve been living in a black hole yourself, you will have seen the glowing donut/eye of Sauron/smiley face, which is actually the supermassive black hole at the centre of the M87 elliptical galaxy, some 55 million light-years from Earth.

The image represents an incredible feat of science and engineering, produced from petabytes of data captured by the Event Horizon Telescope (EHT), a network of individual radio telescopes and telescopic arrays scattered across the globe. The EHT team reported the results in six papers in a special issue of Astrophysical Journal Letters, which is published by the Institute of Physics on behalf of the American Astronomical Society.

To find out more about the story behind the discovery, Glester catches up with three scientists from the EHT team who also hold positions at Radboud University in the Netherlands. First up is Monika Mościbrodzka, a member of EHT’s data analysis team who speaks about the significance of the discovery and the future prospects for the project. “Black holes are no longer just a theory. It’s now reality”, she says.

Schematic of the Event Horizon Telescope

Meanwhile, Freek Roelof explains how the group generated the image from all the raw radio wave data. He worked on data collection at the Submillimeter Telescope (SMT) on Mount Graham, Arizona. When not doing cutting edge science Roelof plays the guitar and you can hear some of his black-hole-inspired songs in the podcast.

Since the publication of the image, many people have asked the question: “Why did these astronomers look all the way to the M87 galaxy, when we have a black hole – Sagittarius A* – at the centre of our own galaxy?” The reason comes down to scale. Despite being a thousand times further away, the black hole at the centre of M87 is a whopping 0.7 billion solar masses, a thousand times more massive than Sagittarius A*.

But now that the EHT has proved its capability, you wouldn’t bet against the collaboration capturing an image our Sagittarius A* at some point. In the meantime, you can take a look at this virtual reality simulation based on best-fit models of observations of Sagittarius A*. Its creator, Jordy Davelaar, joins the podcast to explain how and why he created it.

If you enjoy what you hear, then you can subscribe to Physics World Stories via your chosen podcast host. Also check out our other podcast Physics World Weekly, which brings you regular updates on the latest research developments in the physical sciences.

Copyright © 2026 by IOP Publishing Ltd and individual contributors