A laser with a polarization that can be made to oscillate at over 200 GHz has been created by researchers in Germany and the US. The device could be used to boost the data capacity of optical telecommunications server farms, although much work remains to be done before practical devices could be available.
Global internet traffic is growing exponentially with the ever-increasing popularity of bandwidth-hungry activities such as online gaming. As demand grows, telecoms companies are replacing copper wires with optical fibres, which transmit signals at higher speed with lower loss. It has also led to a proliferation of server farms, which contain giant banks of data processors. The energy requirements of these farms are huge: one estimate suggests that, by 2025, they could cause 3.2% of global carbon emissions.
The millions of tiny connections between servers inside a farm also use optical fibre and tiny intensity-modulated lasers. The speed at which a bitstream can be pushed through the fibre depends on how quickly the laser can switch between the intensity corresponding to a “1” and the intensity corresponding to a “0” – currently about 35 GHz. Moreover, explains Markus Lindemann of Ruhr University Bochum in Germany, “The typical technique to increase the modulation bandwidth is to just increase the pumping current. Higher modulation bandwidth is always connected with higher power consumption.”
Fast and efficient
For this reason, researchers are exploring ways to modulate other properties of light. One possibility that has been explored for a decade or so is the use of spin lasers, which produce polarization-modulated light. Researchers have predicted that this could be much faster than intensity modulation, but a clear demonstration had not been provided, and practical considerations such as power consumption remained largely unexplored.
Now, Lindemann, Nils Gerhardt and colleagues a Ruhr University Bochum, Ulm University and the State University of New York at Buffalo have designed a new spin laser based on the birefringence of the laser’s gain medium. Birefringence occurs when the refraction index of a crystalline material depends on the polarization and direction of propagation of light. The effect is usually seen as something to be minimized because it makes lasers unstable.
Instead, the Ruhr team maximized birefringence by bending the crystal that they used as the laser gain medium. To operate the laser, it is first electrically pumped above it lasing threshold and then spin-polarized light from another source is injected into the laser. This causes the laser to undergo resonant oscillations between two orthogonal polarization modes at frequencies up to of 214 GHz. Furthemore, the oscillation rate of the laser is almost independent of its power consumption.
Slow modulation
This may be an impressive proof of principle, but Lindemann acknowledges that oscillations alone cannot transmit data. In a subsequent experiment, therefore, the researchers transmitted a series of data bits by modulating the polarization of the pump light. The maximum data transmission rate they achieved was 25 GHz: “Why is it not at 200 GHz?” asks Lindemann, “The answer is that there are no components on the market that could modulate polarization at that speed.”
Another challenge is that optical spin injection would be impractical in a real server farm. However, the transmission of information using electron spin is at the core of spintronics – one of the most exciting areas in physics research today. If researchers could modulate the polarization of the laser light by modulating the polarization of the electrons used to pump it, they would effectively have a direct interface between spintronics and fibre optics. It is no surprise, therefore, that the US researchers working with Lindemann and Gerhardt are specialists in spintronics.
Werner Hofmann of the Technical University of Berlin points out that the concept is neither new nor unexpected and emphasizes the need for electrical modulation: “If you can modulate the polarization of a laser, that has great potential for [transmitting data at] high speeds: that’s known,” he explains. “The big question is how to make a laser move energy from one polarization to another one with an electrical signal, and that’s not addressed here.”
Ortwin Hess of Imperial College London, who did a theoretical investigation of polarization splitting in lasers of this type when he was at the University of Stuttgart, is more enthusiastic: “I don’t see this as a technical device yet, but as a beautiful demonstration of a fundamental physical effect that we were hoping someone would measure even 20 years ago,” he says.
In the latest episode of the Physics World Weekly podcast, Michael Banks and Tushna Commissariat from the Physics World editorial team explain how the black hole at the centre of the huge Messier 87 galaxy was imaged, why astronomers didn’t try to look for the black hole at the centre of the Milky Way (despite it being nearer), and what implications the observation has for our understanding of black holes.
The podcast also includes a report from Anna Demming about a programme at King’s College London bringing arts students and PhD physics students together, while Susan Curtis brings you some highlights from the world of physics.
Astronomers working on the Event Horizon Telescope have released the first-ever images of a black hole. The image is of the supermassive black hole that lies at the centre of the huge Messier 87 galaxy, in the Virgo galaxy cluster.
Located 55 million light-years from Earth, the black hole has a mass 6.5-billion times that of the Sun. Although black holes are inherently invisible because of their extreme density and gravitational field, the researchers have managed to obtain images near the point where matter and energy can no longer escape – the so-called event horizon.
The first direct visual evidence of a black hole and its “shadow” has been revealed today by astronomers working on the Event Horizon Telescope (EHT). The image is of the supermassive black hole that lies at the centre of the huge Messier 87 galaxy, in the Virgo galaxy cluster. Located 55 million light-years from Earth, the black hole has been determined to have a mass 6.5 billion times that of the Sun, with an uncertainty of 0.7 billion solar masses. Although black holes are inherently invisible because of their extreme density and gravitational field, the researchers have managed to obtain images near the point where matter and energy can no longer escape – the so-called event horizon.
“We are giving humanity its first view of a black hole — a one-way door out of our universe,” says Sheperd Doeleman of the Haystack Observatory at the Massachusetts Institute of Technology (MIT) who is the EHT’s lead astronomer. “This is a landmark in astronomy, an unprecedented scientific feat accomplished by a team of more than 200 researchers.” Doeleman says that the result would have been “presumed to be impossible just a generation ago”, adding that breakthroughs in technology and the completion of new radio telescopes over the past decade have allowed researchers to now “see the unseeable”.
Supermassive black holes are thought to lie at the centres of most galaxies in the universe, and astronomers are keen to decipher their key properties – such as how their extreme gravity affects the space–time around them, and how some of them fuel the massive jets of material that spew out from the galaxies that host them. A key feature of a black hole is its event horizon – the boundary at which even light cannot escape its gravitational pull, as the velocity required to do so would be greater than the speed of light, which is forbidden by Einstein’s general theory of relativity. And while that theory has passed many tests, researchers want to see how well it holds up at the “ultimate proving ground” – a black hole’s edge.
Despite their name, black holes are not, however, all dark. The gas and dust trapped around them in an accretion disc is so compact that it is often heated to billions of degrees even before the matter eventually succumbs to the black hole, making them glow brightly. Indeed, general relativity also predicts that a black hole will have a “shadow” around it, measuring around three times larger than the event horizon. The shadow is of great interest as its size and shape depend mainly on the mass and – to a lesser extent – on any possible spin of the black hole, thereby revealing its inherent properties.
“If immersed in a bright region, like a disc of glowing gas, we expect a black hole to create a dark region similar to a shadow — something predicted by Einstein’s general relativity that we’ve never seen before,” says Heino Falcke from Radboud University in the Netherlands, who chairs the EHT’s science council. “This shadow, caused by the gravitational bending and capture of light by the event horizon, reveals a lot about the nature of these fascinating objects.”
An orange on the Moon
To directly observe the black hole at the centre of Messier 87 – dubbed M87* – astronomers require a telescope with an angular resolution comparable to the event horizon, which is on the order of tens of micro-arcseconds across. But to achieve that resolution with an ordinary telescope – which is like spotting an orange on the surface of the Moon – would require a dish the size of our planet, which is clearly impractical.
EHT astronomers instead use the radio-astronomy technique of very-long-baseline interferometry (VLBI). It involves picking up radio signals from an astronomical source by a network of individual radio telescopes and telescopic arrays scattered across the globe. The EHT, which first turned on in 2007, consists of eight radio dishes in six different locations across the globe all operating at a wavelength of 1.3 mm. These telescopes include the Atacama Large Millimeter/submillimeter Array (ALMA) in Chile, the South Pole Telescope (SPT) in Antarctica, and the IRAM 30-metre telescope in Spain (see image left). The distance between individual EHT telescopes – known as the “baseline” – ranges from 160 m to 10,700 km.
Global networking: the Event Horizon Telescope combines the signals of eight radio telescope observatories including the Atacama Large Millimeter/submillimeter Array (ALMA) in Chile and the South Pole Telescope (SPT) in Antarctica. Solid lines represent the telescopes involved with the observation of M87*, while dashed line are those used for calibration runs. (Courtesy: Akiyama et al and ApJL)
The signals received at each individual telescope dish in the network are precisely tagged with a very accurate time stamp, normally using an atomic clock at each location. Each telescope produces roughly 350 terabytes per day, which is stored on high-performance helium-filled hard drives. The data is then later correlated and used to build up a complete image by supercomputers that are located at the Max Planck Institute for Radio Astronomy in Bonn, Germany, and the MIT Haystack Observatory in the US. This process makes the EHT the highest-resolution instrument on Earth, capable of taking images up to 2000 times better resolution than the Hubble Space Telescope and able to resolve features as small as 20 micro-arcseconds.
An astronomy “landmark”
As a black hole’s size is proportional to its mass, the more massive a black hole, the larger its shadow. Thanks to its enormous mass and relative proximity, M87* was predicted to be one of the largest viewable from Earth — making it a perfect target for the EHT. Astronomers observed M87* on 5, 6, 10 and 11 April 2017, with the telescope taking a series of scans of three to seven minutes in duration each day.
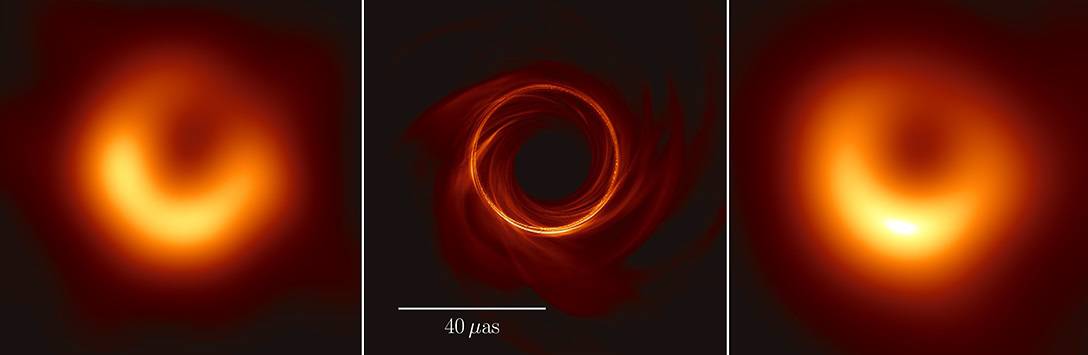
These multiple independent EHT observations have now resulted in the first image of a black hole including its shadow, revealing a ring-like structure with a dark central region. The diameter of the ring is 42 micro-arcseconds with a width less than 20 micro-arcseconds. By comparing the image with theoretical models such as general relativistic magnetohydrodynamic (GRMHD) simulations, the observed image is consistent with expectations for the shadow of a Kerr black hole – one that is uncharged and rotates about a central axis – as predicted by the general relativity.
The researchers were able to deduce the mass of the M87* at 6.5 billion times that of the Sun. Previous estimates — based on models as well as spectroscopic observations of the galaxy by the Hubble Space Telescope — ranged between 3.5 and 7.7 billion solar masses. EHT scientists also deduced the radius of the event horizon as 3.8 micro-arcseconds. They also found that the rotation of the black hole is in a clockwise direction, and that its spin points away from us. The brightness in the lower part of the image is due to the relativistic movement of material in a clockwise direction as seen by us, so that it is moving towards us.
Shadowlands: From left to right, EHT observations of M87* taken on 6 April 2017; a simulation of M87*; simulation convoluted to the resolution of the Event Horizon Telescope. (Courtesy: Akiyama et al and ApJL)
“Once we were sure we had imaged the shadow, we could compare our observations to extensive computer models that include the physics of warped space, superheated matter and strong magnetic fields. Many of the features of the observed image match our theoretical predictions surprisingly well,” says Paul Ho, director of the East Asian Observatory and an EHT board member. “This makes us confident about the interpretation of our observations, including our estimation of the black hole’s mass.”
As well as unveiling the properties of M87*, the EHT has now lifted a veil on the event horizon, showing that it is now possible to experimentally study the region via electromagnetic waves. This, the researchers write, has now transformed the event horizon from a purely “mathematical concept” to a “physical entity”.
“The production of radio images with a resolution comparable to the angular size of a black hole event horizon, for the first time, is a major breakthrough in high-energy astrophysics,” says astrophysicist Rob Fender from the University of Oxford, who is not part of the EHT collaboration. Fender adds that the EHT observations are our best look yet at the region where the jet of the black hole is formed. “The region close to the black hole, just above the event horizon, is the site of much of the most extreme astrophysics in our universe since the Big Bang,” he says. “These jets carry an enormous amount of energy away from the central black hole, via processes which are not well understood.”
This is not the first result of come out of the EHT. In 2012 scientists working on the array managed to observe, for the first time, the base of the jet emanating from the M87 galaxy. The work established that the black hole at the heart of M87 is spinning and that the accretion disc follows the direction of spin. Three years later, researchers on the EHT measured the first direct evidence of magnetic fields near the event horizon of Sagittarius A* — the black hole at the centre of our Milky Way galaxy lying around 26,000 light-years away but with a mass around three orders of magnitude smaller than M87*. By studying the right- and left-handed circular polarization of the incoming radio waves, they were able to infer the direction of linear polarization that traces the magnetic field finding that it even changed on a daily basis and revealing the extreme dynamics at play at the heart of the black hole.
Astronomers now hope to carry out further observations of M87* to deduce the shape and depth of the shadow region more accurately. They are also hopeful to add more telescopes to the array that will allow for higher-resolution images. As well as M87*, the EHT team is attempting to take the first image of Sagittarius A*. But this is more difficult to resolve — despite being nearer — because it is more dynamic than M87*, changing on the scale of minutes rather than days.
Many people are aware that glaciers are melting as climate warms. But a new threat may be emerging: cryoconite. These dark sediments on top of glaciers act like sponges that soak up and concentrate radioactive fallout from nuclear accidents and weapons testing. As glaciers retreat, the contaminants could move into lakes or the soil and then enter the food chain.
Scientists have found radioactive cryoconite at 17 glaciers worldwide, from the Arctic to Antarctica, as Caroline Clason of the University of Plymouth, UK, revealed at the European Geosciences Union (EGU) General Assembly in Vienna, Austria. Together with an international team, Clason measured radioactivity levels in cryoconite orders of magnitude higher than the general landscape. These sediments are a mix of inorganic material like minerals and organic material, including microbes; they accumulate radionuclides when they fall from the atmosphere in snow.
“Our samples are exceptional…outside a nuclear exclusion zone,” said Clason at a press conference, adding that people weren’t aware that glaciers may release radioactive materials from nuclear accidents some 30 years later. Although this may not be harmful at all, said the researcher, it’s something you can’t ignore and requires investigation.
At Isfall glacier in Arctic Sweden, cryoconite contained caesium-137 at an average of 3069 Bq per kg, the researchers found. The highest single value – 13558 Bq/kg — was at Switzerland’s Morteratsch glacier. For comparison, the legal limit for caesium-137 in meat for human consumption is 1500 Bq/kg.
Although scientists know that radionuclides become concentrated in cryoconite, they don’t know if that’s a route into the food chain. Clason and colleagues are studying how well water and acids break down cryoconite in order to reveal whether animal digestion systems can adsorb the radioactive material. If, for example, reindeer grazing in front of glaciers take up radionuclides, there could be harmful socioeconomic consequences for reindeer herders, Clason says.
On a more positive note, cryoconite could perhaps be used to clean up land contaminated by nuclear accidents, Clason believes. Lichens and mosses, which accumulate radionuclides too, have already been used in bioremediation.
The OECD’s Nuclear Energy Agency (NEA) has produced an updated study of System Costs with High Shares of Nuclear and Renewables. Perhaps unsurprisingly, its new report concludes that nuclear wins hands down over variable renewable energy (VRE). The agency says that “a mix relying primarily on nuclear energy is the most cost-effective option to achieve the decarbonization target of 50 g CO2 per kWh”.
That may sound unlikely. To some extent you might see the NEA as fighting a losing battle against reality: renewables are getting cheaper and nuclear more expensive in terms of generation cost. Indeed, the NEA does partly accept that, even if it seems to deny, or at least postpone, the scale of the generation cost reversal: “We fully recognise the great strides that variable renewable energies (VRE), such as wind and solar PV, have achieved in this area in the recent past,” it says. “If, according to our data, they are not yet fully competitive with nuclear power on that metric except in particularly favourable local circumstances, they soon might be.” However, the NEA says “their intrinsic variability and, to a lesser degree, their unpredictability, imply that the costs of the overall system will continue to rise over and above the sum of plant-level costs” adding that “what nuclear energy and hydroelectricity, as the primary dispatchable low-carbon generation options, bring to the equation is the ability to produce at will large amounts of low-carbon power predictably according to the requirements of households and industry”.
Hence the emphasis on full system costs. The NEA claims that these increase dramatically as the share of VRE increases, due to the rising back-up costs and also the so-called “profile costs” imposed on the power system. Put simply, this means that conventional plants have to operate less efficiently to cope with VRE, regularly ramping their output up and down. Some are forced to go offline for a while when lower marginal-cost renewables are available, and so lose income. The NEA talks in terms of them meeting variable “residual load”.
Nuclear can’t cope with high VRE
The agency offers four scenarios with increasing shares of VRE — 10%, 30%, 50% and 75%. As the share of VRE rises, the capacity grows to more than three times the base case. Nuclear falls significantly and gas capacity more than doubles. As a summary for the World Nuclear Association says, “the decrease in nuclear is due to the high ramping up/down requirements that VRE imposes on the system. Nuclear can accommodate this but above a certain level it impacts the load factor to such an extent that nuclear becomes uneconomic.”
That’s a big admission – nuclear can’t cope with high VRE. Indeed, it’s not even clear if it can cope well with medium levels of ramping requirement. But the NEA seems to be saying that there’s no need to try, given that the full system cost of high VRE is so prohibitive. However, here is where it gets debatable. The technical costs of balancing have been extensively studied and a widely accepted estimate is that they might add 10-15% to generation costs at medium levels of VRE, depending on what balancing technology is used. Back-up plants and storage are not the only options. Demand can also be managed via smart grid/variable energy pricing, to delay energy demand peaks when VRE inputs are low, and top-up power can be imported to meet the peaks via long-distance supergrids. Both those options can be low cost. Indeed, flexible demand management and smart grids can save money, while supergrid links also allow for exports of surplus, with this, for some countries, earning a net positive income and avoiding the need for wasteful VRE curtailment.
The NEA discounts battery storage for long-term balancing but does not address Power to Gas (P2G) hydrogen production for backup, using surplus VRE. Instead it talks of VRE curtailment and more use of fossil gas to try to balance VRE, while the other plants, including nuclear, must duck and dive to compensate for the changed supply/demand profile. So yes, then their income would be less and their costs higher. The NEA puts the total system cost, including generation, at $130/MWh for a 75% VRE share, with the extra system cost rising from $8/MWh in the 10% VRE scenario to $50/MWh in the 75% scenario. Profile costs are two-thirds of that, balancing/extra grid links one-third.
It doesn’t have to be that way
However, as indicated above and as the UK Energy Research Centre (UKERC)’s seminal report noted, with proper flexible grid-balancing the extra costs need not be so high. They would anyway be met, in the UK, by the capacity market system, which offers support for smart grid-balancing by demand-side management (DSM)/storage and imports, and also for some residual load suppliers — fossil and nuclear. That, of course, assumes that the latter ought to be compensated for what some see as, at least in part, just commercial losses; they are more expensive than marginal-cost renewables. But we may need some of them for balancing, though arguably not nuclear, which, as the NEA seems to admit, isn’t much use at that for higher VRE levels.
The NEA also accepts that renewables are now cheaper. It says that between 2008 and 2015, VRE deployment “caused an electricity market price reduction of 24% in Germany and of 35% in Sweden”. However, this is a little confusing since that fall must have been despite the system costs which, the NEA says, have risen. Wouldn’t they have been passed on to consumers? Regardless, the overall logic of the report seems to be that nuclear plus gas and some hydro is the best way ahead to avoid these costs in future. A simplified version of this view was put recently in a report by Capell Aris for the Global Warming Policy Foundation, which said a system based increasingly on renewables “will deliver significant carbon emissions cuts but will double electricity price” whereas “a system based on gas and nuclear would deliver similar emissions cuts at around half the price”.
However, the NEA evidently has a more nuanced strategic position. It seems to accept that renewables are unstoppable. What it appears to want is for nuclear to get a good share of whatever balancing funding is available, or for that matter anything else that’s on offer (it did well with the Hinkley contract for difference (CfD)). So, adopting a more conciliatory stance, the NEA seems happy to push for a nuclear and renewables element. The report’s foreword says that “a cost-effective low carbon system would probably consist of a sizeable share of VRE, an at least equally sizeable share of dispatchable zero carbon technologies such as nuclear energy and hydroelectricity and a residual amount of gas-fired capacity to provide some added flexibility alongside storage, demand side management and the expansion of interconnections”.
In collaborative mode, it concludes that “those of us working in the nuclear energy area are well aware of the electricity markets are evolving [sic] and that nuclear energy must evolve to meet future requirements. Nuclear energy is well placed to take on these challenges but can also work together with all other forms of low carbon generation, in particular VRE, to achieve the ambitious decarbonisation targets NEA member countries have set for themselves”.
However, I am not sure how many renewable energy enthusiasts will be interested in signing up to this, or be convinced by the NEA’s at times rather tortuous economic arguments. Take a look- it’s pretty dense stuff. Certainly, economic smoke and mirrors aside, it is hard to see how large inflexible nuclear plants can be much use in providing balancing support for renewables, and small modular reactors, which it is claimed might in theory be able to, are still some way off, with unknown cost, safety and security issues. There will be a need for balancing but there are plenty of arguably better balancing options, some of which may be cheaper. For example, time-of-use demand management, by the introduction of flexible pricing, involves no capital costs and may actually reduce the power costs faced by consumers and the cost of running the system overall.
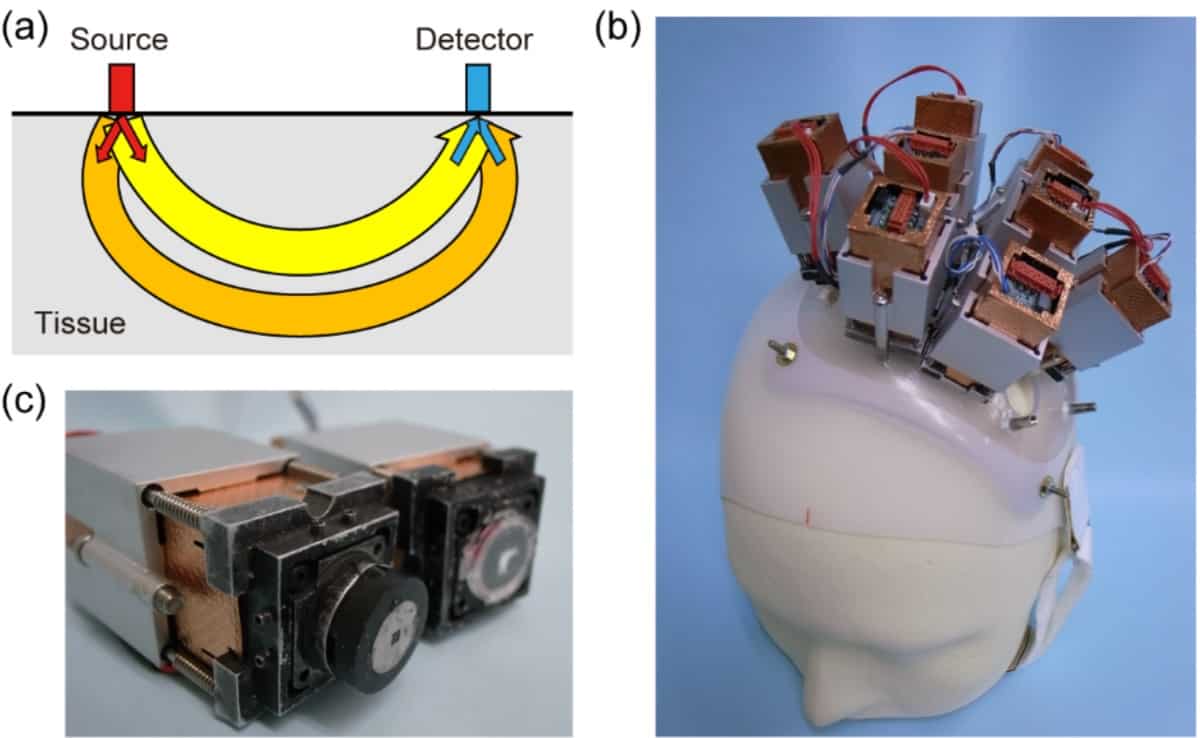
a) Schematic showing two optical paths from source to detector. b) The multi-directional fNIRS system with four source and four detector probes. c) The probe tip. (Courtesy: T Shimokawa et al Biomed. Opt. Express 10.1364/BOE.10.001393)
Researchers from ATR and Ricoh in Japan have used a multi-directional functional near-infrared spectroscopy (fNIRS) system for human neuroimaging. Instead of increasing probe density on the scalp, which is impractical, the team increased the number of optical paths that the NIR light could take from source to detector, using a single probe. This approach produces a richer dataset and could improve 3D visualization of brain activity (Biomed. Opt. Express 10.1364/BOE.10.001393).
By transmitting NIR light to the scalp and detecting the reflected light, fNIRS can measure changes in concentration of deoxy- and oxy-haemoglobin, based on their different specific absorption spectra. These changes arise from neuronal activation in the cerebral cortex and, similar to functional MRI, give an indirect measure of neural activity.
The benefits of fNIRS include its portability, low cost and adaptability to different populations, for example babies and elderly patients, compared with large-scale imaging techniques such as MRI.
Diffuse optical tomography
One obstacle when employing fNIRS is the scattering produced when NIR light is transmitted into biological tissue, which makes image reconstruction difficult. The number of activation sources in the brain outnumbers the number of detectors on the scalp, and estimating where the source locations are is a difficult task. Recently, the use of diffuse optical tomography (DOT) has allowed 3D visualization. However, DOT requires more detailed measurements, for example, using detectors spaced just 13 mm apart.
The DOT algorithm first constructs a forward model using an anatomical model of the head, figuring out how the NIR light has travelled. Inverting this solution and combining it with measured data allows 3D visualization of useful brain images.
The optical paths less travelled
Practically, increasing probe density is a problem; it takes longer to optimize scalp contact and each probe’s position must be noted with high accuracy — this leads to greater patient burden.
Takeaki Shimokawa, Toshihiro Ishii and their research groups developed a multi-directional fNIRS system that can increase the measurement data, without increasing the number of probes. Instead of a single optical path from source to detector, the device produces multiple paths by changing the emission and detection angles.
The system has four sources and four detectors, with four different angles of emission and of detection, and produced 16 times more data than mono-directional fNIRS. The researchers tested the device on a single subject who performed a grip-task to evoke activity in sensorimotor brain areas. The subject performed the same task during an fMRI scan for comparison. The researchers note that the system cannot currently deal with hair; thus, they chose a subject with no hair.
The team compared the observed fNIRS data with simulated fNIRS data based on the fMRI image. The observed data correlated well the simulated data.
The fNIRS data are dependent upon the source–detector pair, the source direction and the detector direction. Since fNIRS data mainly depends on source–detector pair positions, the team subtracted this pair factor from the fNIRS signal and extracted the directional-dependent signals. They then compared these with the simulated fMRI data. The correlation here was lower, which is to be expected as the directional signal is about five times weaker than the positional signal.
The authors note that this is the first detection of direction-dependent fNIRS signals based on brain haemodynamics.
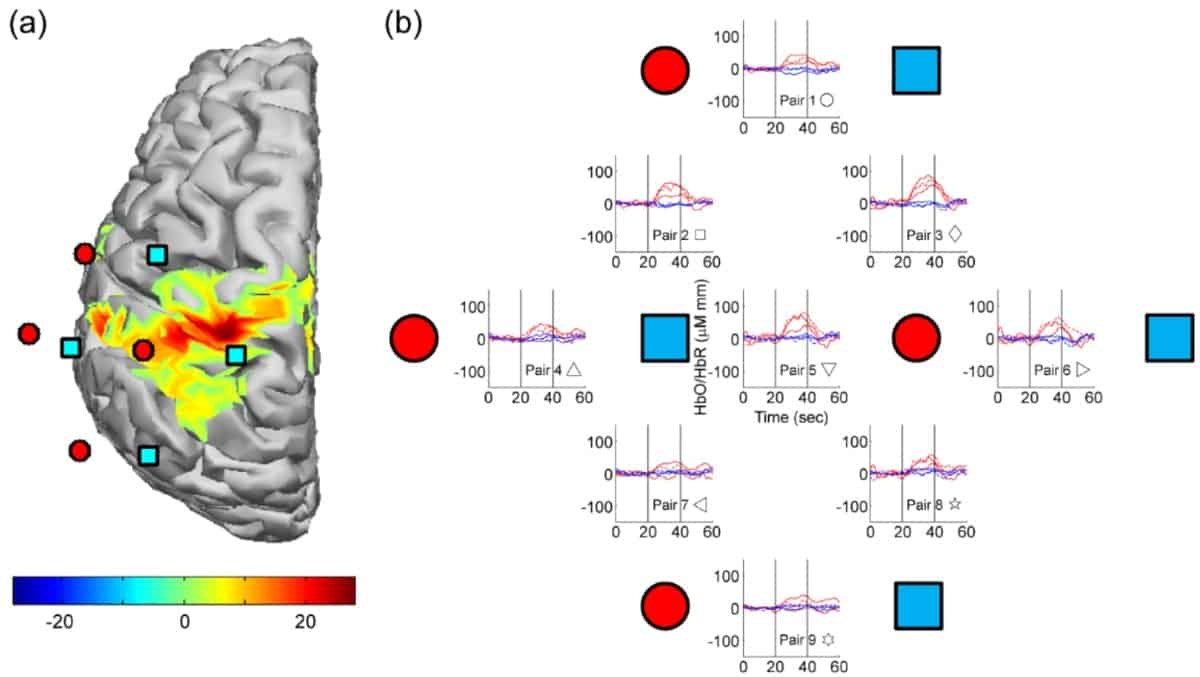
Visual inspection showed good overlap between the haemodynamic response functions measured using the fNIRS probes and the fMRI maps, evidence that the system works.
a) fNIRS probe positions superimposed on a fMRI t-stat map. b) Averaged fNIRS data; oxy-haemoglobin are the red lines. Haemodynamic changes consistently overlapped with fMRI data. (Courtesy: T Shimokawa et al Biomed. Opt. Express 10.1364/BOE.10.001393)
The researchers reconstructed DOT images and compared these to the fMRI image. They quantified the comparison by looking at the errors in localization, computed as centre of mass distances between oxy-haemoglobin (fNIRS) and fMRI maps. The error values were within the expected range.
Future directions
The team hopes to test the system on more subjects, as well as further optimize the multi-directional measurement by reducing assembly errors in source probes and better modelling of the NIR light sources. Finally, the researchers plan to miniaturize the probes for practical use, as well as for measurements performed on subjects with hair.
Big pharma is big for a reason. According to the Pharmaceutical Research and Manufacturers of America – the main representative of US drug companies and scientists – it takes on average 10 years to develop a new medicine, at a cost of roughly $2.6bn. Faced with such eye-watering numbers, it is clear why pharma is such a high-risk business – and why drugs often come at such a steep cost to those who need them.
But what if ill-fated drug candidates could be rooted out earlier? That is the promise of a new type of high-speed, high-mass-resolution spectroscopy technique that has been developed by physicist Ian Gilmore of the National Physical Laboratory (NPL) in Teddington, UK, and others. Unlike that mainstay of cell biology – super-resolution fluorescence microscopy – Gilmore’s “OrbiSIMS” technique has no need for fluorescent tagging. In principle, it can therefore be directed at objects that are incompatible with that approach – and in particular metabolites, the conveyors of all metabolic processes.
OrbiSIMS could spot previously undetectable signs of failure in the first phase of drugs testing
By tracking how metabolites change in response to new drugs, OrbiSIMS could let researchers spot previously undetectable signs of failure in the first phase of drugs testing, freeing up time and money to be redirected elsewhere. “It could open up completely new discoveries,” Gilmore claims.
Old idea, new direction
The first mass spectrometer was invented by the British physicist Francis William Aston a century ago. It enabled him to identify many of the first isotopes, and win the 1922 Nobel Prize for Chemistry just three years later. The concept was simple: he passed ions through a tube between the poles of a magnet and measured the degree of deflection using a photographic plate. The smaller an ion’s deflection, the greater its mass.
Today, the technique is rather more sophisticated and has a great variety of applications, from police forensics and the detection of environmental toxins, to cancer screening, protein characterization and drug development. It is no longer limited to identifying pure elements but can also be applied to any complex synthetic or biological materials whose molecules can be ionized. In this popular version of the surface-analysis technique – known as secondary ion mass spectroscopy (SIMS) – some sort of ionization source, or probe, is scanned over the material’s surface, raster fashion. This yields an image of the material, where every pixel has a mass spectrum. And if another ion beam shaves off a fine layer of the material’s surface between each 2D image, it is even possible to build up a 3D picture.
The most popular type of mass spectrometer used for imaging involves a time-of-flight (TOF) analyser, which accelerates the ionized molecules along a straight path to a detector with an electrostatic field. A timing system starts a clock once the molecules are ionized and stops it once they strike the detector, with their flight time being proportional to the square root of their mass. The system is so fast that it can complete, say, a 256 × 256 pixel image in minutes. The problem is that it is not all that accurate, because the flight time depends not only on mass, but also on the kinetic energy with which the molecules originally left their sample. The result appears as a spread of masses equivalent to a chromatic aberration, and limits the resolving power of TOF analysers to about 15,000.
“The huge frustration [with TOF] is that although we get images, we have no confidence of what they are of,” says Gilmore. “You can get around that in [synthetic] materials, because you have reference samples and so on, but in biology you really don’t stand a chance – the mass spectrum you get from a cell is so, so complicated. It’s like the Hubble Space Telescope before the lens was improved: the images looked pretty, but they were just a blur, and you couldn’t discover anything.”
In the late 1990s, building on work by other inventors, a Russian physicist called Alexander Alexeyevich Makarov developed an analyser for mass spectroscopy with much better mass resolution. Rather than send molecular ions to a detector, Makarov directed them into an electrostatic trap shaped like a tulip, or a shallot, around which they simultaneously orbited and precessed. Crucially, the frequency of precession – which could be measured via an induced current in an electrode and converted to mass via a Fourier transform – was independent of the spread in kinetic energy of the molecules entering. Makarov could therefore raise the mass resolving power into the hundreds of thousands. His system, the Orbitrap, was ultimately bought by the US equipment manufacturer Thermo Fisher Scientific.
Unfortunately, the Orbitrap solved the resolution problem at one great expense: speed. “Orbitrap takes a long time to take a 2D image, never mind a 3D image,” says Gilmore.
Although Gilmore has had an interest in clinical science from a young age, he was “too squeamish” to study biology at university, and so embarked on a career as a physicist, becoming an expert in mass spectrometry. When he set up the National Centre of Excellence in Mass Spectrometry Imaging at NPL in partnership with the University of Nottingham in 2012, however, a path back to his original interest presented itself, for the technique is used by life scientists more than any others. In particular, Gilmore established a working relationship with Colin Dollery, a leading pharmacologist formerly at the British pharmaceutical giant Glaxo Smith Kline (GSK), which “had this drive to better understand how drugs got into cells, and where they went, to try to reduce the attrition problem in drug testing”.
One evening in May 2011, Gilmore was preparing a presentation about the fundamental compromise scientists are forced to make in mass spectrometry imaging: fast but low resolution with TOF, or slow but high resolution with the Orbitrap and other Fourier-transform methods. One or two glasses of pinot later, he struck upon an idea: why not combine them? “We scientists should have more wine!” he reflects.
Bringing the idea of a combined TOF/Orbitrap instrument to fruition was no smooth ride, not least because of the need to share sensitive intellectual property between Thermo Fisher Scientific and the manufacturer of TOF analysers chosen by Gilmore, IONTOF, based in Germany. “I needed to bring these guys together, which is not as easy as it sounds,” says Gilmore. “But it was really fortunate that I already worked a lot with GSK, which was a great help, especially because it could show the need for this new technology.” The project started in 2013. Four years later, OrbiSIMS was born.
In essence, OrbiSIMS consists of a single sample and ionization stage that can feed either a TOF or Orbitrap analyser via an electrostatic switch (figure 1). Typically, a user performs an initial scan in TOF mode (rather like a “preview scan” on a document scanner), identifies a small area of interest, and then explores it in more detail in Orbitrap mode. Such a methodology would be impossible with separate TOF and Orbitrap instruments, as the sample would have to be moved from the former to the latter, and the location of the area of interest would be lost. OrbiSIMS can perform 3D scans, too. In this set-up, the TOF analyser takes a 2D scan before a layer of material is removed; that layer of material is then sent over to the Orbitrap analyser, which gives an average (but precise) mass spectrum, and the process repeats (Nature Methods14 1175). “We’re mostly looking at biological systems, but it’s also very powerful for looking at organic electronic systems and multi-layered systems, for example,” says Gilmore.
1 Dual configuration OrbiSIMS allows a user to select between fast time-of-flight (TOF) analysis and a more detailed Orbitrap analysis via an electrostatic switch. Typically, the TOF analysis is performed first to identify any regions of interest, a process that takes about 30 minutes. Such regions are then followed up with the Orbitrap analysis, which takes several hours. (Courtesy: Adapted by permission from Springer Nature: Nature Methods14 1175 Passarelli et al. 2017)
Broad applications
Ricky Wildman, an engineer at Nottingham, has already been using one of the first OrbiSIMS instruments to investigate the curing of new polymer materials in 3D printing. “One of the difficulties we have is that the structures that we are resolving are small – potentially down to 100 nm – and consist of materials that have very similar [chemical] fingerprints,” he explains. “For us, already, we are beginning to see that the increased spatial and mass resolution of [OrbiSIMS] is shedding light on the curing mechanisms. This is tremendously exciting.”
Meanwhile, Lucy Collinson, a microbiologist who runs the Electron Microscopy Science Technology Platform at the Francis Crick Institute in London, wonders whether OrbiSIMS could complement electron microscopy, which currently struggles to identify molecules in cells. One reason she and her colleagues want to do this is to understand whether a drug has reached the right location to fight a bacterial infection. “OrbiSIMS, and other spatial elemental analysis techniques, may allow us to do this at the nanoscale,” she says – adding, however, that it would require the development of specific sample-preparation techniques.
The chief competition for OrbiSIMS comes from super-resolution fluorescence microscopy, in which a fluorescent tag, or fluorophore, is attached to a biological macromolecule – a certain protein, for instance. This method allows a user to observe and track the macromolecule with an optical microscope, despite that macromolecule being smaller than the diffraction limit of visible light, about 200 nm. Developed in the early 2000s, it is incredibly powerful, and won its inventors Eric Betzig of the Howard Hughes Medical Institute in Virginia, US, Stefan Hell of the Max Planck Institute for Biophysical Chemistry in Göttingen, Germany, and William Moerner of Stanford University in California, US, the 2014 Nobel Prize for Chemistry.
What fluorescence microscopy cannot do, however, is track metabolites – the reactants and products of metabolic processes, including drug molecules themselves – because they do not simply move around, but are actually created by cells. Spotting and tracking metabolites would be highly valuable to pharmacologists, because changes in them provide one of the first clues that something in the body is going awry. Since such tracking is not usually available, failures in potential drugs are often only picked up at later stages of testing, at great cost. “If a drug fails at a late stage in a clinical trial, you’ve probably already spent a billion on R&D,” says Gilmore.
Since it requires no fluorescent tagging, OrbiSIMS potentially offers a way to track metabolites. The catch is that its spatial resolution, at about 1.4 µm, currently lags well behind fluorescence microscopy. The limiting factor, according to Gilmore, is in the initial ionization of the sample: the smaller the area focused on, the greater the density of ions required. But ionization is a murky process. Scientists know that an ion probe sets up a chain reaction among atoms and molecules inside a sample until the energy eventually returns to the surface, ejecting one of the molecules there. Quite how this molecule becomes ionized, however, is poorly understood.
Gilmore and his colleagues are performing synchrotron-based experiments to see whether a laser system could work with a traditional ion probe to improve the ionization efficiency. If it succeeds, an ion probe would eject the sample’s molecules, while a laser would photo-ionize them. “That sounds simple, but people have been trying to do it for a long time,” says Gilmore. “But laser technology is improving.”
In the meantime, he and his colleagues are welcoming scientists from all disciplines to consider the benefits of OrbiSIMS at one of the two instruments currently in existence: the original at NPL, and the first production model at the University of Nottingham. “People in the UK are lucky,” he says. “It has two, and there are only two in the world!”
UX-1 robot underwater at the Kaatiala field trials (Courtesy: UNEXMIN)
It is fair to say that European nations have been at the forefront of developing renewables, such as wind turbines and solar panels. Although the bulk structures of these technologies are made using common materials such as steel and silicon, they also have components containing rare-earth elements such as neodymium, praseodymium and indium.
The concerning thing for Europe is that the majority of these scarcer materials are imported, especially from China, leaving the continent vulnerable to shortages and dramatic price hikes. At the same time European industry is also heavily reliant on the rest of the world for other important metals and minerals. In short: Europe needs to rediscover its mining mojo.
Help may now be on its way in the form of robots. That’s what I learned this week in Vienna at a session of the general assembly of the European Geosciences Union. Luís Lopez of La Palma Research Centre in Spain gave an update on the UNEXMIN project, which is developing robotic systems for the autonomous exploration and mapping of Europe’s flooded mines.
Lopez explained that Europe’s rich industrial heritage has left a vast network of approximately 30,000 closed mines. These mines closed due to a range of economic factors, not necessarily because of complete mineral depletion. But as the years have passed, the majority of the mines have flooded, making it dangerous and expensive to assess their potential for reopening.
To tackle this problem, the UNEXMIN team are developing a trio of spherical robots that can enter these mine networks and carry out detailed surveys. Their arsenal of scientific instruments includes cameras, sonar, a water sampler and multispectral cameras, developed at the University of Miskolc in Hungary. The aim is for the three robots – named UX-1a, UX-1b and UX-1c – to work as a team collecting different sorts of data to get the most out of their battery life.
UX-1 being lowered into the flooded Idrija Mine during field trials (Courtesy: UNEXMIN)
In April 2018 the first prototype was unveiled, weighing 110kg with a 0.6m diameter. Its speed is 1–2 km/hr and its maximum operational depth is 500m with autonomy up to 5 hours. Since that time, the team has run trials in Finland’s Kaatiala mine (a former source of quartz and feldspar) and Slovenia’s Idrija mine (an historic source of Mercury). This month, the team will finish its test at Portugal’s Urgeiriça uranium mine, ahead of a final trial in May at the UK’s Ecton Mine, a former source of copper, lead and zinc.
Due to the risk of losing the untested robot in such harsh environments, the device has so far been tethered to an operating system by an “umbilical chord”. But the long term aim is create fully autonomous robots that can be used by mining companies, researchers and other organisations interested in these sites.
The project is supported with money from the EU’s Horizon 2020 programme and the team has already created a spinout company. The technology could also be used to explore archaeological sites and places of cultural interest. The team is also developing an interface so that the general public can interact with the data via VR sets.
Top: 7T MRI at baseline (left) and 1.5-year follow-up (right) in a woman with secondary progressive MS, showing the development of two intracortical lesions. Bottom: 7T MRI at baseline (left) and 1.4-year follow-up (right) in a woman with relapsing remitting MS, showing a new leukocortical lesion. (Courtesy: RSNA)
Multiple sclerosis (MS) is a disease in which the body’s immune system attacks the protective covering surrounding the nerves of the central nervous system. Once considered a disease of the brain’s white matter, recent research has shown that cortical lesions, or lesions in the grey matter of the outer layer of the brain, develop earlier in the course of the disease.
While cortical lesions are not easy to see with conventional 3 Tesla MRI, researchers have now demonstrated that 7 Tesla (7T) MRI can be used to visualize these lesions. They also found that the development of lesions in the cortical grey matter is a powerful predictor of neurological disability for people with MS, and suggest that ultrahigh-field MRI could play an important role in evaluating disease progression (Radiology2019; 00:1–10).
“Because 7T MRI is more sensitive to cortical lesions than lower-field MRI, we can detect many of these lesions that we couldn’t see before and determine if they are strongly correlated with neurological disability and disease progression,” explains senior author Caterina Mainero from Massachusetts General Hospital. “In this study, we wanted to track the evolution of these lesions and better understand where in the cortex these lesions develop more frequently.”
Mainero and colleagues followed 20 patients with relapsing remitting MS and 13 with secondary progressive MS over time, along with 10 age-matched healthy controls. In relapsing remitting MS, the patient’s symptoms sometimes improve and sometimes worsen, while secondary progressive MS is characterized by more significant disability.
Twenty five MS patients developed new cortical lesions during the follow-up period. And 7T MRI detected these lesions more frequently than lower-field MRI achieved in previous studies. On average, the number of lesions that developed in the cortical region was more than twice the number that developed in the white matter.
The 7T scans revealed that the cortical lesions tended to accumulate in sulci, which are grooves on the brain’s surface. The researchers also observed that the total volume of cortical lesions was a predictor of neurological disability, at both baseline and follow-up assessment. “We found that these lesions can predict disability progression more than white matter lesions, which are the typical lesions of MS we’ve been studying for years,” says Mainero.
The findings suggest that assessment of cortical lesions should become a major component in the evaluation of progression of disease burden in MS. “This can have a very powerful impact on how we monitor patients with MS,” Mainero explains. “We can also use this tool to see how potential treatments can affect the development and evolution of cortical lesions.”