A bright laser beacon that announces our presence to extraterrestrial civilizations could soon be achievable, new research suggests. Calculations done by James Clark and Kerri Cahoy at the Massachusetts Institute of Technology suggest that current and near-future technologies could be used to produce light intense enough to be detectable to extrasolar astronomers as distant as 20,000 light-years away. The duo’s research also sheds light on how we could detect signs of intelligent life in star systems beyond our own.
For decades, some in the astronomy community pondered what would be the best way of communicating with intelligent alien life on distant planets. Once a purely academic question, the desire to communicate has been heightened recently by the ongoing discovery of large numbers of exoplanets orbiting stars other than the Sun.
Recently, two nearby exoplanets have proved particularly attractive for such efforts. These are Proxima Centauri b, a planet which lies in the habitable zone of our closest star just 4 light-years away; and the TRAPPIST-1 system, which at a distance of 40 light-years is believed to contain three potentially habitable exoplanets, are currently viewed as our best hopes for receiving replies to our messages.
Focussing on aliens
An important challenge is how to create a signal that stands out from glare of the Sun. In their study, Clark and Cahoy set out to show that the odds of such signals being detected could be greatly improved by focusing megawatt-power lasers using large telescopes. To do this, the researchers first calculated the resulting intensity when infrared lasers of various different powers were combined with telescopes of varying aperture sizes. They then calculated the resulting apparent magnitudes of the beams when viewed at varying distances from the Sun.
Clark and Cahoy discovered that a 2 MW signal fired through a 30 m telescope would have a large enough magnitude to clearly stand out from the Sun’s natural variation in infrared emissions to astronomers on Proxima Centauri b. At the same time, a 1 MW laser combined with a 45 m telescope would not only be clearly detectable in TRAPPIST-1, but would be visible at 20,000 light-years away – covering the entire Orion Arm of the Milky Way. The beams would also be broad enough to encompass the entire habitable zones of more distant stars, and could carry data at rates of several hundred bits per second, allowing for exchanges of complex messages.
Significantly, Clark and Cahoy showed that these feats are all achievable within our current grasp of both laser and telescope technologies. While the US Air Force has already demonstrated its megawatt Airborne Laser, both the 29 m Giant Magellan Telescope, and the 39 m European Extremely Large Telescope, are currently under construction in Chile, each due to begin operation in the mid-2020s. With these technologies within practical reach, it now seems that communicating with our galactic neighbours could be easier than we realized.
Linear accelerator (linac) commissioning makes certain that treatment machines used for delivering high-energy X-rays for radiotherapy are fully functional and ready for clinical use. Until the process is complete and physicists are satisfied with the data, no patient can benefit. And this commissioning process is not just necessary for newly installed linacs. Evaluation tests must be completed after servicing, system updates and as part of annual machine checks.
“If there’s any major change in the equipment, we need to verify that everything is behaving as expected because this data is shared with the treatment planning system,” explains Sally Fletcher, a medical physicist based at University Hospitals Bristol NHS Foundation Trust in the UK.
Measurements from the commissioning process are fed into a model, which is used to match the high-energy X-rays generated by the linac to the shape and depth of target tumours in patients. “You need to be sure that this model is correct for all of the energies available on the linac across different field shapes,” says Jackie Haynes, a principal clinical scientist who works alongside Fletcher in the Radiotherapy Physics Unit. “That’s why it’s necessary to carry out hundreds of test scans and dose measurements.”
Data collection involves using a large water tank fitted with a detector that scans across the incoming radiation beam. With many combinations of linac parameters to evaluate, the number of tests soon adds up – which means that tank work can take weeks to complete. However, automated and guided beam commissioning software can optimize the workflow and streamline the process.
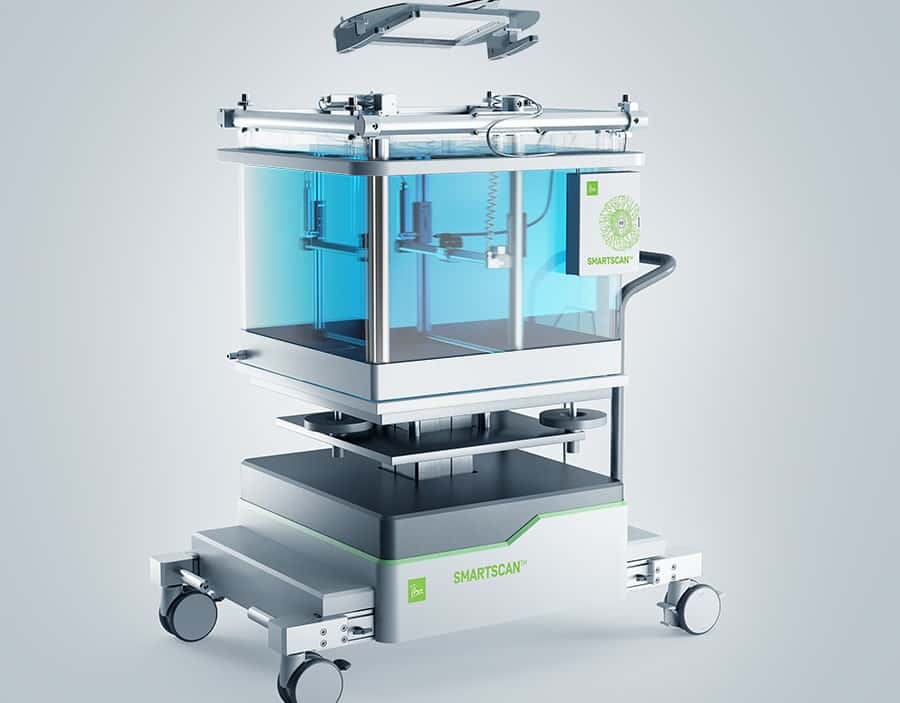
One such package is SMARTSCAN, which has been developed by IBA in Germany. The company reached out to Fletcher and Haynes – who have commissioned multiple linacs throughout their careers – for their thoughts on its product. As part of the feedback process, the pair deliberately included errors in the linac setup to see how well SMARTSCAN was able to spot the mistakes. “Happily, it noticed them all,” reports Haynes.
Commissioning doesn’t happen that often, so it’s helpful to have a guided workflow, especially for team members that may not have experienced the installation of a new machine.
Jackie Haynes, University Hospitals Bristol NHS Foundation Trust, UK
SMARTSCAN highlights any suspicious data on-screen using a colour-coded system that indicates the severity of the problem, as defined by user-set tolerances. The software also goes a step further and suggests possible causes of the error – bolstering its capability as a training tool. “It’s a useful feature that has the potential to become even smarter in the future,” adds Fletcher.
SMARTSCAN prompts users if values suggest that the linac needs adjusting – for example, if one of the machine settings hasn’t been updated correctly for the next test scan in the sequence. Other useful additions include automatic electrometer signal normalization, which takes place following each change of field size, energy or detector position.
“The software is continuously measuring the quality of the inputs and will alert you in real time if a detector is becoming too noisy, or whether another sensor would be more appropriate, so that you can remedy the issue promptly,” Haynes comments. “It saves you from carrying out a long series of measurements only to discover issues when you analyse that day’s data back in the office.”
Once it has been initialized with the specification of the centre’s linacs, SMARTSCAN optimizes the scanning order and tracks the data-gathering process. “We have lots of matched linear accelerators, so that patients can swap easily between machines, and the commissioning software will tell you as you go along whether you are matched to your gold standard,” says Fletcher. “SMARTSCAN also saves you from having to hunt down this information months later – as once it’s in the system, the data is easy for colleagues to find.”
Measurements made easy
The user prompts and software instructions help to keep tasks fresh in the mind of the operator. The notifications also provide estimates of how long each step will take, and the screen layout shows progress from start to finish. “Commissioning doesn’t happen that often, so it’s helpful to have a guided workflow, especially for team members that may not have experienced the installation of a new machine,” says Haynes.
Before launching the main queue, the software requests a series of baseline measurements to check, for example, that the water tank is level and the gantry angle is positioned so that the beam is orthogonal to the surface. “We’re aiming for millimetre accuracy, which means making sure that the detector is exactly aligned with the axes of the beam,” explains Fletcher.
The next step is to run a series of preliminary scans, which double-check the health of the linac before proceeding with the full evaluation. “Here the system is looking for beam symmetry,” Haynes comments. “It means that you can be confident that your set-up is configured to gather good data when you begin the main scans.”
The feature is another example of how software automation can enable faster, more efficient linac evaluation – reducing the need for repeat measurements and generating high-quality beam data in the shortest possible time to maximize machine operation and availability for patient care.
And it’s not just software that can make a difference to evaluation efficiency. IBA offers a so-called stealth chamber for gathering reference data, which – once mounted on the machine – suits multiple field settings. “It means that you don’t have to keep going in and out of the linac room with each change in field size to move the position of your reference detector, which is typically placed at the edge of the field to give a consistency check during measurements,” says Haynes. According to IBA, its reference detector could save up to two hours per day of commissioning.
More information on the SMARTSCAN set-up is available on the IBA website.
A single-molecule DNA “navigator” that can successfully find its way out of a maze constructed on a 2D DNA origami platform might be used in artificial intelligence applications as well as in biomolecular assembly, sensing, DNA-driven computation and molecular information and storage. The device works thanks to a domino-like process dubbed “proximal strand exchange cascade”.
DNA origami exploits the base pairing of DNA’s four nucleotides, A, T, C and G, to produce an infinite variety of self-assembled engineered shapes. The resulting nanostructures can be used as scaffolding or as miniature circuit boards. A team of researchers led by Friedrich Simmel of the Technische Universität München and Chunhai Fan of the Chinese Academy of Sciences in Shanghai has now used the technique to make a maze whose structure resembles a mathematical “tree graph”. The edges of the tree are defined via anchoring sites constructed using DNA staple strands on the origami and vacant areas without staples correspond to ‘walls’ in the maze.
The structure is equivalent to a ten-vertex rooted tree with three junctions and contains one entrance and one exit defined and denoted as vertices ENT and EXIT, respectively (see figure).
Path paving
The researchers then placed a navigator made from a “DNA walker” in the maze. This nanobot can be directed to take a specific path along the network of tracks laid down on the DNA origami platform thanks to the progression of hybridization chain reactions on it, explains Fan.
“When we activate this system (with an initiator DNA molecule), a DNA hairpin structure immobilized on the origami substrate triggers a sequence of conformational changes (also known as path paving) on other DNA hairpins, from one neighbour to another, at well-defined positions. This mechanism, which we have dubbed proximal strand exchange cascade (PSEC), is like what happens in a domino show.”
Parallel depth-first search
The progressing PSEC stochastically turns at the junctions and corner points of the maze structure, he says. Each single-molecular navigator therefore autonomously explores one of the possible paths through the maze in a process known as a parallel depth-first search (PDFS).
“Our system is composed of a huge number of such single-molecule DNA navigators that collectively explore all possible paths through the maze and a vast number of PSEC events thus occur simultaneously.”
To filter out the correct exit path from all the other possible solutions, the researchers chemically modified the vertex of the exit of the maze. They then imaged this path using atomic force or super-resolution microscopy. The first technique measures the height difference between formed paths and unreacted areas, explains Fan, while the second “DNA-PAINT” technique allows for florescence imaging of the path with nanoscale resolution.
Towards autonomous and intelligent nanoscale robotic systems
“Our work is another important step towards realizing autonomous and intelligent nanoscale robotic systems,” he tells Physics World. “Such systems behave more like the biomolecular machines found in Nature that couple molecular action to simple decision-making processes.
“Our research should help advance the fields of DNA nanotechnology and biomolecular self-assembly as well as embodied artificial intelligence. Our navigator system could also find use in applications such as single-molecule sensing for intelligent disease diagnosis and treatment, as well as in molecular information storage and transfer.”
Today many regions rely on ever more sophisticated irrigation systems, using pumps and water sensors to grow crops on otherwise unworkable land as efficiently as possible. But not every part of the world benefits from modern irrigation and lack of freshwater is often the major limiting factor in crop production. Now a study reveals that global irrigation levels could sustainably increase by nearly 50%, boosting crop yields and feeding an additional 2.8 billion people.
“The reason that this intensification of irrigation hasn’t happened before is mainly economic, plus a lack of institutional organisation,” says Lorenzo Rosa from the University of California, Berkeley, US.
Not everywhere has enough spare water for intensified irrigation, however. To work out which locations could best use improved irrigation technology, Rosa and colleagues carried out a biophysical assessment of cropland water consumption under current and maximum yield scenarios. Then they compared the current and maximum yield water consumptions with local water availability to see which regions could afford to irrigate more, and what kind of increase in yield they would expect.
Globally there is enough spare freshwater to increase irrigation by 48% (408 cubic km of water per year), the researchers found. Around one quarter of the world’s rain-fed croplands could benefit, and with this additional water crops could be expected to produce 37% more calories: enough to feed an additional 2.8 billion people. The team looked at 16 staple crops: barley, cassava, groundnuts, maize, millet, oil palm, potatoes, rapeseed, rice, rye, sorghum, soybeans, sugar beet, sugar cane, sunflower and wheat.
The countries that stand to benefit most from sustainable intensification and expansion of irrigation include China, the US, India, Russia, Brazil and Nigeria. But the benefits are widespread. Rosa and his colleagues show that 50 countries could double their food production; 29 of these are in Africa.
Not everywhere is responsible with its water usage. “Some of the world’s major agricultural baskets such as the US High Plains and California’s Central Valley, the North China Plain, the Murray-Darling Basin of Australia, and the Indo-Gangetic Basin consistently exhibit unsustainable water use, where blue [ground] water consumption exceeds its local availability,” says Rosa.
Even when these unsustainable regions were eliminated, Rosa and colleagues show that intensified irrigation can still produce 24% more calories than today, feeding an additional 1.8 billion people.
The calculations don’t take into account how changes in future climate might affect productivity and water availability, or any additional nutrients and fertilisers needed to farm the land so intensively. However, they demonstrate that intensifying irrigation in some regions could play a major role in achieving global food security and preserving freshwater ecosystem services.
PET/MRI is set to shake up tumour biology imaging and is already proving to be a useful algorithm development tool in machine learning, delegates were told at the Conference on Hybrid Imaging Live (CHILI), held in Barcelona, Spain, on 26 October.
Speaking at the conference, Thomas Beyer, president of the European Society for Hybrid, Molecular and Translation Imaging (ESHIMT), highlighted the advantages of PET/MRI in the medical field and pointed to where its future shone brightest. He underlined his opinion that PET/MRI was less of a modality in clinical routine and more of a noninvasive tumour phenotyping machine.
“The clinical utility of PET/MR is challenged by PET/CT, which has excelled in oncology for whole-body staging. PET/MR took a long time and a lot of effort to develop but in oncology yields no superior diagnostic benefits to PET/CT, and its exams are lengthier,” Beyer told AuntMinnieEurope.com ahead of the event.
PET/CT has excelled in oncology for whole-body staging. (Courtesy: Thomas Beyer)
“Instead, PET/MR’s strengths lie in its ‘fifty shades of grey’ soft-tissue contrast, meaning that it can be used locally and regionally for better tumour phenotyping, local staging, and to assay tissue density biomarkers. In addition, the adoption of MR navigators can help compensate for involuntary patient motion, thus, improving the quality and accuracy of the adjoined PET information,” he added.
Beyer’s talk focused on the following four main points:
PET/MRI is a technical revolution that has led to medical evolution.
The benefit over standalone PET is in the conscious choice of CT and MR protocols and in the adoption of CT- and MR-driven correction schemes of PET.
PET/MRI is an expensive deblurring machine for PET data.
PET/MRI is a promising tumour-phenotyping tool.
In his talk, Beyer commented on three meta-analyses, each comprising 1000 patient cases taken from several studies that demonstrated PET/MRI’s comparable diagnostic value with PET/CT for whole-body staging but higher time costs. Even with faster protocols, the quickest MR technique took 30 to 40 minutes, compared with around 10 to 20 minutes for PET/CT.
However, PET/MRI’s capacity for motion compensation meant improved quantification that added greater value to PET images, he continued. Because the duration of the PET process is relatively long, involuntary patient movement such as respiration, heartbeat and muscle contraction cause blurring in pictures. However, the use of motion detection and motion vectors can reduce this blurring.
“If you can improve the value of the images, the heterogeneity of a tumour that may appear homogeneous on CT will become more apparent at the MR level. This improved image quality allows for more robust and more accurate voxel-based analysis, and makes PET/MR a more suitable tool than PET/CT for tumour phenotyping,” he explained.
Thomas Beyer from Medical University Vienna.
An ongoing study at Medical University of Vienna, where Beyer is a professor of physics of medical imaging, is looking at the possibility of replacing physical biopsy of the prostate with virtual biopsy. The research is being conducted by colleagues in the departments of nuclear medicine, urology and pathology. Patients with primary prostate cancer undergo a dual-tracer PET/MR exam to noninvasively assess the prostate, which is then surgically removed, sliced and histopathologically studied. The slices are curated for malignant areas and correlated to the corresponding areas in PET/MR images before serving as an input to machine-learning algorithms.
Using such algorithms taught by PET/MR images, programs will identify suspicious areas so that doctors could target biopsies or even initiate treatment for malignant tumours.
While much work remains to be done, so far preliminary results from 100 patients suggest that purely machine-based differentiation is highly accurate, according to Beyer, and in the short term, this could result in more targeted biopsies.
“Because PET/MR offers machine learning a lot of parameters — soft-tissue differentiation, cellular density and flow, among others — I hope those listening to the presentation will think about how PET/MR can be used in lieu of being just an image fusion tool,” Beyer noted. “Furthermore, it’s important to stress that PET/MR should not be operated by only nuclear medicine doctors or radiologists. This modality needs a truly multidisciplinary approach and a multidisciplinary environment as it is more complex than PET/CT and provides data of interest to a range of specialties, including pathologists.”
This joint approach would also help to depoliticize the hotly debated issues prevalent in the use of the modality and would prove a cradle for emerging clinical ideas and hypotheses.
Current barriers hampering PET/MRI include cost, as the latter systems stand at double the price of PET/CT, Beyer noted. There is also a lack of cooperation particularly in the willingness of different stakeholders to share data. Everybody engaged in clinical patient management when PET/MRI is a part of the process needs to join in PET/MR study management, he added.
Asked by the meeting’s moderator, journalist and broadcaster Karen Coleman, what he would have done differently with regard to PET/MRI’s development, he said he would have placed the technology in the hands of those with a track record of collaborating together.
“In terms of PET/MRI, like climate change, we know there is a problem, that we want to deal with it, that we should deal with it because the taxpayer has given us money to do so, but we are unsure if it can be solved,” Beyer told delegates. “But also like climate change, PET/MRI is known to many people. It has gone global, and it has started to warm people up to its use.”
More than 3000 attendees registered for the virtual congress hosted by the European Society of Radiology and ESHIMT on Friday. The conference was free of charge and open to everyone with an interest in hybrid imaging, regardless of their prior knowledge. It offered a range of tailored sessions dedicated to both basic and advanced applications in hybrid imaging and its clinical application. The conference was also accredited by the European Accreditation Council for Continuing Medical Education (EACCME), and participants were able to claim 5 CME credits for attending the event.
Scientists in the UK have discovered that the fur of some moths can absorb up to 85% of incoming ultrasound. According to the researchers, this fur acts as a “stealth coating” providing the moths with a passive, acoustic camouflage that helps hide them from the ultrasonic clicks of insect-hunting bats. The team says that the fur could inspire the development of biomimetic materials for ultrathin sound absorbers and other noise-control devices.
Bats love to eat moths, which they hunt down using a biological sonar technique, known as echolocation. In the arms race between predator and prey, some moths have evolved ears so they can hear the ultrasonic calls of bats and take evasive action. But it turns out that others have evolved a more passive defence in the form of acoustic camouflage.
In work presented earlier this week at the Acoustical Society of America’s 176th Meeting in Canada, Thomas Neil and colleagues at the University of Bristol used acoustic tomography techniques to compare the sound absorbing properties of two species of deaf moth – the Madagascar bullseye moth and the promethea silkmoth, which are preyed on by bats – to two species of butterflies, which are not bat prey.
Furry thorax
At bat echolocation frequencies, the team found that the thorax fur of the moths acted as an acoustic camouflage, absorbing up to 85% of the incoming ultrasound. In contrast, most butterflies absorbed just 20% of incoming ultrasound.
“We tested the absorption from 20-160 kHz, this covers the frequencies that most bats use to hunt their prey, with most calling from 20-60 kHz, whilst there are a few that go to higher frequencies,” Neil explains. “We found the absorption to be remarkably consistent across the range tested, with no apparent frequency dependence in the effect on absorption.”
When fur was removed from a moth’s thorax the researchers discovered that the chance of the moth being detected increased by up to 38%. Neil told Physics World that this is due to the change in the “detection volume”.
Detection volume
“We are able to calculate the change in detection distance by which a bat would be able to detect a moth with it’s fur intact and a moth with it’s fur removed,” Neil explains. “We do this for numerous angles which allows us to calculate a detection volume, which is a volume of 3D space within which the bat would be able to detect the moth.”
When the team examined the insects, they found that the fur on the moths was both thicker and denser than that of the butterflies. Neil says that the structure and layout of the moth fur is similar to that found in natural fibres like hemp and kenaf that are used in sound insulation, but on a much smaller scale. These natural fibres act as porous sound absorbers dissipating sound energy as the sound waves enter air filled cavities in the materials.
“We did some modelling to see if the moth fur behaved as a porous sound absorber and found good agreement between the predicted and measured absorption,” Neil says. “The moth fur is porous enough to allow the sound to penetrate the material without reflecting it back to the bat.”
Significant survival advantage
According to the researchers, by acting as a lightweight porous sound absorber the thorax fur of the moths provides acoustic stealth at all ecologically relevant ultrasonic frequencies, facilitating acoustic camouflage and offering a significant survival advantage.
They also found that the performance of the moth fur as a broadband and multidirectional ultrasound absorber is on par with current porous sound-absorbing foams, and say that it could inspire the development of ultrathin sound absorbers and other noise-control devices.
The seas are getting hotter – and researchers have thought again about just how much faster ocean warming is happening. They believe that in the last 25 years the oceans have absorbed at least 60% more heat than previous global estimates by the UN’s Intergovernmental Panel on Climate Change (IPCC) had considered.
And they calculate this heat as the equivalent to 150 times the annual human electricity generation in any one year.
“Imagine if the ocean was only 30 feet (10 m) deep,” said Laure Resplandy, a researcher at the Princeton Environment Institute in the US. “Our data show that it would have warmed by 6.5 °C every decade since 1991. In comparison, the estimate of the last IPCC assessment report would correspond to a warming of only 4 °C every decade.”
The oceans cover 70% of the Blue Planet, but take up about 90% of all the excess energy produced as the Earth warms. If scientists can put a precise figure to this energy, then they can make more precise guesses about the surface warming to come, as humans continue to burn fossil fuels, release greenhouse gases such as carbon dioxide into the atmosphere, and drive up the planetary thermometer.
At the academic level, this is the search for a factor known to climate researchers as climate sensitivity: the way the world responds to ever-increasing ratios of greenhouse gas in the atmosphere.
At the human level, this plays out as ever-greater extremes of heat, drought and rainfall, with ever-higher risks of catastrophic storm or flood, or harvest failure, and ever-higher tallies of human suffering.
Comprehensive global measurements of ocean temperature date only from 2007 and the network of robot sensors that deliver continuous data about the top half of the ocean basins.
Resplandy and her colleagues report in the journal Nature that they used a sophisticated approach based on very high-precision measurements of levels of oxygen and carbon dioxide in the air.
Gases released
Both gases are soluble, and the oceans are becoming more acidic as the seas absorb ever-greater levels of carbon dioxide. But as seas warm, they also become less able to hold their dissolved gases, and release them into the atmosphere.
This simple consequence of atmospheric physics meant that the researchers could use what they call “atmospheric potential oxygen” to arrive at a new way of measuring the heat the oceans must have absorbed over time.
They used the standard unit of energy: the joule. Their new budget for heat absorbed each year between 1991 and 2016 is 13 zettajoules. That is a digit followed by 21 zeroes, the kind of magnitude astronomers tend to use.
The new finding counts first as an academic achievement: there is now a more precise thermometer reading, and new calculations can begin.
One of the researchers, Ralph Keeling of the Scripps Institution of Oceanography, said: “The result significantly increases the confidence we can place in estimates of ocean warming and therefore help reduce uncertainty in the climate sensitivity, particularly closing off the possibility of very low climate sensitivity.”
It means that there will have to be an even more drastic shutdown of fossil fuel investment and an even faster switch to renewable sources of energy such as sun and wind power.
The kind of dynamos thought to be behind the huge magnetic fields found in stars and galaxies, may also exist in Weyl semimetals, materials more common to a solid-state laboratory. Why does this matter? As Belle Dumé points out, the presence of dynamos capable of generating and sustaining a magnetic field in readily available metal systems could provide a handy lab-sized model for what researchers Victor Galitski, Mehdi Kargarian, and Sergey Syzranov describe as the “beautiful astrophysical phenomenon, first proposed by Larmor in 1919.”
Wily Weyls
While a Weyl metal may be found in more manageable proportions than a star or a galaxy, these materials are not without their own brand of exoticism. Electronic excitations in these crystals take the form of charge carrying Weyl fermions – massless chiral quasiparticles.
The discovery of Weyl points is not only the smoking gun to a scientific mystery
Hermann Weyl predicted their existence in his solution of the Dirac equation, and they have contributed to some of the keystones in fundamental physics – quantum field theory and the standard model. Crucial but elusive, Weyl fermions were not observed for more than 85 years, when two separate reports of them appeared. In 2015 M. Zahid Hasan at Princeton University in the US and colleagues in the US, China, Taiwan and Singapore reported experimental observations of a Weyl metal in TaAs single crystals. Elswhere Marin Soljačić and colleagues at Massachusetts Institute of Technology in the US and Zhejiang University in China spotted evidence for Weyl fermions in a a “double-gyroid” photonic crystal. “The discovery of Weyl points is not only the smoking gun to a scientific mystery,” said Soljačić, adding, “it paves the way to absolutely new photonic phenomena and applications.”
Just a few months later researchers at ETH Zurich in Switzerland, Princeton University in the US and the Chinese Academy of Sciences extended the family of Weyl semimetals with their predictions of a new type of Weyl semimetals. When solving the Dirac equations Weyl had conscientiously maintained Lorentz symmetry, an important invariance principle for particle physicists. For condensed matter researchers Lorentz symmetry is not such an issue and by generalizing the Dirac equation Alexey A. Soluyanov and colleagues revealed the type II Weyl semimetal.
More recently studies of the type-II Weyl semimetal phase of MoTe2 solicited yet more interest. Jian-Hao Chen and colleagues at Peking University, Collaborative Innovation Center of Quantum Matter and Tsinghua University in China observed resistivity jumps that indicated the Barkhausen effect. More than just a useful way of characterizing ferroelectric and ferromagnetic materials, the Barkhausen effect is a stochastic process that shows universality – “the observation that a wide range of macroscopic systems behave in much the same way, even if the systems have different microscopic components” as Hamish Johnston explains in his coverage of no less than three Nature reports of universal behaviour in systems far from equilibrium.
Weyl you’re not alone
Given their recent track record, perhaps the possibility of gaining insights from Weyl semimetals as to the origins of magnetism in vast astrophysical objects is less of a surprise. However they are not the only systems to have provided convenient solid-state analogues for probing cosmological phenomena. In July Dumé also reported theoretical calculations by a team in Canada, the US, UK and Israel revealing a quantum hologram in a graphene flake that faithfully reproduces some of the signature characteristics of a black hole.
“In recent years, physicists have gleaned important new insights into these questions through the study of the SYK [Sachdev-Ye-Kitaev] model,” explained lead researcher Marcel Franz of the University of British Columbia in Canada. “This model is an illustration of a type of ‘holographic duality’ in which a lower-dimensional system can be represented by a higher dimensional one. In our calculations, the former is N graphene electrons in (0+1) dimensions and the latter the dilation gravity of a black hole in (1+1) dimensional anti-de Sitter (AdS2) space.”
The graphene flake must meet certain requirements: it must have an irregular boundary because of the random structure of electron-electron interactions in the SYK model they use, and it is subjected to an intense magnetic field. Nonetheless it is straightforward to fabricate and far easier to handle than a black hole.
The above two-minute piece of music was inspired by the 5000th Martian sunrise as captured by NASA’s Opportunity rover. Called “Mars soundscapes”, it was created by Domenico Vicinanza University, Genevieve Williams of the University of Exeter and colleagues by the sonification of an image of the rising Sun taken by Opportunity. The piece will be premiered on 13 November at the NASA booth at the Supercomputing Conference SC18 in Dallas, Texas.
The UK-based organization Sense about Science describes itself as “an independent campaigning charity that challenges the misrepresentation of science and evidence in public life”. It has just released a new report in association with SAGE Publishing called Equipped to Decide. It looks at how, as a society, we collect large amounts of data, but do not always make the best use out of it. Solutions suggested in the report include using artificial intelligence to mine this data for relevant information.
Finally, a few weeks ago we mentioned that Stephen Hawking’s relatives were auctioning some of the cosmologist’s possessions after his death earlier this year. The sale was yesterday and big ticket items included a copy of Hawking’s PhD thesis, which went for a whopping £584,750 and a motorized wheelchair he used in the late 1980s and early 1990s, which bagged £296,750 – the same price as a collection of Hawking’s medals and awards.
On 1 November 2018, when this article was first published in the print edition of Physics World, I had been working at the UK’s National Physical Laboratory (NPL) in Teddington for exactly 20 years and six days. The reason I know this is easy – I joined on 26 October 1998 and, with the help of clocks and calendars, I can measure the time that’s passed. But what did people do before clocks came about? How did they measure time?
Over the millennia a myriad of devices has been invented for timekeeping, but what they all have in common is that they depend on natural phenomena with regular periods of oscillation. Timekeeping is simply a matter of counting these oscillations to mark the passage of time.
For much of history, the chosen periodic phenomenon was the apparent motion of the Sun and stars across the sky, caused by the Earth spinning about its own axis. One of the earliest known timekeeping methods – dating back thousands of years – involved placing a stick upright in the ground and keeping track of its moving shadow as the day progressed. This method evolved into the sundial, or shadow clock, with markers along the shadow’s path dividing the day into segments.
However, sundials are useless unless the Sun is shining. That’s why mechanical devices – such as water clocks, candle clocks and hourglasses – were developed. Then, in the 17th century, pendulum clocks were developed, which were far more accurate than any preceding timekeeping devices. Their period of oscillation (in the lowest-order approximation) was determined by the acceleration due to gravity and the length of the pendulum. Because this period is far shorter than the daily rotation of the Earth, time could be subdivided into much smaller intervals, making it possible to measure seconds, or even fractions of a second.
Nevertheless, the Earth’s rotation was still the “master clock” against which other clocks were calibrated and adjusted on a regular basis.
From crystal to atomic
As technology progressed, the need for higher-resolution timing increased. Pendulum clocks were gradually overtaken by quartz clocks, the first of which was built in 1927 by Warren Marrison and Joseph Horton at the then Bell Telephone Laboratories in the US. In these devices, an electric current causes a quartz crystal to resonate at a specific frequency that is far higher than a pendulum’s oscillations.
The frequency of such clocks is less sensitive to environmental perturbations than older timekeeping devices, making them more accurate. Even so, quartz clocks rely on a mechanical vibration whose frequency depends on the size, shape and temperature of the crystal. No two crystals are exactly alike, so they have to be calibrated against another reference – this was the Earth’s period of rotation, with the second being defined as a 1/86,400th of the mean solar day (see box, below).
Standardizing time
Solar time is not the same everywhere. In the UK, for example, Birmingham is eight minutes behind London, and Liverpool is 12 minutes behind. While communication and travel times between major centres of population were slow, this mattered little. But the situation changed dramatically with the construction of railways in the 19th century. Having different local times at each station caused confusion and increasingly, as the network expanded, accidents and near misses. A single standardized time was needed.
The Great Western Railway led the way in 1840 and “railway time” was gradually taken up by other railway companies over the subsequent few years. Timetables were standardized to Greenwich Mean Time (GMT), and by 1855 time signals were being transmitted telegraphically from Greenwich across the British railway network. However, it was not until 1880 that the role of GMT as a unified standard time for the whole country was established in legislation. Four years later, at the International Meridian Conference held in Washington DC in the US, GMT was adopted as the reference standard for time zones around the globe and the second was formally defined as a fraction (1/86,400) of the mean solar day.
There are problems with this definition of the second, however. As our ability to measure this unit of time improved, it became clear that the Earth’s period of rotation is not constant. The period is not only gradually slowing down due to tidal friction, but also varies with the season and, even worse, fluctuates in unpredictable ways.
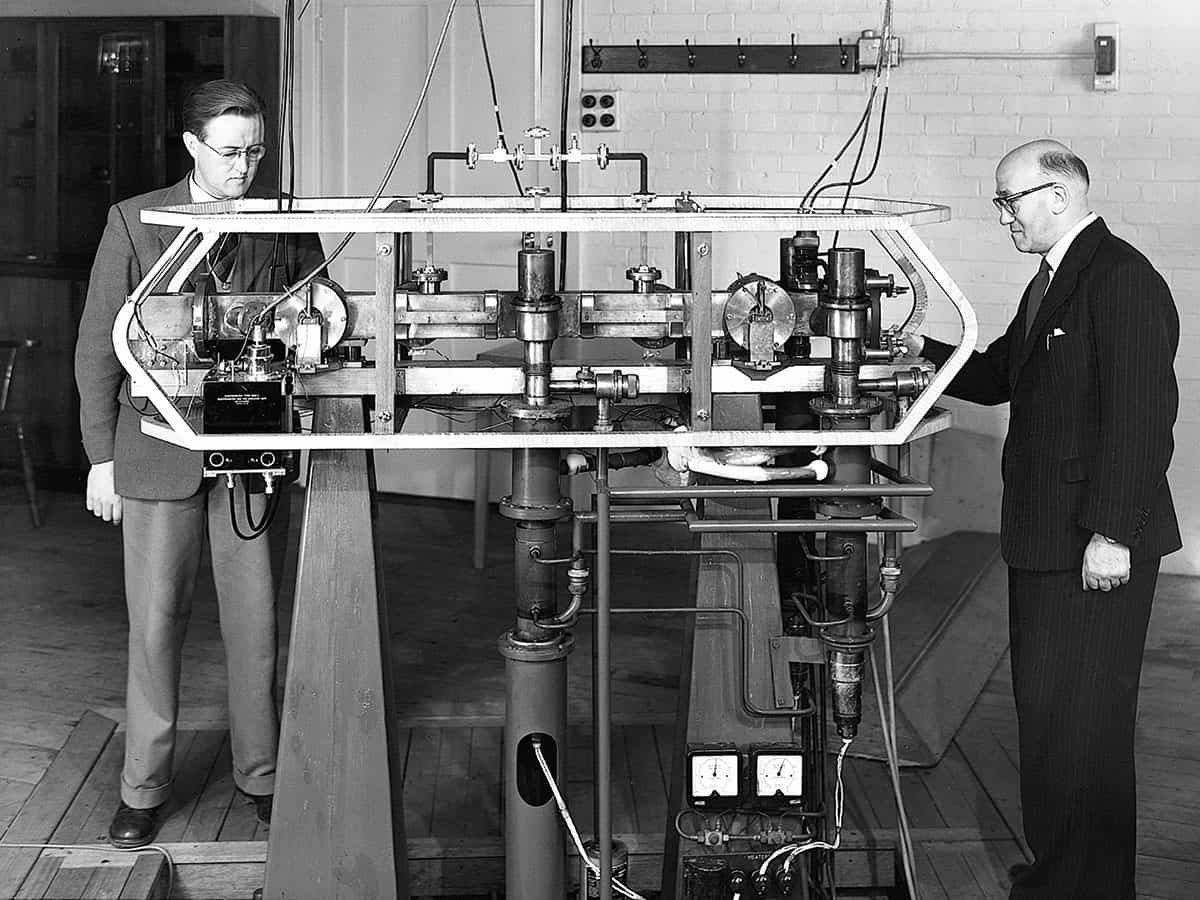
In 1955 NPL set in motion a revolution in timekeeping when Louis Essen and Jack Parry produced the first practical caesium atomic frequency standard (see box, below). Their device was not truly a clock as it did not run continuously, and was simply used to calibrate the frequency of an external quartz clock at intervals of a few days. Nevertheless, by studying how the resonance frequency depended on environmental conditions, Essen and Parry had shown convincingly that transitions between discrete energy levels in well-isolated caesium atoms could provide a much more stable time-interval reference than any standard based on the motion of astronomical bodies. As Essen later wrote: “We invited the director [of NPL] to come and witness the death of the astronomical second and the birth of atomic time.”
How an atomic clock works
In a caesium atomic clock, the frequency of a microwave source is carefully adjusted until it hits the resonance frequency corresponding to the energy difference between the two ground-state hyperfine levels of the caesium atoms: 9,192,631,770 Hz. The atoms absorb the microwave radiation, and a feedback signal generated from the absorption signal is used to keep the microwave source tuned to this highly specific frequency. The time display is generated by counting electronically the oscillations of the microwave source.
Louis Essen’s original clock at the UK’s National Physical Laboratory used a thermal beam of caesium atoms and was accurate to about one part in 1010. Nowadays, caesium primary standards use an arrangement known as an “atomic fountain”, in which laser-cooled atoms are launched upwards through a microwave cavity before falling back under gravity. Using cold atoms means the interaction time can be far longer than in a thermal beam clock, giving much higher spectral resolution. With careful evaluation of systematic frequency shifts arising from environmental perturbations, today’s best caesium fountains have reached accuracies of one part in 1016, though measurements must be averaged over several days to reach this level. They contribute as primary standards to International Atomic Time (TAI).
But showing that the new standard was stable was insufficient to redefine the second. A new definition had to be consistent with the old one within the technical limit of measurement uncertainty. Essen and Parry therefore proceeded to measure the frequency of their caesium standard relative to the astronomical timescale disseminated by the Royal Greenwich Observatory.
In the meantime, astronomers had switched to using ephemeris time, based on the orbital period of the Earth around the Sun. Their rationale was that it is more stable than the Earth’s rotation, but unfortunately for most practical measurement purposes it is impractically long. Nevertheless, the International Committee for Weights and Measures followed their lead, and in 1956 selected the ephemeris second to be the base unit of time in the International System of Units. As Essen put it: “Even scientific bodies can make ridiculous decisions.”
But ridiculous or not, he needed to relate the caesium frequency to the ephemeris second, a task he accomplished in collaboration with William Markowitz from the United States Naval Observatory. Finally, in 1967 the General Conference on Weights and Measures decided that the time had come to redefine the second as “the duration of 9,192,631,770 periods of the radiation corresponding to the transition between the two hyperfine levels of the ground state of the caesium-133 atom”.
Jack Parry and Louis Essen developed their caesium frequency standard in 1955. (Courtesy: NPL)
The next generation
More compact and less costly – albeit less accurate – versions of caesium atomic clocks have also been developed, and applications have flourished. We may not always realize it, but precision timing underpins many features of our daily lives. Mobile phones, financial transactions, the Internet, electric power and global navigation satellite systems all rely on time and frequency standards.
But although the caesium transition has proved an enduring basis for the definition of the second, caesium atomic clocks may now be reaching the limit of their accuracy and improvements may open up new applications. In response, a new generation of atomic clocks is emerging based on optical, rather than microwave, transitions. These new clocks get their improved precision from their much higher operating frequencies. All other things being equal, the stability of an atomic clock is proportional to its operating frequency and inversely proportional to the width of the electronic transition. In practice, though, the stability also depends on the signal-to-noise ratio of the atomic absorption feature.
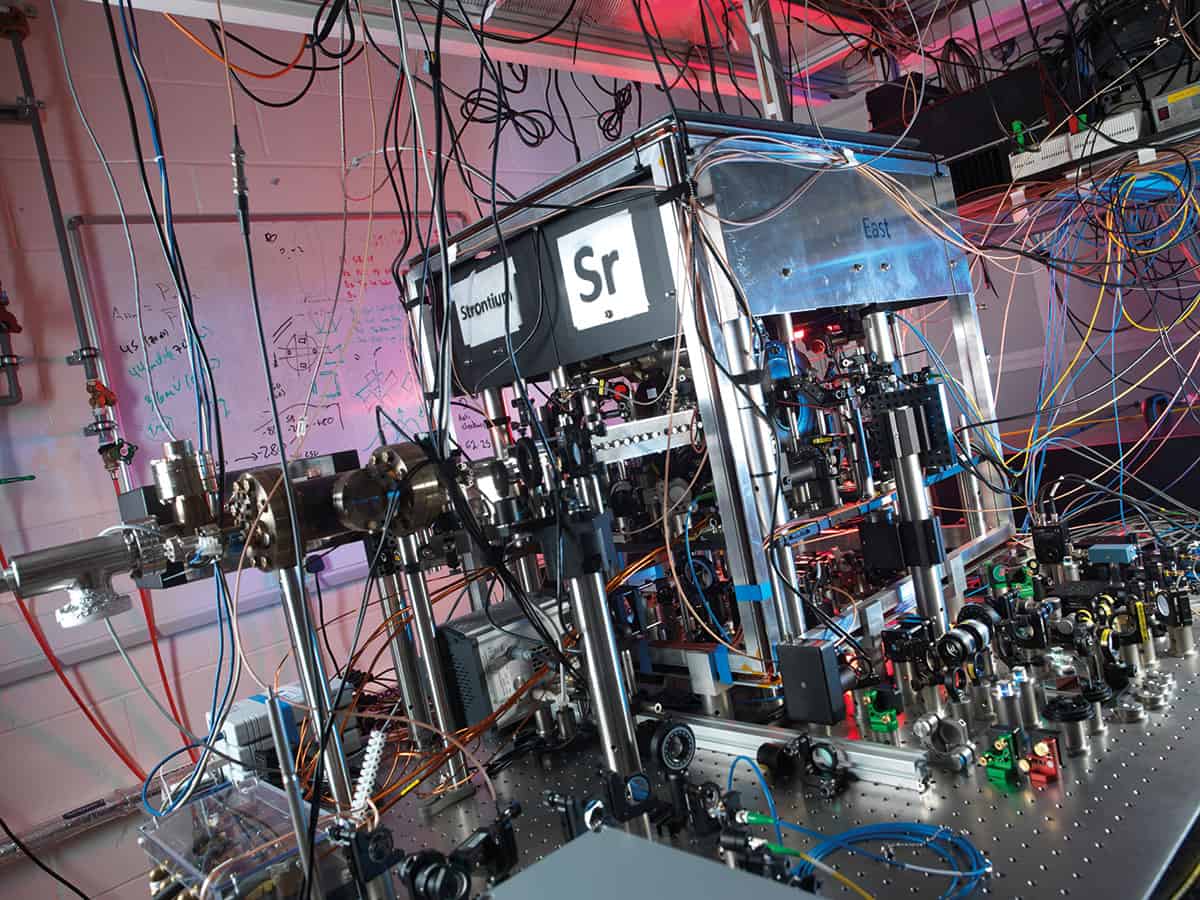
In an optical atomic clock, an ultra-stable laser is locked to a spectrally narrow electronic transition in the optical region of the spectrum – the so-called “clock transition”. The optical clocks being studied today fall into two categories: some are based on single laser-cooled trapped ions and others are based on ensembles of laser-cooled atoms trapped in an optical lattice.
The former, a single laser-cooled ion in a radiofrequency electromagnetic trap, comes close to the spectroscopic ideal of an absorbing particle at rest in a perturbation-free environment. When cooled, it can be confined to a region of space with dimensions less than the wavelength of the clock laser light, which means Doppler broadening of the absorption feature is eliminated.
By controlling its residual motion to ensure it is tightly confined to the trap centre, other systematic frequency shifts can also be greatly suppressed. This type of clock therefore has the potential for very high accuracy. The drawback is that a single ion gives an absorption signal with low signal-to-noise ratio, which limits the clock stability that can be achieved.
Neutral atoms, on the other hand, can be trapped and cooled in large numbers, resulting in a signal with far better signal-to-noise ratio. Stability, for example, improves with the square root of the number of atoms, all else being equal. Researchers can now confine thousands of laser-cooled atoms in an optical lattice trap – most commonly a 1D array of potential wells formed by intersecting laser beams.
One might expect that the light beams used to trap the atoms would alter the frequency of the clock transition. However, this can be avoided by tuning the laser used to create the lattice to a “magic” wavelength at which the upper and lower levels of the clock transition shift by precisely the same amount – a solution first proposed in 2001 by Hidetoshi Katori, from the University of Tokyo in Japan.
The current record for optical clock stability is held by Andrew Ludlow’s group from the US’s National Institute for Standards and Technology in Boulder, Colorado. Their ytterbium optical lattice clock recently demonstrated a stability of one part in 1018 for averaging times of a few thousand seconds. However, trapped-ion optical clocks have also demonstrated stabilities well below those of caesium atomic clocks, and both types have now reached estimated systematic uncertainties at the low parts in 1018 level. This far surpasses the accuracy of caesium primary standards and raises an obvious question: is it time to redefine the second once again?
Scientists today are focusing on optical clocks. (Courtesy: NPL)
The future of time
The frequency of the selected optical standard would, of course, need to be accurately determined in terms of the caesium frequency, to avoid any discontinuity in the definition. But this can easily be accomplished using a femtosecond optical frequency comb – a laser source whose spectrum is a regularly spaced comb of frequencies – to bridge the gap between the optical and the microwave frequencies. One obstacle to a redefinition is that it is unclear which optical clock will ultimately be best. Each system being studied has advantages and disadvantages – some offer higher achievable stability, while others are highly immune to environmental perturbations.
Another challenge is to verify experimentally their estimated systematic uncertainties through direct comparisons between optical clocks developed independently in different laboratories. Here researchers in Europe have an advantage as it is already possible to compare optical clocks in the UK, France and Germany with the necessary level of accuracy using optical-fibre links. Unfortunately, these techniques cannot currently be used on intercontinental scales and alternative ways to link to optical clocks in the US and Japan must be found.
Remote clock-comparison experiments must also account for the gravitational redshift of the clock frequencies. For optical clocks with uncertainties of one part in 1018, this means the gravity potential at the clock sites must be known with an accuracy corresponding to about 1 cm in height, a significant improvement on the current state of the art. Tidal variations of the gravity potential must also be considered.
Although all these challenges are likely to be overcome given time, a redefinition of the second will require international consensus and is still some way off. Until then, the global time and frequency metrology community has agreed that optical atomic clocks can in principle contribute to international timescales as secondary representations of the second.
Indeed, the unprecedented precision of optical atomic clocks is already benefiting fundamental physics. For example, improved limits have been set on current-day time variation of the fine structure constant (α ≈ 1/137) and the proton-to-electron mass ratio by comparing the frequencies of different clocks over a period of several years.
Optical clocks could also open up completely new applications. By comparing the frequency of a transportable optical clock with a fixed reference clock, we will be able to measure gravity potential differences between well separated locations with high sensitivity, as well as high temporal and spatial resolution. Such measurements will lead to more consistent definitions of heights above sea level – currently different countries measure relative to different tide gauges, and sea level is not the same everywhere on Earth. They could also allow us to monitor changing sea levels in real time, tracking seasonal and long-term trends in ice-sheet masses and overall ocean-mass changes – data that provide critical input into models used to study and forecast the effects of climate change. It is ironic perhaps that we will be able to study the Earth – whose rotation originally defined the second – in greater detail with the help of its latest usurper: the optical clock.






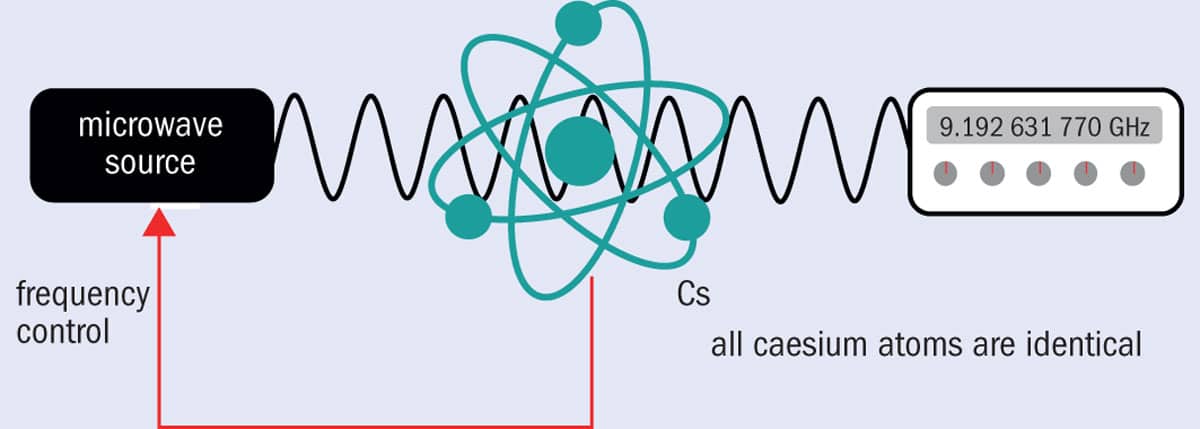 In a caesium atomic clock, the frequency of a microwave source is carefully adjusted until it hits the resonance frequency corresponding to the energy difference between the two ground-state hyperfine levels of the caesium atoms: 9,192,631,770 Hz. The atoms absorb the microwave radiation, and a feedback signal generated from the absorption signal is used to keep the microwave source tuned to this highly specific frequency. The time display is generated by counting electronically the oscillations of the microwave source.