The online revolution

Computer user

When I looked back at the second issue of Physics World, which appeared in November 1988, I was amused to spot a note in which the then editorial director of IOP Publishing expressed relief that a UK postal strike had slowed the rate of submissions to its 17 journals. The company was on track to receive almost 5500 submissions in 1988, an increase of 15% on 1987, but the threatened delays had been alleviated by “the use of telex, fax and electronic mail”. Three decades on, submissions to the 50 journals now managed editorially by IOP Publishing are on track to exceed 44,000 – an increase of (yes, you’ve guessed it) 15% on the previous year. Plus ça change

In the December 1988 issue of the magazine, the editorial director then reported that the company would formally take manuscripts in electronic form (TEX only), on floppy disc, from the following month, though only after a printed version of the paper had been accepted. The aim was to reduce production times, not to speed up peer review, but it was one of the first signs of the transition from print to digital in journals publishing. It would, however, be a few more years before publishers didn’t just accept material electronically, but also started delivering journals to libraries and their readers in that form too.

Publishing pioneer

Some publishers – I worked at one at the time – had begun to publish bibliographic and full-text databases on CD-ROM in the late 1980s. But journal publishers were a conservative bunch (some perhaps still are) and it wasn’t until the mid-1990s that digital delivery took off, encouraged by the 1996 UK Pilot Site Licence Initiative. It granted UK universities online access to electronic journal collections from four publishers, including IOP Publishing, which had been at the forefront of online developments. In 1994 we had been the first physics publisher to launch a journal on the Internet, Classical and Quantum Gravity, and all our journals became available online in January 1996.

The advent of the Web, and the ability to deliver publications online to libraries and their users, has profoundly shifted how we interact with our customers, whether authors, reviewers, editors, librarians or readers. Publishers have moved from being producers of physical artefacts – printed journals, CD-ROMs and hard-copy books – to suppliers of digital services. It’s a cultural change that is still ongoing.

I don’t have the data to tell me how quickly IOP Publishing reviewed and produced an article in 1988, but it was almost certainly far slower than today, despite the far lower volume of submissions back then. These days, IOP Publishing typically takes just 42 days from submission to “first decision” – the decision in principle to publish an article before author revisions – and not much more than 100 days for the entire process from submission to online publication.

It is the move to a largely digital publishing model over the past 30 years that has enabled publishers to speed up the publication process while coping with the enormous growth in submissions and published articles, supported by substantial investments in editorial staff, publishing processes and IT. While all publishers have improved their publication speeds, I believe IOP Publishing is ahead of most, taking into account the quality of our peer review too.

The move to a largely digital publishing model over the past 30 years has enabled publishers to speed up the publication process while coping with the enormous growth in submissions and published articles.

Steven Hall

That transition from print to digital has in turn stimulated two significant changes to the business models for journals publishing. The first has been the move by publishers and their library customers from the sale and purchase of subscriptions to individual journals to the licensing of a publisher’s entire journal portfolio – the so-called “big deal”. This big deal has grown bigger still through the formation of regional, national and even international library consortia to negotiate joint licences with publishers.

Some librarians and administrators accuse publishers of imposing this new model on libraries. But that ignores the fact that it was the Higher Education Funding Council for England – through its Joint Information Systems Committee (now just Jisc) – that introduced the idea of a UK Pilot Site Licence; and that libraries have largely embraced the model, trading some flexibility for the greatest possible access to the research literature.

The second big change has been open-access publishing, which would have been inconceivable before digital publishing. IOP Publishing has been at the forefront of this endeavour too, having launched its first open-access journal – New Journal of Physics – in partnership with the German Physical Society in 1998. Open-access publication is now an integral (if not yet dominant) part of scholarly publishing, allowing the final version of an article to be made freely accessible immediately on publication under a licence that allows almost unlimited reuse.

A report published at the end of 2017 by Universities UK – Monitoring the Transition to Open Access – estimated that 19% of all journal articles were published on an open-access basis in 2016, with the figure for articles by UK authors at 30%. Some national consortia, for example in Germany and the Netherlands, are now seeking to combine the big deal with open access, by flipping the business model from one under which they pay for access to the journals to one under which they pay for all articles by their researchers to be published on an open-access basis, with access to all other articles at no or minimal additional cost.

Into the future

I doubt if those conservative journal publishers of the late 1980s could have foreseen such a development, which is why I’m going to forbear any crystal-ball gazing on the state of scientific publishing in 2048. All I can predict is that it’s likely to change as much or more in the next 30 years as in the past 30, and all I can hope is that learned-society publishers, like IOP Publishing, can continue to adapt, and thereby support their parent organizations, as they do today.
The windy city: not just Chicago

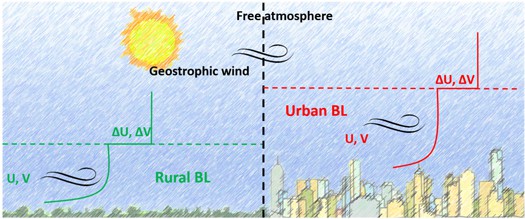
It’s well known that cities tend to be warmer than surrounding rural areas, as a result of the urban heat island effect. Now research indicates they may also be windier. This “urban wind island” phenomenon sees warmer urban air and the extra roughness created by buildings add energy to the lowest layer of the atmosphere and increase wind speed.

These slightly faster urban winds may be beneficial to city residents. “They could provide a refreshing breeze on hot days and it might promote ventilation of air pollution,” says Arjan Droste from Wageningen University in the Netherlands. The extra zip in the wind might also make small-scale wind turbines more viable in urban areas.

Illustration of urban wind island effect

Until now most studies concentrated on localised urban wind effects such as the blasts created by street canyons, or the turbulence close to buildings. But cities cover large areas so to better understand how they affect wider wind patterns, Droste and colleagues modelled the atmospheric boundary layer over urban and rural sites under ten different conditions. The boundary layer is the lowest portion of the atmosphere that is influenced by the Earth’s surface; it’s generally around 1 km deep.

“Enhanced turbulence in the urban area deepens the atmospheric boundary layer, and effectively mixes momentum into the boundary layer from aloft,” the scientists write in their paper in Environmental Research Letters (ERL).

Curiously, the model showed that the urban wind island effect was greatest in areas of low-rise buildings that were up to 12 m high. “Buildings create friction which slows down the wind, so lower buildings are more favourable for the formation of the urban wind island effect,” explains Droste.

Droste and colleagues verified their model using measurements from central London in the UK, the Swiss city of Basel, and Cabauw, a rural area in the Dutch province of Utrecht. Then they used the model to investigate how the urban wind island effect responded to changes in surface roughness.

The team found that over urban areas the boundary layer is usually deeper, and the mean wind speed higher than in surrounding rural areas. The effect is strongest at the beginning of the afternoon, increasing wind speed by an average of 0.5 m/s.

It’s still early days for understanding the urban wind island effect, and there is much work to do. Droste and colleagues are interested in exploring how local meteorology influences urban wind, and how much location matters, for example tropical regions versus temperate, or mountainous areas versus the coast.

Engineering transplantable fat tissue

Researchers at Boston University are the first to have succeeded in engineering vascularized fat tissue that grows or shrinks when given the appropriate physiological signal. The new work is an important step towards making large, centimetre-sized samples of adipose tissue for regenerative medicine applications.

“We are particularly excited about our technique because it will allow us to make whole tissue rather than just its vascular components,” says Joe Tien, who led this research effort.

Repairing soft tissue damage

Soft tissue damaged, for example, by injury or when a tumour is removed, often needs to be reconstructed. The main way to do this today is to transfer fatty tissue from another part of the body to the damaged site, but this technique is far from ideal. Being able to engineer stable and functional adipose tissue that can then be grafted directly onto the area of interest would be better, explains Tien.

This tissue needs to be perfused with certain nutrients and hormones immediately after being grafted, however, if it is to survive and maintain its volume, he adds. Most research in this field has so far focused on engineering vascularized fatty tissue and then providing it with a combination of angiogenic and adipogenic growth factors, suspended endothelial cells and adipocytes, and/or adipocyte progenitors, together with an appropriate scaffold. This process usually takes several weeks and can produce a poorly organized microvascular network containing small-diameter microvessels that are difficult to access for further perfusion.

Continued perfusion now possible

Tien’s team has now managed to engineer small-sized samples of adipose tissue that contain perfusable microvessels. The researchers achieved their feat by building on previous work to vascularize microfluidic collagen scaffolds.

“The idea is very simple: we use a thin needle to create a channel (which serves as a template for cell growth) in the scaffold and then vascularize the scaffold through the channel,” Tien tells Physics World. “The important feature is that we can constantly perfuse the scaffold with nutrients and lipoactive hormones such as insulin and epinephrine. In the current work, the scaffold contains suspensions of (3T3-L1) adipocytes in type I collagen.

“When we flow vascular cells into the channel, these cells spontaneously rearrange themselves into a thin vessel. Once the vessel forms, the vascular cells stop growing.

“The lipoactive hormones we then perfuse into the construct primarily affect the adipocytes. When we perfuse the fat cells with insulin and epinephrine, they diffuse across the vessel wall and are taken up by the adipocytes, just as they would in vivo.”

Insulin causes fat cell accumulation and epinephrine fat cell loss, he says, so making the construct grow or shrink, respectively.

“Fat-on-a-chip”

“Our design could serve as a building block for making larger-sized tissues that might then be transplanted to repair a damaged soft tissue site,” he explains. “The tissue could also be used as a ‘fat-on-a-chip’ microphysiological system to model vessel-adipocyte interactions. It might thus even be used to model complex adipose-rich tissues, such as those in breast tumours.”

To scale up the constructs into clinically implantable ‘flaps’, Tien says that they need to be modified to contain only human cells, such as primary human adipocytes or adipose-derived stem cells. “They will also require a branching vascular network that can support large tissues, and perfusion at the pressures experienced by arteries.”

The research is detailed in Biofabrication 10.1088/1758-5090/aae5fe.

Rocket carries Bose–Einstein condensate into space

A Bose–Einstein condensate (BEC) has been created in space by a global team led physicists in Germany. During its 6 min of freefall, over 100 experiments were performed on the BEC. This marks a significant advance on previous microgravity experiments involving BECs, in which single experiments were performed during a few seconds of free fall down a drop tower. More significantly, it constitutes a significant step towards placing a BEC in zero gravity on the International Space Station, which could open the door to vital experiments in multiple areas of physics.

BECs are ensembles of atoms with integer quantum spins. This means the atoms are not bound by the Pauli exclusion principle and, when chilled to near absolute zero temperatures, they can all occupy the ground state of a system simultaneously. They therefore behave as a single, macroscopic quantum object. The first BEC was created in 1995 and have since proved useful for experiments in various areas of physics, ranging from quantum optics to cosmology.

Like any quantum state, a BEC is highly fragile, which makes it extremely useful as a sensor of external forces such as gravity and magnetic fields. However, this fragility also means that a BEC can easily be destroyed by contact with its surroundings. Therefore researchers take great care to shield BECs from heat and electromagnetic fields. One cannot shield an experiment from gravity, however: “We often want to use atom interferometers to measure inertial forces such as rotation and acceleration,” says Dennis Becker of Leibniz University Hannover, “You get a large bias if you have gravity.”

Three drops per day

As Einstein’s famous equivalence principle dictates, an experiment conducted in freefall is locally indistinguishable from one conducted in zero gravity. On this basis, in 2007 Ernst Rasel and colleagues from Leibniz University of Hanover and elsewhere prepared and observed a BEC inside a capsule while it was falling down the 146 m ZARM drop tower in Bremen. The researchers noted that the condensate was significantly more stable than in a laboratory fixed to the Earth. However, they could perform at most three drops per day, and in each drop the condensate spent less than 5 s in free fall. As a result there has been an ongoing drive to produce BECs in orbit around the Earth and in May 2018 NASA launched its Cold Atom Laboratory to the International Space Station.

In this latest work, Becker, Rasel and colleagues have taken a different route into space by loading an “atom chip” onto a rocket.  The atom chip comprised a micron-scale magneto-optical trap containing rubidium-87 atoms. The chip was held within a 3 m capsule containing electronics, lasers and a power source. This was mounted onto a MAIUS-1 rocket, which was fired 243 km upwards from a launch site in Sweden in January 2017. When the rocket reached its zenith, the researchers immediately cooled the atoms by forced evaporative cooling – successfully creating a BEC of around 10atoms in just 1.6 s.

In the subsequent 6 min of free fall, the researchers managed to conduct 110 experiments on the condensate. Becker explains that this was due to careful forward planning and artificial intelligence. The team pre-programmed sequences of experiments in which one parameter changed from experiment to experiment. “The experimental apparatus would do some of the experiments but also evaluate them to some degree so it could take the best value for the next experiment,” says Becker.

The main goal was to get the technology ready for a future mission where there might be surprising science

Dennis Becker

The researchers found that their results compare well with similar experiments done here on Earth. “In the sense of ‘Is there new physics that was not predicted by theory?’ I would say no,” says Becker “But the main goal of this mission was to get the technology ready for a future mission where there might be surprising science.” On future launches, for example, the researchers want to produce combined condensates, which could be used to test the equivalence principle.

“The spectacular thing is that you can do [the experiments] in a rocket,” says cold atom expert Jakob Reichel of Ecole Nationale Superiéure in Paris. He adds that the demonstration was so convincing that the technology could be handed over to engineers for further development.

The research is described in Nature.

Deep-learning algorithm identifies dense tissue in mammograms

Breast density classification

Dense breast tissue can mask cancers on mammograms, making screening more difficult, and is also an independent risk factor for breast cancer. Now, researchers from Massachusetts Institute of Technology (MIT) and Massachusetts General Hospital (MGH) have developed a deep-learning algorithm that assesses breast density in mammograms as reliably as an experienced mammographer (Radiology 10.1148/radiol.2018180694).

In the USA, many states have laws mandating that women are notified if their mammograms indicate dense breast tissue. But breast density assessments rely on human assessment and results can vary among radiologists. “We’re dependent on human qualitative assessment of breast density, and that approach has significant flaws,” explains lead author Constance Lehman from MGH. “We need a more accurate tool.”

“Our motivation was to create an accurate and consistent tool that can be shared and used across health care systems,” adds Adam Yala, a PhD student in MIT’s Computer Science and Artificial Intelligence Laboratory.

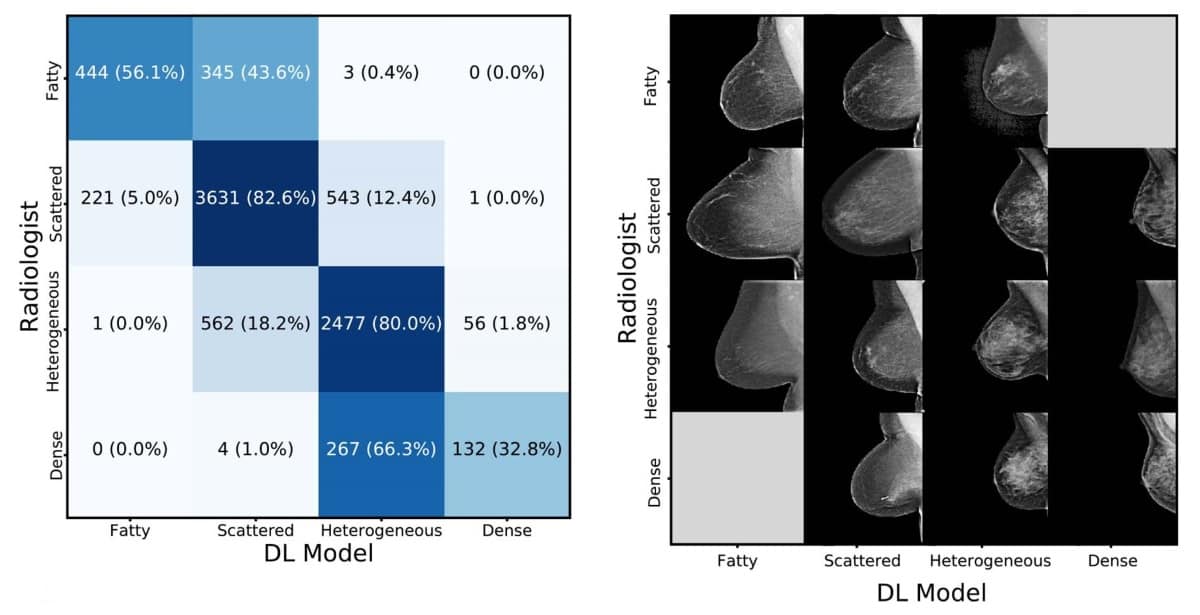
Every mammogram has a BI-RADS breast density rating in one of four categories: fatty; scattered fibroglandular; heterogeneously dense; or dense. The researchers developed a model, is built on a deep convolutional neural network, that can distinguish the different categories of breast tissue.

The researchers trained and tested the algorithm on a dataset of more than 58,000 digital screening mammograms. They used around 41,000 mammograms for training and about 8600 for testing. During training, the algorithm is given random mammograms to analyse and learns to map the mammogram with the original radiologist’s interpretation. Given a new mammogram, it can then predict the most likely density category.

Clinical application

In January of this year, the deep-learning algorithm was implemented in routine clinical practice at MGH. In a traditional workflow, mammograms are sent to a workstation for a radiologist to assess. For this study, the algorithm was applied first to assign each mammogram a density rating. Then when radiologists view a scan at their workstations, they see the model’s assigned rating, which they can then accept or reject.

The researchers note that this marks the first time that this type of deep-learning model has successfully been used in routine clinical practice. “It takes less than a second per image … [and it can be] easily and cheaply scaled throughout hospitals,” says Yala.

Four-way breast density classification

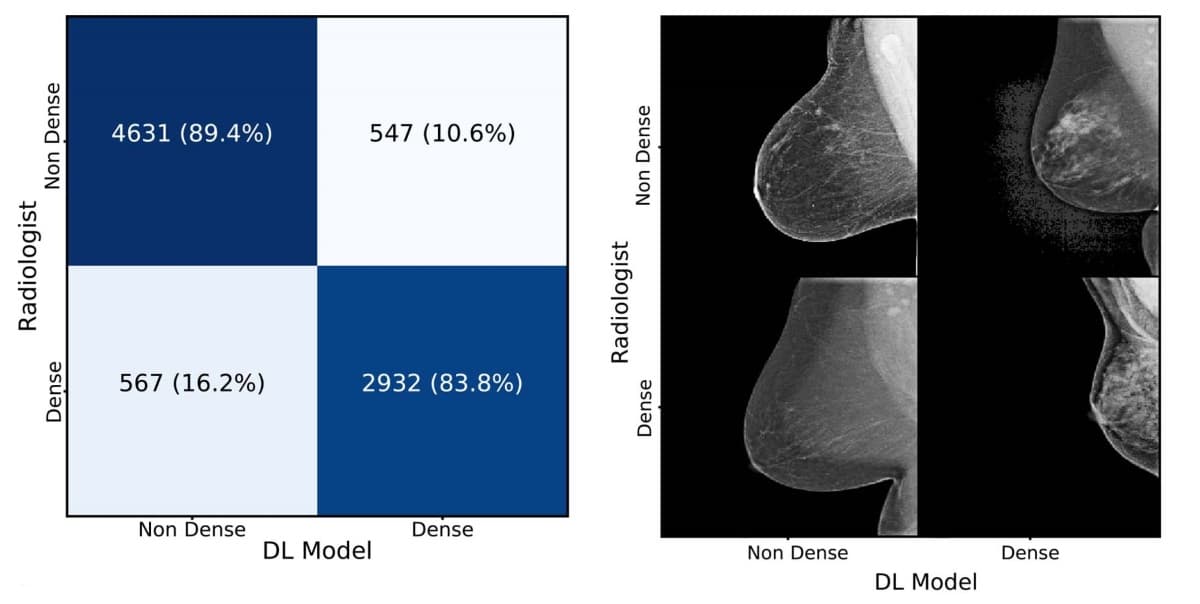
The study reports on 10,763 consecutive mammograms assessed by the algorithm and reviewed by eight radiologists. In a binary test determining whether breasts were heterogeneous and dense, or fatty and scattered, the algorithm achieved 94% agreement with the radiologists. Across all four BI-RADS categories, it matched radiologists’ assessments at 90%.

“We were thrilled with the results,” says Lehman. “Now at Mass General, the deep-learning algorithm processes all our screening mammograms and provides density, which is either accepted or rejected by the radiologists.”

The algorithm has the potential to standardize and automate routine breast density assessment. On a broader scale, the researchers see artificial intelligence (AI) as central to the development of personalized breast cancer risk assessment. AI is uniquely suited to breast imaging because it can draw upon a large, mature database with advanced, structured reporting that links images with outcomes.

“With AI, we now have the ability to leverage vast amounts of information into more personalized, more targeted care for our patients,” says Lehman. “In the case of breast cancer, we can better predict how likely a woman will have cancer in her future and improve the chances that it will be treated successfully.”

Wearable patch measures central blood pressure

Ultrasound sensor patch

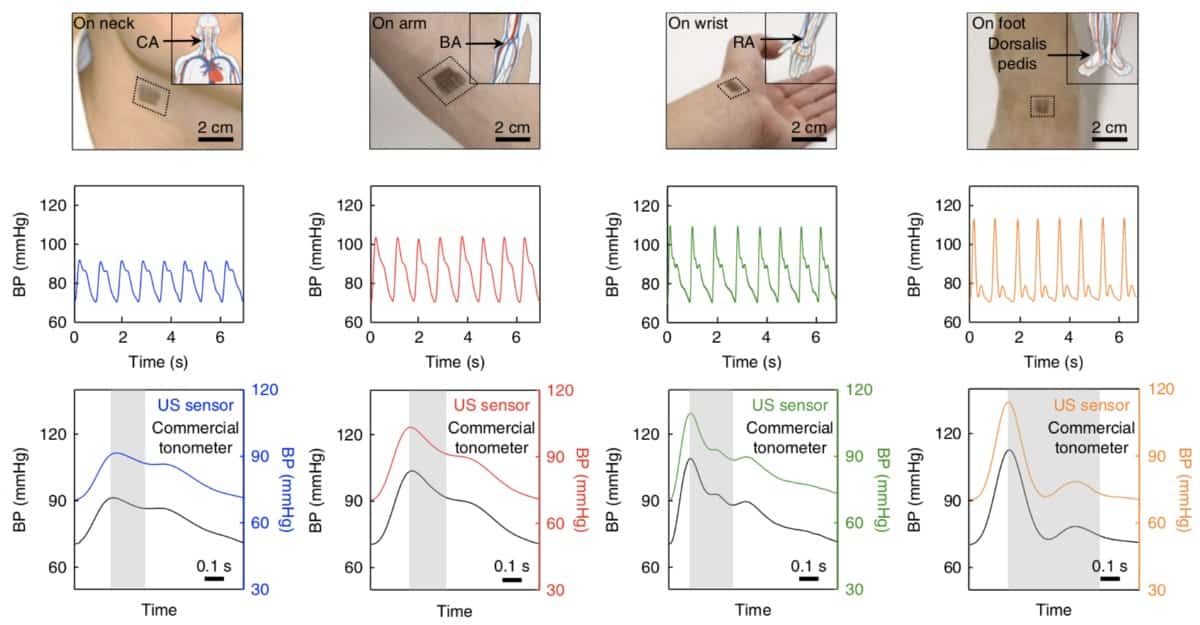
A wearable patch, designed by Sheng Xu’s research group at the University of California San Diego, can flex and conform to the skin’s surface while assessing blood pressure (BP) through ultrasonic waves. It performs as well as other non-invasive methods used to measure BP without presenting their associated caveats (Nature Biomed. Eng. 2 687).

By measuring the pulsatile behaviour of the artery diameter, the patch can derive pressure in real time and yield important predictors of related cardiovascular events. For example, when combined with an electrocardiogram sensor, the patch can assess the speed at which the blood pulse wave travels along the arterial tree. This is an important feature of hypertension, as stiffer arteries lead to high velocities.

The patch is only 240 µm thick and is composed of a 4×5 array of tiny rigid piezoelectric transducer elements that emit a 7.5 MHz ultrasonic wave, combined with soft structural components such as meandering stretchable electrodes. The whole assembly is encapsulated within a silicone elastomer so that its elastic modulus matches that of the skin.

The best of both worlds

BP is routinely measured around the world to inform doctors’ clinical decisions. But the BP cuffs that they use only give landmark values, such as maximal (systolic) and minimum (diastolic) BP, not the whole BP waveform, which contains more comprehensive information for diagnosis and prognosis.

The gold standard for assessing the entire BP waveform is invasive, as it requires insertion of a catheter into the site of interest. Thus non-invasive alternatives were developed — but their shortcomings limit their use to research purposes.

Photoplethysmography, for example, links BP to light absorption, but it can only be used on a shallow vessel, such as in the finger. Tonometry, meanwhile, in which a sensor records the vessel pulsation and wall motion tracking of the artery with ultrasound, can only be performed by a skilled operator. Tonometry also requires a supporting bone beneath the artery flattened by the sensor; and wall motion tracking is vulnerable to motion artefacts from respiration and shaking by both patients and operators.

Wearable devices offer autonomous, non-invasive, continuous monitoring of many signals (temperature, sweat content, skin hydration, etc). The incorporation of ultrasonic probes allows investigation of deeper phenomenon that are currently inaccessible by existing wearable devices.

The importance of central BP

This work also brings into sharp focus the prevalence of central BP, the pressure near the heart, over peripheral BP assessed from distal locations (brachial or radial arteries in the arm). Historically, the first BP measuring devices assessed the latter; but recent findings led to a paradigm shift. The rationale for this was that central BP is more representative of the force that major organs such as kidneys or the brain are exposed to. Studies revealed that peripheral BP could be up to 20 mmHg higher than central BP, due to amplification phenomena caused by pulse wave propagation and reflection.

Mathematical techniques exist to transform peripheral into central BP, but BP-lowering drugs can have different effects at these two locations, leading to inaccurate estimates. More importantly, these mathematical tools are not patient-specific, but result from observations in selected cohorts of patients that were then generalized.

By allowing real-time monitoring of patient-specific information regarding central BP, without requiring external assistance, the new patch can usher BP monitoring in a new era in which the whole BP waveform is used to assess a patient’s health, instead of just diastolic and systolic BP.

The next steps for the technology involve integrating a wireless compound to transfer data from the patch to a monitor and process the data to deliver the relevant information to the doctor. The researchers are currently looking for collaborators to carry out these improvements.

IPCC’s climate report: the future’s not looking good

The Intergovernmental Panel on Climate Change (IPCC) SR15 special report looks at how to keep global temperature rise to 1.5 °C. Even if that was possible, impacts would be severe, but they’d be much worse at 2 °C.

The IPCC report puts it positively, highlighting a number of climate change impacts that could be avoided by limiting global warming to 1.5 °C compared to 2 °C, or more. For instance, by 2100 global sea level rise would be 10 cm lower with global warming of 1.5 °C compared with 2 °C. The likelihood of an Arctic Ocean free of sea ice in summer would be once per century with global warming of 1.5 °C, compared with at least once per decade with 2 °C. Coral reefs would decline by 70-90% with global warming of 1.5 °C, whereas virtually all (> 99%) would be lost with 2 °C. Even so, it’s all a little sobering, as was Carbon Brief’s attempt to summarize likely impacts.

Can these impacts be avoided? The UN’s Paris Agreement aimed to help us stay “well below” 2 °C, but the chance of the world doing that is now “almost zero”, PWC consultancy has said, given that the gap between the current decarbonization rate and that needed to stay under 2 °C was widening. Among the G20 countries, China led with a decarbonization rate of 5.2%, with Mexico, Argentina, the UK and Brazil behind it. But, PWC said, “not one of the G20 countries achieved the 6.4% rate required to limit warming to 2 °C this year”.

Balancing act

So what happens next? SR15 presents some grim realities. It still insists that it can be done, but “limiting global warming to 1.5 °C would require ‘rapid and far-reaching’ transitions in land, energy, industry, buildings, transport, and cities. Global net human-caused emissions of carbon dioxide (CO2) would need to fall by about 45% from 2010 levels by 2030, reaching ‘net zero’ around 2050. This means that any remaining emissions would need to be balanced by removing CO2 from the air.”

So SR15 backs negative carbon/carbon dioxide removal (CDR) as a last ditch corrective: “Allowing the global temperature to temporarily exceed or ‘overshoot’ 1.5 °C would mean a greater reliance on techniques that remove CO2 from the air to return global temperature to below 1.5 °C by 2100. The effectiveness of such techniques are unproven at large scale and some may carry significant risks for sustainable development.”

Nevertheless, the IPCC says “in pathways limiting global warming to 1.5 °C with limited or no overshoot, BECCS deployment is projected to range from 0–1, 0–8, and 0–16 GtCO2/yr in 2030, 2050, and 2100, respectively, while agriculture, forestry and land-use (AFOLU)-related CDR measures are projected to remove 0–5, 1–11, and 1–5 GtCO2/yr in these years,” but it adds “some pathways avoid BECCS deployment completely through demand-side measures and greater reliance on AFOLU-related CDR measures”.  In some scenarios there is also some fossil fossil CCS, maybe as a sop to coal-intense countries and the fossil fuel lobby.

Renewed energy

However, the main way ahead is evidently seen as via renewables. In the IPCC’s best scenario, with low energy demand and low or no carbon overshoot, renewables supply 60% of global electricity by 2030, moving up to 81% by 2050. Though in that scenario the IPCC sees nuclear power expanding by 59% (from its 2010 level) by 2020 and by 150% by 2050. Or much more in some higher demand scenarios. Are either of these expansions possible? Nuclear is at 10.5% at present globally, and mostly stalled. SR15 notes that, while in some scenarios nuclear expands, in others (and in some countries) it declines, or no longer plays a role. By contrast, renewables are at 26.5% and booming in most places, with costs falling. They seem a better bet — IPCC says, with “high confidence”, that they should be able to supply between 70–85% of global electricity in 2050.

While that is good news, some issues emerged in the run-up to the IPCC report that may need to be considered. For example, though hydro is expanding, not everyone backs large hydro, given its large local environmental and social impacts, and it is also becoming clear that climate change is having a significant impact on water supply for hydro projects.

Blowing in the wind

There are also some disputes about wind power impacts. A new Harvard study says the mass deployment of wind turbines would alter local thermal balances: “warming arises, in part, from turbines redistributing heat by mixing the boundary layer”. The researchers add that “the warming effect is small compared with projections of 21st century warming, approximately equivalent to the reduced warming achieved by decarbonizing global electricity generation, and large compared with the reduced warming achieved by decarbonizing US electricity with wind”. They estimate that “generating today’s US electricity demand (0.5 TWe) with wind power would warm continental US surface temperatures by 0.24 °C”. So “for the same generation rate, the climatic impacts from solar photovoltaic systems are about ten times smaller than wind systems. Wind’s overall environmental impacts are surely less than fossil energy. Yet, as the energy system is decarbonized, decisions between wind and solar should be informed by estimates of their climate impacts”. Sounds like an anti-wind/pro-solar line, but that perspective conflicts with the result from Stanford University work suggesting that, by reducing water vapour in the air, wind turbines would cut warming. And a Forbes correspondent also came to the defence of wind  — there were no net temperature changes, just a transfer of heat.

Even so, with issues like that around, it’s understandable that some see carbon negative options as important. However, as I have noted in earlier posts, some say BECCS, Biomass with CCS, will undermine carbon sinks and biodiversity and some think that protecting forests would be a better bet. Indeed, the IPCC warns that “most current and potential CDR measures could have significant impacts on land, energy, water, or nutrients if deployed at large scale”.  It’s not easy being green.

Certainly the task ahead is daunting. The IPCC says: “Climate change impacts and responses are closely linked to sustainable development which balances social well-being, economic prosperity and environmental protection. The United Nations Sustainable Development Goals (SDGs), adopted in 2015, provide an established framework for assessing the links between global warming of 1.5 °C or 2 °C and development goals that include poverty eradication, reducing inequalities, and climate action”. And it claims that “the avoided climate change impacts on sustainable development, eradication of poverty and reducing inequalities would be greater if global warming were limited to 1.5 °C rather than 2 °C, if mitigation and adaptation synergies are maximized while trade-offs are minimized”. That seems obvious enough, but can it be done? Not least given the fact that not everyone is convinced that the IPCC report says much that is new and some remain convinced that the whole thing is a scam.

Do you philosophize?

When did philosophy first feature in Physics World? To answer that question, we need to go back to the June 1988 issue of Physics Bulletin, which preceded Physics World, with an article written by US plasma physicist Robert Jahn, who until two years previously had been at Princeton University. The feature described apparently positive results, found by both Jahn and others, based on experiments into “psychic” phenomena. Jahn claimed the work had implications for science, scientific method and humanity’s understanding of itself and its relation to the cosmos.

But the September 1988 issue of Physics Bulletin, the final of that publication, contained several letters denouncing Jahn’s work as unscientific. One respondent said it conflicted with “most of the physics confirmed daily in our laboratories” as well as with “elementary reasoning.” Another challenged Jahn’s claim that the results had been experimentally demonstrated, adding the evidence was not real and invoking Carl Sagan’s dictum that “extraordinary claims require extraordinary evidence”. That author said that the magazine’s “transition upmarket to Physics World” was not well served by Jahn’s article.

Turning to the launch issue of Physics World in October 1988, the first entry in its letters pages was a reply by Jahn. He attacked the “prejudicial rhetoric” of his critics and also defended the “extensive experimental data” and “hard analytical results” of his research. Jahn challenged sceptics to consult the technical literature, to visit psychic research laboratories to see for themselves, and to “conduct a few careful experiments of their own”.

The controversy did not end there. In the November 1988 issue, one of Jahn’s critics referenced painstaking experiments, the conclusions of which not only rebutted Jahn’s claims, but had also been repeatedly confirmed by laboratories worldwide for decades. That letter was followed by another reply from Jahn, who cited the “specific empirical facts” arising from his own careful “experimental protocols and results”.

The key is this: none involved in the debate called this argument philosophical, yet it was philosophical at its very core. The sign? Each antagonist thought that they were engaged in real research and that the other side was being unscientific. The dispute therefore turned, not on research findings, but on some differing understandings of what it means to conduct scientific inquiry. Finding a resolution would require enough critical reflection on how scientific inquiry should be carried out to achieve consensus. Such reflection is philosophy, whether done formally or informally.

Erecting a wall

Philosophers of science call this sort of issue the demarcation problem. It’s about how to distinguish between scientific activity and non-scientific activity that may look like scientific activity. Unfortunately it’s harder to solve than it looks. Not everything done in a lab, nor by accredited professors at prominent institutions, nor with expensive equipment is truly scientific. Attempts to demarcate the border between scientific and unscientific activity can put cases on the wrong side or leave the border permeable.

Physics World’s birth took place during an exciting time for demarcation, with several announcements on opposite sides of the wall. The discovery of high-temperature superconductors two years before the magazine’s launch turned out to be on the scientific side, despite Georg Bednorz’s doubts at the time that his results were real. He expressed these in an interview in the magazine’s first issue. The claimed discovery of cold fusion, which was announced in March 1989, turned out to be on the other side of the demarcation wall.

The demarcation problem was not the only philosophical issue broached in Physics World’s first year, though the word philosophy didn’t appear at all in the magazine’s first volume. The term first showed up in the second volume, and then only backhandedly, in a letter correcting a misuse of the term “natural philosophy”. But the magazine did cover what I would argue are philosophical matters, given that resolving any of them requires us to critically rethink our assumptions of what it means to do serious scientific research.

One such matter was touched on in an editorial in December 1988, on the limits of the ability of physics to shed light on consciousness, mentioning an article that Brian Pippard from the University of Cambridge had recently published elsewhere about the topic. Another perennial philosophical issue, linked to quantum mechanics, was raised by Alasdair Rae from the University of Birmingham in an April 1989 article on a locality-disproving experiment. “The principle of locality is so fundamental to some,” Rae wrote, “that I expect they will look on this as only a temporary set back and start anew on a search for a theory that preserves this concept and agrees with the results of all experiments performed so far.”

The critical point

Looking back at Jahn 30 years on, history has proved not to be on his side. The consensus against scientific research into psychic matters grew. His name did not appear any further in the pages of Physics World, apart from a book review critical of psychic research a few years later.

But the issue of how to distinguish genuine research from bogus or imperfect science is still with us, though in different forms. I don’t mean the difference between genuine discoveries and those that are later rescinded, such as the detection of the Higgs boson (2012) and of gravitational waves (2016) on the one hand, and of faster-than-light neutrinos (2011) and of gravitational waves from the early universe (2014) on the other.

Today’s version of the demarcation problem has more to do with legitimizing the authority of science – the status of evidence for things like the existence of global warming, alleged dangers of genetically modified foods or the cancerous potential of mobile phones. Jahn, who died in November 2017, was right about one thing though. Understanding demarcation is essential to science, scientific method, and humanity’s understanding of itself and its relation to the cosmos.

Gravitational waves reveal radii of colliding neutron stars

The gravitational waves and electromagnetic radiation detected on 17 August 2017 were produced by the merger of two neutron stars each with a radius of about 11.9 km. That is one conclusion of a new study by astrophysicists working on the LIGO and Virgo gravitational-wave detectors.

Dubbed GW170817, the 2017 event was the first-ever observation of gravitational waves from two neutron stars as they spiralled into each other and then merged to form a black hole. The observation is also notable as the first time that electromagnetic radiation was detected from a gravitational-wave event.

Since the observation, astrophysicists have analysed the detected gravitational waves to gain a better understanding of the properties of the two neutron stars involved in the merger. In May 2018, LIGO-Virgo researchers reported that the merger appeared to have involved neutron stars of different masses. The heavier star is estimated to have been about 1.36-1.60 solar masses, while the lighter star is estimated to have been about 1.16-1.36 solar masses.

Since then, astrophysicists have also tried to calculate the radii of the neutron stars, with a paper published in August 2018 by Soumi De and colleagues estimating that the radii were both about 10.8 km. The calculations were done by considering how the neutron stars could be deformed by each other’s gravitational pull.

Equation of state

Now, LIGO-Virgo researchers have published their own calculations of the neutron-star radii. They also calculated an equation of state (EOS) for the neutron stars – which defines the relationship between the pressure and density of a neutron star.

The merger of two neutron stars provides important information about the EOS because the shapes of the neutron stars are distorted by each other’s gravity as they draw nearer. How a neutron star undergoes such a tidal distortion depends on the radius of the neutron star and how easy or hard it is to stretch or compress – the latter being defined by the EOS. This distortion affects both the amplitude and frequency of gravitational-wave emission, and therefore can be deduced from LIGO-Virgo observations.

The latest analysis of GW170817 is based on three important assumptions: that both of the merging objects were neutron stars; that both neutron stars are described by the same equation of state; and that both neutron stars were spinning at rates consistent with other observed binary neutron stars.

The team first calculated the radii of the two neutron stars using a technique that depends only weakly on the EOS. This yielded a radius of 10.8 km for one neutron star and 10.7 km for the other star. In both cases the uncertainty is less than about 20%.

Choice of EOS

In the second analysis, they used an EOS developed by Lee Lindblom and Nathaniel Indik of Caltech in the US. The choice of EOS was guided in part by the 2010 observation of a neutron star with a mass of 1.97 solar masses – the most massive neutron star observed to date. As a result, the EOS chosen by the team must be able to describe neutron stars of this mass and larger. In this case the radii of both the neutron stars was calculated to be about 11.9 km with uncertainties less than 12%.

The analysis is described in Physical Review Letters


Snap, crackle and dam: puffed rice gives insights into rockfill and ice shelf collapse

A popular breakfast choice has provided insight into the collapse of rockfill dams, sinkholes and ice shelves. A team from the University of Sydney, Australia, added milk to puffed rice in a tube under pressure to simulate the crumbling of brittle porous materials in contact with fluids.

Once the puffed rice in the milk at the bottom of the tube was fully soaked and turned to mush, the grains above sank downwards in a series of jerks that the team dubbed ricequakes. A clicking noise accompanied each quake and the time between them increased roughly linearly over time. Researchers Itai Einav and François Guillard described the sounds as like the clicking beats of a slowing metronome.

Each jerk occurs when a micropore within the puffed rice collapses because partial saturation with milk has reduced its crushing strength, Einav and Guillard believe. This leads to a sudden, brief drop in stress. Even though they may not be visibly wet from the outside, puffed rice grains immediately above the level of the milk are likely to contain liquid due to capillary action through their micropores.

Between each jerk, the puffed rice deformed by creep. Puffed rice is very porous, brittle and soft so it’s handy for demos in the lab – it’s easy to compact within a small space and short timescale.

According to the team’s “crushing wave model” of puffed rice failure, the time between consecutive quakes scales with the square of the micropore size. In geological materials such as soft coastal carbonates or ice sheets, the micropores are much smaller than the typical 0.6 mm of puffed rice and the delays between quakes would be hardly distinguishable.

Photo of section through puffed rice

The gradual collapse of micropores could still influence the creep rate of these materials, however. “The time signatures of the instabilities in our experiments are reminiscent of observations of tidal icequakes from the Whillans Ice Stream, Antarctica, which exhibit an astonishingly similar pattern of incremental displacements,” write Einav and Guillard in Science Advances. The slowdown in the waiting time between icequakes happens over many years and is thus much milder than the slowdown of ricequakes, they add.

A scaled-up version of the model, the researchers believe, could be relevant to geological pressures and durations in crustal rocks and ice sheets. But first they’d like to test a wider range of brittle porous solids and chemically active fluids in the lab, as well as trying out different gravity conditions.

This is not the first time that researchers have replicated rock deformation with a foodstuff; dry cornstarch is useful for modelling brittle crustal rock whilst puffed rice has also revealed compaction patterns in dry snow.

The team published their findings in Science Advances.

Copyright © 2026 by IOP Publishing Ltd and individual contributors