How to answer cosmic queries

When you create a blog (Astroquizzical) whose sole raison d’être is answering questions from the general public about space, you anticipate that there will be some unusual questions coming your way. But some of these are so unexpected and stray so far afield from the sorts of questions that, as a trained scientist, I would pose, that you really have to stop and think about how best to answer them.

These unanticipated queries come in three broad forms. The first are questions that have mixed up or jumbled concepts, and what brings you pause is how to best untangle the knot of confusion. This gets us into questions like “How come the signal from our spacecraft doesn’t get lost on the way back to Earth? Wouldn’t objects in between them and us block the signal?” To answer this takes an understanding that spacecraft must ping information back to Earth, that astronomical distances make this task harder, and that a solid object (like a planet) must do something to that signal. What is missing from this picture, though, is a grasp of how fundamentally empty most of space is. To answer this, I must go into a combination of the emptiness of space, even in the relatively dense solar system, and the limitations of our solar-system explorations so far. It’s certainly true that we can’t hear from Mars when it’s on the other side of the Sun. But for spacecraft like NASA’s New Horizons probe, which is much further away than Mars, the signal from the craft can spend its time zooming through the mostly empty solar system, arriving safely at Earth without ever having to bounce off a planet.

The second type of perplexing questions are those from children, who have, in their deep curiosity, invented a theory, but with no background material whatsoever. These questions are often the most unexpected, but can usually be answered using a relatively straightforward path – children want to know how it works, so there’s not so much untangling of existing knowledge to do. These questions can, however, be the most amazing scenarios you’ve ever heard. One of my all-time favourite questions was passed on by the parent of a five-year-old, who wanted to know if the universe was tiger-shaped, surrounded by dinosaur bones. I unabashedly love this cosmological hypothesis, which, in this case, even the child was not so certain of. Fortunately, the tests which have told us that the universe is fundamentally flat also (alas) rule out a tiger-shaped universe.

A five-year-old wanted to know if the universe was tiger-shaped, surrounded by dinosaur bones. I unabashedly love this cosmological hypothesis

The last are people who aren’t super-confused, have a little bit of information in their heads and have come up with some fantastical scenario, but can’t figure out how that scenario would work given their existing information. This is the set of questions for which I usually have to do the most work. All of the submitted questions require a degree of research to answer them, but these hypotheticals often require me to extract numbers from technical papers, make some assumptions, and work out some values that are useful for that scenario. This is where “if you didn’t burn up, could you surf on the Sun?” fits. “If you could divide the Sun into two half-sized Suns, what would happen to the Earth?” “Can you actually take an entire star and pull it into a planet sized object, the way they did in Star Wars?”

While these ones are my favourites to answer, they are simultaneously the trickiest. How do you figure out if you could surf on the Sun? What’s the density of the surface of the Sun relative to water? A billion times less dense. Ok, so what if you make the surfboard bigger? That’s a possible solution – increase the surface area, and you can increase the buoyant force from the Sun. But you’d need to have a surfboard 26 m long, and it would need to weigh barely as much as a mosquito in order to float on the surface – a technologically impossible task. To actually balance a human on board, you’d have a surfboard the size of Manhattan.

What about half-sized suns? This question boils down to “are two suns of 50% the mass of the Sun equal in brightness to 1 Sun?” The answer to this is no – 50% of the mass only gets you 10% of the light, so at a maximum, the Earth would be getting 20% of the light it currently receives. If you don’t like winter now, you’d really dislike the planetary deep freeze that the Earth would endure if we split the Sun in half. Mercury would start to look balmy at that point, but with Mercury’s strange rotation, both the days and the nights would be lengthy.

Can you compress a star into something smaller? Sure, but that would be at the expense of whatever you hope to use to contain the star, because if you compress a star, you wind up with some kind of stellar remnant – a neutron star or black hole. The gravitational forces surrounding these objects are extreme, and would rupture any rocky structure surrounding it. And if you cut deeply into a planet the way that Starkiller Base did, you’d have a lava trench, as the mantle of the planet would be exposed.

These are only a few of the many questions that have been answered. There’s a backlog of equally excellent questions waiting for me to get to them, and even more answered in my new book Astroquizzical: a Curious Journey Through Our Cosmic Family Tree.

Aurora experts need to talk about STEVE

Back in 2016, the Alberta Aurora Chasers Facebook group brought a new atmospheric phenomenon – a narrow band of purple and white light – to the attention of scientists. Now, a team from the US and Canada has found that such STEVE events are probably not caused, as auroras are, by charged particles precipitated into the upper atmosphere. Instead a new ionospheric mechanism may be responsible.

“Our main conclusion is that STEVE is not an aurora,” says Bea Gallardo-Lacourt of the University of Calgary, Canada. “So right now, we know very little about it. And that’s the cool thing, because this has been known by photographers for decades. But for the scientists, it’s completely unknown.”

To come up with this finding, the team used All-Sky Imagers based on the ground in eastern Canada and data from a NOAA Polar Orbiting Environmental Satellite (POES) that happened to cross a STEVE event on 28 March 2008 at the centre of the All-Sky Imager field-of-view. The light from this STEVE covered roughly 1000 km from east to west but was only tens of kilometres wide. An aurora had appeared beforehand.

The POES-17 satellite did not detect any charged particles raining down to the ionosphere during the STEVE event, indicating it was probably produced by an entirely different mechanism. The team has dubbed STEVE a kind of skyglow, rather than an aurora.

The first research paper about STEVE was published in Science Advances in March 2018. That team, which included Gallardo-Lacourt, found that there was a stream of fast-moving ions and super-hot electrons passing through the ionosphere where STEVE was visible. It wasn’t clear, however, whether these particles were responsible for producing the event.

STEVE was originally named after the 2006 animated film Over the Hedge in which animals call an unknown object Steve to make it less scary. Later scientists proposed a backronym, with the letters standing for Strong Thermal Emission Velocity Enhancement.

Next Gallardo-Lacourt and colleagues plan to investigate whether the streams of fast ions and hot electrons in the ionosphere create STEVE’s light, or the light comes from higher up in the atmosphere. To fully understand STEVE’s secrets they will need particle measurements from more STEVE events.

Gallardo-Lacourt and colleagues reported their findings in Geophysical Research Letters.

  • This news article is based on a press release from the American Geophysical Union.

β-CUBE delivers high-performance small-animal PET

 MOLECUBES

Preclinical PET is an ideal research tool for studying small-animal models of disease. To optimize systems for imaging the minute features of mice, developing small-animal PET scanners with high spatial resolution and high sensitivity is a longstanding goal.

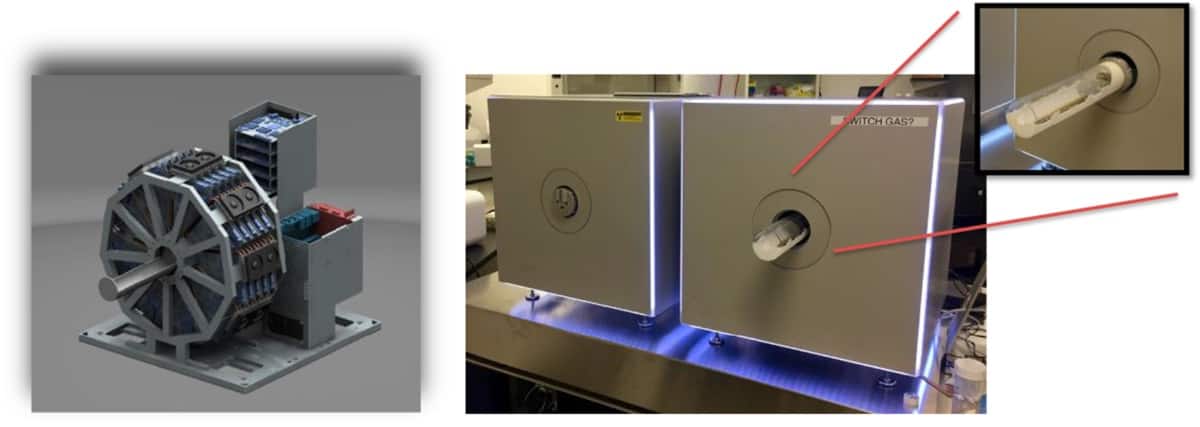
Ghent University spin-off MOLECUBES recently launched a line of dedicated small-animal scanners, including the β-CUBE (PET), X-CUBE (CT) and γ-CUBE (SPECT) systems. The β-CUBE is lightweight, compact (54 cm3) and enables bench-top imaging of both mice and rats. The first β-CUBE and X-CUBE scanners were recently installed in the Small Animal Imaging Facility at the University of Pennsylvania. The team has now reported the findings of a detailed performance evaluation of its β-CUBE (Phys. Med. Biol. 63 155013).

“The main challenge in PET imaging of mice is developing a scanner that offers functionality and practicality for high-throughput imaging, as well as excellent performance,” says first author Srilalan Krishnamoorthy. “The combination of high spatial resolution and high sensitivity is very important – this leads to images that have excellent statistical quality with the ability to achieve quantitatively accurate measurements of radiotracer uptake.”

System specifications

The β-CUBE detector comprises an 8 mm thick monolithic LYSO scintillator coupled to an array of silicon photomultipliers. The monolithic scintillator delivers high intrinsic spatial resolution and enables depth-of-interaction (DOI) measurement. A total of 45 PET detectors arranged in five rings provides a scanner diameter of 7.6 cm and an axial length of 13 cm – suitable for whole-body imaging of both rats and mice.

The PET scanner can be used individually, or in combination with the X-CUBE micro-CT scanner. The animal bed is easily transferred into the X-CUBE, and the 3D PET and CT images are automatically co-registered. The CT acquisitions can be also used to perform all attenuation and scatter corrections necessary to obtain quantitative PET images.

The team first measured the spatial resolution of the β-CUBE using a 22Na point source embedded in an acrylic cube. The source was placed at the scanner centre and stepped radially across the detector field-of-view (FOV). Reconstructing the PET data with a 3D filtered back projection algorithm revealed an excellent spatial resolution of better than 1 mm over the entire FOV.

“The scanner has excellent spatial resolution that is uniform over the imaging FOV, due to its ability to compensate for parallax error in the image reconstruction process,” explains Krishnamoorthy. “This capability is due to the sophisticated monolithic detectors that enable the DOI of the gamma rays within the crystal to be measured.”

Using the same point source, the researchers measured a maximum absolute sensitivity of 12.4% at the scanner centre, using a 50% energy window (255-765 keV). With a 15% energy window (435-588 keV), as is routinely used for animal imaging, they measured an absolute peak sensitivity of 5.7%.

The researchers also used NU-4 standard line-source mouse and rat phantoms to measure scatter fraction (scattered events/scatters plus trues) and noise equivalent count (NEC; trues squared/total counts). They recorded scatter fractions of 11.3% and 15.7%, with the mouse and rat phantoms, respectively. Peak NECs were 300 and 160 kcps in the two phantoms, using the 15% energy window and measured with 900 μCi in the phantoms.

Derenzo phantom

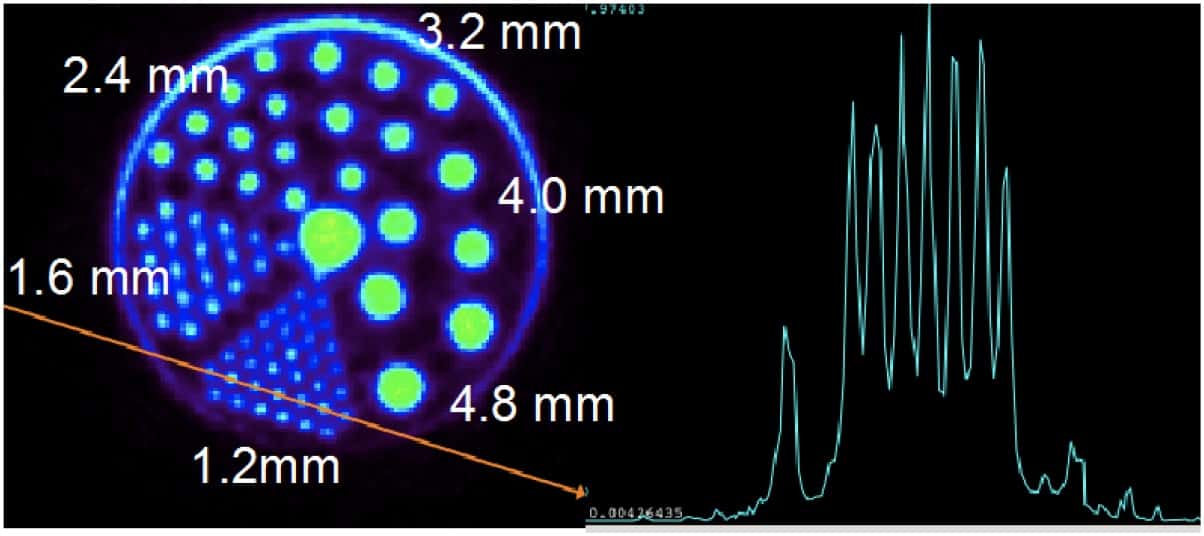
Images of the NU-4 image quality phantom (reconstructed using CT correction of attenuation and scatter) revealed an image uniformity of 7.4% and spill-over ratio of 8%. The researchers measured a contrast recovery of about 70% for 2 mm-diameter rods and full recovery for rods of 3 mm or larger. They also imaged a Micro Derenzo hot rod phantom, and saw that the smallest 1.2 mm rods were clearly visualized and well separated.

Animal investigations

Krishnamoorthy notes that, thanks to an in-house cyclotron and an excellent radiochemistry group at the University of Pennsylvania, the Small Animal Imaging Facility team has used the β-CUBE to perform animal studies with a variety of novel PET radiotracers, in many areas of oncology, neuroscience and cardiology.

In one investigation, they used 18FDG PET to investigate inflammation in osteoarthritis of a rat’s temporomandibular joint (TMJ). They performed a 15-min static PET scan 1-hour post-injection, immediately followed with a CT scan. The co-registered images delineated the small structure of the TMJ from the surrounding jaw, leading to a more accurate measurement of the FDG signal and improved tracking of disease progression.

PET and PET/CT images

In a second example, the researchers describe a lung tumour imaging study in mice, using a 15-min static PET scan 1-hour post-injection of 18FDG. They note that the superior spatial resolution and contrast recovery allow better visualization of smaller structures in comparison with their older system, which has 2 mm spatial resolution.

“We are currently working on optimizing our current imaging protocols to fully utilize the MOLECUBES PET and CT scanners,” Krishnamoorthy tells Physics World.

Cosmic connections

Solar system

Jillian Scudder tells the story of our universe’s history in Astroquizzical: a Curious Journey Through Our Cosmic Family Tree. Starting with the human race, she explores our perception of space and how we have been trying to explore and understand it from our “parent”, Earth. Along the way we are taken through several thought experiments and get to enjoy some beautiful images from space. She moves on to our “cosmic companion”, the Moon, briefly exploring its creation and effect on the Earth. Included here is a thought experiment about putting a wormhole between the Earth and Moon – which doesn’t seem like a good idea.

The next step is Earth’s immediate family, or “siblings”, in the form of the other planets in our solar system. We learn how the planets were formed from the leftover dust and gas as our Sun was forming. Scudder then starts considering exoplanets, with a thought experiment about the possibility of life on other worlds, and the weird places we may find it. Next along this family tree, at the level of “grandparent”, are stars, starting with our Sun. There is an entire chapter on stellar deaths. If they’re large enough, these stars will collapse into black holes, but there are plenty of other beautiful and violent ends to be explored. Extending the family tree even further, Scudder moves outwards to galaxies. These are a diverse bunch, with many different categories to choose from, and there is an all-too-brief look into my own favourite: supermassive black holes.

On the whole, Astroquizzical is a good read for those who want to know more about the universe, how we got to be here and how we fit in to the history of the cosmos. But ultimately, it is aimed at the astro-interested, not the astro-educated. The book ends with a look at the universe as a whole: how it is still expanding, and how the further away we are able to look, the further back in time we are able to see. Scudder does well in showing how little of this universe we know even today, and how tiny our place in it is.

  • 2018 Icon Books 224pp £13.88hb

Carbon counting and beyond

Illustration of power station

The debate over the relative levels of carbon emissions from the various energy generation options has been quite long and tortuous. It seems clear that fossil fuels are bad news, but there is uncertainly about the relative merits of nuclear and renewables – most see the carbon footprint of renewables as very low, but what about nuclear?

A recent study by researchers at Potsdam Institute for Climate Impact Research, Germany, published in Nature Energy, estimates the 2050 full lifecycle greenhouse gas emissions of a range of sources of electricity in a 2 °C scenario. It claims that the carbon footprints of solar, wind and also nuclear power are many times lower than coal or gas with carbon capture and storage (CCS). This remains true after accounting for emissions during manufacture, construction and fuel supply, i.e. the so-called embodied energy.

Wind, photovoltaics (PV) and nuclear all do well, in the range 3.5–12 g CO2 equivalent/kWh, with solar at a mid-range 6 g CO2 eq/kWh, and wind and nuclear at 4 g CO2 eq/kWh. Fossil CCS is high, nearing 100 g. There are still upstream emissions from mining and not all the plants’ CO2 can be captured. Biomass and hydro are also high, around 100 g, but “highly uncertain”. Bio-energy with carbon capture and storage (BECCS) has the advantage of negative emissions – see my next post – but with hydro in some locations there can be methane production from trapped biomass.

Lifetime energy

In terms of the percentage of the lifetime energy produced by each plant, the energy needed for building wind turbines comes out by far the lowest, PV next best, with Energy Return on Energy Invested ratios (in effect the inverse of embodied energy) of 44:1 and 26:1, respectively. Nuclear comes out with an EROEI of 20:1. That seems high (it’s usually put at 15:1 for pressurized water reactors (PWRs)), given the energy/materials intensive nature of the complex plants and, crucially, the energy used in uranium mining and processing. What’s more, although new extraction techniques may help reduce the energy used for fuel production initially, longer term it may well rise, and EROEIs fall, since lower grade ores, harder to get and process, will have to be used in future as uranium reserves deplete. Certainly, an earlier meta review of multiple studies by Ben Sovacool suggested that the figure for nuclear was much lower.

…is there any point in trying to live on a polluted, radioactive planet with the ecosystem undermined in other ways – and draconian political regimes reinforcing social inequalities in response?

Dave Elliott

However, in the Potsdam study, all the rest are very much worse, including fossil fuels with CCS, but also hydro – surprisingly given its long operational life. But then it does involve a lot of concrete. Biomass also comes out poorly, including BECCS, but it’s a low energy-density fuel and you need more energy to collect it and get less energy out per unit of input than from fossil fuels.

The Potsdam paper’s estimates of full lifecycle greenhouse gas emissions for the different sources of electricity assume a 2 °C world in 2050, when global electricity supplies have been largely decarbonized. So the indirect emissions due to the electricity used for manufacturing systems are lower than now, for example, for a solar cell fabrication factory or for some parts of nuclear fuel production, though not presumably for uranium strip mining, if that is still used – it will need a lot of diesel diggers and trucks, unless they are all battery or syngas powered by then.

Overall the report concludes: “The indirect greenhouse gas emissions induced by upscaling wind, solar and nuclear power are small compared with other emissions sources, and thus do not impede the transformation towards climate-friendly power supply.” That is certainly interesting. For example, in a review of the report Carbon Brief  notes that some earlier studies had suggested the opposite – renewables would need a lot of energy to build, and more than nuclear.

Wider metrics

Be warned though, this sort of analysis is tricky. There are lots of unknowns and assumptions about assessment boundaries. What’s more, although the Potsdam researchers say they have taken these into account in the ranges they offer, it’s hard looking to 2050. The technology is changing fast and market and regulatory pressures may shift priorities and valuations in unexpected ways. If by then we are running a basically low-carbon energy system, the main issues may be different – less to do with carbon, more to do with relative environmental and social impacts, land-use, water use and so on. For example, a recent report from University College London (UCL) has proposed new, wider metrics for sustainable development.

There are several candidates beyond just eco-impacts and costs. For example, employment creation is potentially a positive socio-economic impact, which some see as part of the case for adopting sustainable energy. There are now national campaigns for “One Million Climate Jobs”, e.g. in South Africa. And the EU has adopted job creation as a key metric in its approach to development aid. So we are moving beyond just carbon counting.

That is implicit in many recent studies that include wider social and economic costs and benefits: carbon saving is only one factor. Some interventions may deal with both carbon and other issues, for example, the adoption of renewables will also reduce air pollution. Some may deal with carbon but introduce other problems – for example, with nuclear power, the risk of incidental and accidental radiation release. Nuclear radiation hazards are, of course, not included in the Potsdam greenhouse gas analysis, nor in the UK government’s carbon accounting approach. It’s not easy to do that, given the uncertainties involved – for example, we are still debating the human cost of Chernobyl with, worryingly, a new UN report raising the thyroid cancer rate significantly.

Even leaving that aside, given the range of issues and options, strategically, in some cases, there may be conflicts over which focus should have priority. As the UCL paper says, “there are complex trade-offs between the natural resource dependencies of energy, food and water systems, and environmental threats including biodiversity loss, climate change and localized air and water pollution”. It concluded: “These synergies and trade-offs will manifest differently in different settings, and the impacts for different social groups will need to be understood and accommodated. Considerations of rights, justice and equity must be integrated into the exploration of solutions for these complex energy dilemmas to ensure we leave no one behind.”

Those worried mainly about climate change may object that everything else must be secondary, arguing that all other issues are irrelevant if the climate system is seriously disrupted. But equally, is there any point in trying to live on a polluted, radioactive planet with the ecosystem undermined in other ways – and draconian political regimes reinforcing social inequalities in response? Hopefully, extremes like this can be avoided, but as UCL says, “decision-makers can no longer think in silos, and will need to find ways of widening participation, creating collective ownership and building consensus.”

 The trade-off issues can clearly be complex and that shows up when we look at specific sets of options in relation to carbon reduction, as I will explore in the next few posts.

Cosmic Bell test uses light from ancient quasars

Light that has travelled billions of light-years from now-ancient quasars has been used by physicists to close the “freedom-of-choice” loophole in Bell tests of quantum entanglement. Done on Spain’s Canary Islands, the experiment is a significant improvement over a similar test done in 2017 that used light from nearby stars. Meanwhile in China, an independent team has done a similar experiment using starlight that also closes the “fair sampling” loophole.

Entanglement is a curious consequence of quantum mechanics that allows two particles to be connected in a way that cannot be described by classical physics. It is observed as correlations between measurements made on two particles (such as their polarizations). In 1964 the Northern Irish physicist John Bell described his famous test of whether such correlations are stronger than those allowed by classical physics – as defined by a violation of what is now called Bell’s inequality.

Many Bell test experiments have since been done to confirm entanglement. However, no experiment is perfect and there are number of experimental “loopholes” that could allow purely classical phenomena such as faulty detectors to affect the outcome. In 2015, physicists simultaneously closed two important loopholes called “fair sampling” and “locality”.

Unknown correlations

Freedom of choice is another important loophole that involves how the measurements are done. In a Bell test on entangled photons, a large number of measurements are made on different entangled pairs in which the direction of the polarization measurement is selected at random. If, for some reason, the polarization selection is not random but correlated to other aspects of the experiment, then the outcome of the Bell test could be affected.

In 2017 Johannes Handsteiner and Anton Zeilinger of the University of Vienna and an international team used the random nature of starlight to close this loophole. Two telescopes at two locations in Austria separated by nearly 2 km were pointed at two different stars. The colour of the starlight changes in a random manner and this was used to decide how to set Bell test polarization detectors. The stars were chosen so that their light arrives at their respective telescopes first, before reaching other parts of the experiment. This, and the fact that the starlight light was created hundreds of years ago, very far away from Earth and in stars separated by a great distance allowed the physicists to conclude that there is no correlation between the choices of polarization measurement and the rest of the Bell test experiment.

Now, the team has joined forces with astronomers at two telescopes on the Canary Islands to do a similar Bell test using light that was first emitted from quasars billions of years ago. The experiment involved two measurement settings – one dictated by the colour of quasar light generated about 8 billion years ago and the other dictated by the colour light generated in a different quasar about 3 billion years ago. The result is a violation of Bell’s inequality by 9.3σ, which is well in excess of that usually needed to qualify a discovery-level measurement.

Fair sampling

The experiment is described in Physical Review Letters, where the team points out that their experiment does not close the fair sampling loophole. This is because the photon detection process was relatively inefficient and so many entangled pairs were not measured. As a result, there was no way of knowing if there is a bias in which photons were detected and which were not – and such a hypothetical bias could result in a false positive Bell test.

Also in that issue of the journal is a paper by Jian-Wei Pan of the University of Science and Technology of China and colleagues, who describe a similar experiment using starlight. In their experiment, however, they closed the fair sampling loophole by ensuring that their photon detectors operated at about 78% efficiency – high enough that a hidden bias would not affect the Bell test.

New evidence for cyclic universe claimed by Roger Penrose and colleagues

Unexpected hot spots in the cosmic microwave background (CMB) could have been produced by black holes evaporating before the Big Bang. So says a trio of scientists led by mathematical physicist Roger Penrose in a paper presenting new evidence that our universe is just one stage in a potentially infinite cycle of cosmic extinction and rebirth. Other researchers, however, remain sceptical that the microwave background really does contain signs from a previous “aeon”.

According to standard cosmology, the universe underwent a very brief but exceptionally intense expansion just after the Big Bang. This period of “inflation” would have ironed out any irregularities in the structure of the early universe, leading to the very uniform cosmos that we observe around us.

However, Penrose, based at the University of Oxford , has developed a rival theory known as “conformal cyclic cosmology“ (CCC) which posits that the universe became uniform before, rather than after, the Big Bang. The idea is that the universe cycles from one aeon to the next, each time starting out infinitely small and ultra-smooth before expanding and generating clumps of matter. That matter eventually gets sucked up by supermassive black holes, which over the very long term disappear by continuously emitting Hawking radiation. This process restores uniformity and sets the stage for the next Big Bang.

Losing mass

CCC has met with scepticism from many cosmologists since being put forward in 2005, not least because the matching up of an infinitely big universe in one aeon with an infinitely small one in the next requires that all particles lose their mass when the universe gets very old. However, in 2010 Penrose and Vahe Gurzadyan of the Yerevan Physics Institute in Armenia claimed that they had found evidence to support CCC in the form of rings of uniform temperature within the CMB. Those rings, the idea went, would be the signature in our aeon of spherically-emitted gravitational waves generated by colliding black holes in the previous aeon.

The pair found such rings in data from NASA’s Wilkinson Microwave Anisotropy Probe (WMAP), while at the same time claiming that they saw no such pattern in (standard) simulations of the CMB that they had carried out. Other groups, however, argued that simulations did indeed contain rings – once they had been modified to take account of the distribution of hot and cold spots at various angular scales that are seen in the real CMB and which are predicted by inflationary physics.

Undeterred, Penrose has now published a different kind of evidence in support of CCC. Rather than rings of near uniform temperature, he has instead identified patches within the CMB that are much hotter than the surrounding region. The idea is that these hot spots could be due to the (mainly electromagnetic) radiation given off during the Hawking evaporation of supermassive black holes in the previous aeon.

Hawking points

Penrose says that although originally very feeble, those emissions would have been concentrated in our own aeon into spots with huge amounts of energy that he and his colleagues call Hawking points. That concentration comes about, he explains, because “the universe loses track of how big it is at the transition between aeons”. The Hawking points would then have stretched during the early universe, forming circular patches with a diameter on the sky about five times that of the Moon.

In a preprint recently uploaded to the arXiv server, Penrose and two colleagues – Daniel An of the SUNY Maritime College in the US and Krzysztof Meissner at the University of Warsaw in Poland – report scouring CMB data from the European Space Agency’s Planck satellite for hot spots of various sizes and analysing how quickly the microwave temperature drops off around them compared to spots in 1000 simulated maps of the CMB. They found that in and around small spots, not a single simulated map had higher temperature gradients than the real cosmos – with the temperature variations in the latter case being about an order of magnitude higher (some 3×10⁻⁴ K) than the CMB average.

Strong backing

According to Penrose, this disparity between real and simulated data provides strong backing for CCC over inflation. “We certainly welcome attempts to explain these observations in terms of currently accepted models,” he says, “but we think this will be hard unless radically new ideas come forth”.

Some other physicists, however, remain unconvinced. James Zibin of the University of British Columbia in Canada points out that scientists have been scrutinising the CMB for years and have found no evidence for particularly hot spots (although they have identified one anomalous cold patch). He also reckons that Penrose and colleagues have failed to account for the “look elsewhere” effect, arguing that because they found the hottest spots in the real as opposed to simulated data in just 2 out of 40 tests (focusing on different sizes of spot and CMB border region each time) the chances of having been the victim of a statistical fluke drop from 1 in 1000 to as low as 1 in 50.

Douglas Scott, a colleague of Zibin at British Columbia, is also sceptical. Describing the paper as “very muddled and hard to follow”, he is wary of what he sees as a potentially never-ending series of attempts to find unusual features in the CMB. “Obviously, if someone could show that some specific pattern on the microwave sky was a proof that the universe underwent a series of cycles then that would be spectacularly exciting,” he says. “But this paper falls very short of doing that.”

What’s the best way to encourage electric vehicle adoption?

Switching from gasoline-fuelled to electric-powered vehicles can reduce local levels of air pollution, particularly in cities with lots of traffic. It’s a swap that many countries are keen to encourage, but what’s the best way to nudge vehicle owners in this direction?

In the US alone, the years since 2008 have seen more than 400 state and local incentives to increase the adoption of plug-in-electric vehicles. In a recent study, researchers searched through the data to determine the most effective tools that policy-makers can apply.

“A rebate targeted at affordable battery electric vehicles (BEVs) combined with early investments in charging infrastructure along roadways where EVs would most need them is likely to increase EV adoption,” says Easwran Narassimhan of Tufts University, US, who carried out the analysis with Caley Johnson from the US National Renewable Energy Laboratory.

Narassimhan and Johnson’s results show that a $1000 incentive increase given as a rebate can raise EV sales by 4.8% compared with just 2.3% when the saving is provided as a tax credit. The observation tallies with earlier work, which found that incentives closer to the point of sale tended to be more attractive to potential customers than rewards that arrived later.

Early investments in infrastructure get the thumbs up from the team as public charging points are likely to incentivise early adopters, which can provide a multiplying effect on electric vehicle sales. There are other options too.

One of the most cost-effective policies was an exemption from high-occupancy lane rules – a relatively inexpensive incentive that boosted sales of battery electric vehicles by 15%.

Also, there are signs that rising environmental awareness could be as strong a factor as the availability of tax incentives — especially in promoting sales of plug-in hybrid electric vehicles — at least in states with a good track record in communicating pollution issues.

With more data being added all the time, policy-makers are likely to be even better equipped in future to reduce the number of gas-guzzling vehicles on our roads. Narassimhan and Johnson are keen to expand their analysis as new figures become available.

“This includes looking more closely at demographic factors such as vehicle miles travelled per capita, environmental awareness, and unemployment,” says Narassimhan. “We’re also interested in incentives for home charging and home electric vehicle supply equipment, which intuitively should have a strong relationship since a majority of electric vehicle owners charge at home.”

Narassimhan and Johnson published their work in Environmental Research Letters (ERL).

What is a quantum simulation?

Quantum simulators can be thought of as specialised kitchen equipment that is exceptionally good at producing one type of food – perfectly cooked toast, for example. That is the analogy used by Lincoln Carr of the Colorado School of Mines in this video for our 100 Second Science series.

Thinking points for career bliss

My CV was once described by a head-hunter as “interesting”. Although I’m not sure that was meant as a compliment, I can hold my hands up to having been an opportunist and a little fortunate. After completing my PhD in optoelectronics at University College London (UCL), I was walking past the offices of a small computational fluid-dynamics consultancy in London, when I decided to go in and find out a bit more about what they did. They offered me a job as a project engineer and I worked with them for clients including NASA. I’ve since made rather too frequent use of the phrase “it’s not rocket science – I know, because I was a rocket scientist”.

Admittedly that was a rather serendipitous introduction to the world of work, but it wasn’t such an unusual first career move for a graduate physicist. But then followed a more unusual stream of roles: aviation-operations research analyst; KPMG Consulting first as a process analyst, then a mergers and acquisitions adviser and an implementation programme director for large IT systems. I have been a chief people officer for an international media and advertising giant; a professional leadership coach; a director at the BBC; and a director of human resources and organizational change in the civil service. Along the way I studied drama; designed, coded and sold iOS apps in popular psychology; earned money as a guitarist in an indie band; and as a semi-professional – and most definitely only semi-talented – artist.

Today, I am a coach and interim manager, and an adviser to government on diversity and inclusivity; though I can see myself taking on another permanent job soon. Perhaps my most ironic role has been as a consultant and graduate/staff course designer and lecturer at UCL in learning and facilitation, psychology and winning funding bids.

Looking back, I find it hard to believe that I followed this meandering path

Looking back at that list, I find it hard to believe that I followed this meandering path. I left mainstream physics quite early and there is every indication that many physics graduates do the same, and this means being prepared for a different world. With that in mind, I want to share three key concepts – to be aware, willing and able – which I now understand but wish I had taken the time to delve into while I was completing my university studies.

Aware

First is the importance of awareness. There are many types of awareness, and foremost is self-awareness. I coach some very senior people in science and also in business, and I marvel at how little many of them understand about their own skills and personalities before making career decisions. Moreover, evaluation tools for skills such as verbal and numerical reasoning, spatial resolution (and recruitment simulations based on these) are frequently used in hiring so it’s a good idea to evaluate your aptitudes before you even write a job application.

Awareness of the job market is also important, and it is sensible to form a view on whether career opportunities in a given sector are likely to increase or decrease in the medium to long term. Establishing relationships with a few well-chosen recruitment consultants or market analysts at the start of a career can help – after all they are the experts, it’s their job. They see lots of people and have long memories – and your initiative will keep you in their minds for future opportunities. I’ve had two major roles come out of the blue from headhunters I’d made contact with years previously.

Using psychometrics – the objective measurements of mental and psychological abilities – can be invaluable in raising self-awareness, but they come with caveats and need balanced interpretation. The psychologist Carl Jung postulated that the brain has a dominant preference to perceive information in one of two ways (“sensing” or “intuition”) and to make decisions in one of two ways (“thinking” or “feeling”). Personality type psychometrics can illuminate personal preferences toward these mental functions and provide insights into whether, for example, a theoretical or practical choice of career (or indeed final-year physics project or PhD thesis) might suit a person better. Having the desire theoretically to conceptualize the Higgs boson is one thing, and being drawn to carrying out experiments to find it is quite another, which is why different physicists pursued those two goals. The same principle applies to pursuing careers.

Willing

The second concept is the importance of being truly motivated to do what you do – not just doing it because you need a job, but because it is something you will find personally fulfilling as a completely willing participant. There’s extrinsic motivation (to avoid punishment or earn a reward) and there’s intrinsic motivation (enjoying an activity for its own sake) – and the latter is more powerful. It’s the type of motivation that will get you out of bed in the morning without need for an alarm clock or the fear of an exam deadline.

Be truly motivated to do what you do – not just because you need a job

Research carried out by psychologists Edward Deci and Richard Ryan in the 1980s and 1990s found that there are three main drivers of intrinsic motivation: increasing one’s ability in an area where one has an interest; having an appropriate degree of control about what one does; and being given the opportunity to genuinely relate to the people with whom one works. In addition, everyone has their own specific intrinsic motivators: things a person finds enjoyable, or important beliefs such as moral, ethical or political views.

Examining the opportunities for all your personal intrinsic motivators in a particular career or organization will lead to a more fulfilling career path and so can help you before you initiate job applications. Making career choices that align with your motivators will go a long way to ensuring you are on the right path for you. On the other hand, a negative correlation between a career choice and your intrinsic motivators could see you professionally unfulfilled and back on the job market sooner than you might like.

Able

The third concept – and the one on which most people focus their efforts to the exclusion of the first two – is the importance of knowing your abilities, or what you need to be good at in a particular job. Ability includes so-called “soft” skills (sometimes not soft at all) relating to teamwork and personal interactions. Ask yourself what transferable skills you have from your education and life so far. If you are lacking in the abilities or skills you need, find out how you can develop them. Last, but not least, you need the ability to present yourself to a potential employer in a way that they will find attractive enough to interview and employ you. This means writing a standout CV and developing your interview skills – but these are topics for another day.

Copyright © 2026 by IOP Publishing Ltd and individual contributors