For a global average temperature rise of 1.5 °C, 16% of the world’s population in 2050 – 1.5 billion people – will have moderate-to-high levels of risk in two or more of the water, energy, and food and environment sectors. At 2 °C this figure nearly doubles to 29% of global population, whilst at 3 °C of warming it rises to half the population, or 4.6 billion people.
“Few studies have consistently investigated so many overlapping climate and development challenges,” said Edward Byers of the International Institute for Applied Systems Analysis (IIASA), Austria, in a press release. “The research considers both different global mean temperature rises, such as the differences between 1.5 °C and 2.0 °C, and uses new socioeconomic datasets of income levels and inequality, to identify where and to what extent the most vulnerable in society are exposed to these climate-development challenges.”
At lower temperature rises, hotspots of risk in two or more sectors were mainly in south and east Asia, Byers and colleagues found. At higher global temperatures, hotspots also broke out in Central America, west and east Africa, the Middle East and the Mediterranean.
Depending on the scenario used, 91–98% of the exposed and vulnerable population live in Asia and Africa. Sustainable development in hotspot areas could reduce the number of people who are exposed and vulnerable by an order of magnitude, from 1.5 billion to 100 million, compared to the high inequality scenario, according to the researchers.
“The research will be most relevant to policymakers and others looking to understand the benefits of keeping the average global temperature rise to 1.5 °C rather than 2 °C, as well as providing insights into the regions most at risk across different sectors,” said Astrid Hillers of Global Environment Facility, US. “The poorest and most vulnerable countries are most at risk and this work will aid to identify integrated, cross-sectoral approaches and target resources for maximum impact.”
The land mass affected, 3–16% depending on the scenario, was relatively small but the areas at highest risk tend to have high population densities.
Researchers at MIT’s Little Devices Lab have developed a set of modular blocks that can be assembled in different ways to produce diagnostic devices for functions such as infection detection and glucose monitoring. These “plug-and-play” blocks are inexpensive, reusable and require little expertise to assemble (Advanced Healthcare Materials doi: 10.1002/adhm.201800104).
“Our long-term motivation is to enable small, low-resources laboratories to generate their own libraries of plug-and-play diagnostics to treat their local patient populations independently,” explained Anna Young, co-director of the Little Devices Lab.
The components, called Ampli blocks, are based on paperfluidics technology in which chemical reactions occur on paper strips. They consist of a sheet of paper or glass fibre sandwiched between a plastic or metal block and a glass cover. The blocks, which are about half an inch on each side, snap together along any edge to construct customized diagnostic devices.
The MIT team has created about 40 different building blocks, colour coded by function, that lab workers around the world could easily assemble on their own. Some blocks contain channels for liquid samples to flow straight through, some have turns and can mix multiple reagents together. The blocks can also perform biochemical functions. For example, many contain antibodies that can detect a specific molecule in a blood or urine sample.
The blocks do not require refrigeration or special handling, making them appealing for use in the developing world. “We see these construction kits as a way of lowering the barriers to making medical technology,” said senior author Jose Gomez-Marquez, co-director of the Little Devices Lab.
The researchers are using the Ampli blocks to create devices to detect cancer, as well as Zika virus and other infectious diseases. They are also working on tests for human papilloma virus, malaria and Lyme disease, among others. In addition, they are working on blocks that can synthesize useful compounds, including drugs, as well as blocks that incorporate electrical components such as LEDs.
The ultimate goal is to get the technology into the hands of small labs in both industrialized and developing countries, so they can create their own diagnostics. The MIT team has already sent Ampli blocks to labs in Chile and Nicaragua, where they have been used to develop devices to monitor patient adherence to tuberculosis treatment and to test for a genetic variant that makes malaria more difficult to treat.
The researchers are now investigating large-scale manufacturing techniques, and they hope to launch a company to manufacture and distribute the kits around the world.
Over two thirds of researchers have released the results of at least one study they authored before the findings were formally published. That is according to a survey of more than 7000 researchers across nine disciplines carried out by Jerry Thursby from Harvard University’s Laboratory for Innovation Science and colleagues. The researchers found that social scientists, mathematicians, biological scientists and those working in agriculture have the highest disclosure rates, with around 75% sharing the results of work before final publication. The figure for physical scientists is slightly less, at 67%.
The survey found that most academics who share their work early – either at conferences, in preprint papers or during earlier conceptual stages – do so to get feedback from peers. Other reasons include receiving credit for their work early, attracting potential collaborators and deterring competition. Researchers who share the least, meanwhile, are the most worried about being scooped by their peers.
The authors say that why some academics share earlier than others depends on the norms within their field, the amount of competition and how commercial their field is. This could explain why only around 40% of computer scientists and 55% of engineers report sharing their results before final publication – much lower than in purer areas of work.
“Discipline norms are also reflected in embargoes or regulations by major publishers within a discipline that prohibit early sharing of results,” notes Carol Tenopir, an information scientist at the University of Tennessee in Knoxville. “Willingness to disclose may not be possible according to rules governing the major publication outlets in their field.”
Bernd Pulverer, head of scientific publications at the European Molecular Biology Organization in Heidelberg, Germany, is surprised by the amount of prepublication sharing in biology. “I share the preconception with many others in the field that the biological sciences have, up to now, been relatively circumspect in relation to prepublication disclosure at conferences or on preprints,” he says. “The study here suggests that this is not the case.”
Pulverer is impressed with the number of researchers in the survey. “It would be very useful to follow up with the same questionnaire in about five years when fields like biology have had time to embrace preprints more and when regions like Europe have had time to develop their open-access mandates,” he adds.
Energy-saving solid-state lighting and full colour displays have come along in leaps and bounds in recent years with materials that emit bright, pure colours. To create white light, we need red, green and blue sources, but blue light is the most challenging to produce. Indeed, it took researchers an extra two decades to create the first blue-light emitting diodes (LEDs) after red and green ones were made in the 1950s and 60s.
Efficient blue-light emitting materials for displays need not only to emit bright light, they also need to do this over a narrow wavelength range. Making such materials has proved to be no easy task, and even the purest and defect-free candidates, such as epitaxially-grown gallium nitride films, only manage to reach a maximum photoluminescence quantum yield (PLQY) of less than 1%. This low value is due to rapid non-radiative recombination of charge carriers (electrons and holes) through surface and bulk defects (or traps) and a low radiative recombination rate associated with a small exciton (electron-hole pair) binding energy.
Although other materials, such as inorganic phosphors, fare much better when it comes to PLQYs, their insulating properties result in high turn-on voltages, which means that they cannot be used in LEDs. They unfortunately also emit spectrally broad light.
2D layered perovskites
Organic-inorganic hybrid perovskites could be the answer here. These materials are one of the most promising thin-film photovoltaics around today thanks to the fact that they can absorb light over a broad range of solar-spectrum wavelengths. Researchers led by Edward Sargent of the University of Toronto in Canada have been studying 2D layered perovskites with the composition R2PbBr4, where R stands for organic ammonium cations, Pb is lead and Br is bromine. Such perovskites boast fast radiative recombination rates (thanks to localized excitons) and a narrow light emission linewidth.
“In particular, we investigated the effect of electron-phonon interactions on the luminescence of single crystals of 2D perovskites,” explains team member and lead author of the study Xiwen Gong. “We found that reducing these interactions can lead to bright blue emission in these materials.” Phonons are quantized lattice vibrations that behave like particles.
The researchers studied the strength of electron-phonon coupling and how rigid the crystals were using several techniques, including deformation potential analysis, resonance Raman spectroscopy, single-crystal X-ray diffraction, neutron scattering and solid state nuclear magnetic resonance. The neutron studies were carried out at Oak Ridge National Laboratory.
PLQY of up to 79% and a linewidth of just 20 nm
The results reveal that the brightest emitters are those that are the most rigid. “By varying the molecular configuration of the ligands on the perovskite, we found that we can reach a PLQY of up to 79% and a linewidth of just 20 nm by controlling the crystal rigidity and electron-phonon interactions,” says Gong.
“The most rigid structure suppresses dynamic vibrations in the 2D perovskite crystals, which leads to decreased electron-phonon interactions,” Sargent tells Physics World. “This slows the electron band-edge to trap transition process, thereby increasing the brightness of the 2D perovskite emitter.
“Designing crystals structures with electron-phonon interactions in mind thus provides us with a previously unexplored way to improve the properties of optoelectronic materials,” he adds.
Barry Rand of Princeton University in the US says that the new work is an “impressive step forward. It shows that this class of layered perovskites has the capacity to host very high efficiency blue emission, a necessary milestone in their use in efficient LEDs. This is especially important as blue LEDs have lagged considerably behind the performance of red and green emitting devices.”
Sargent and colleagues, reporting their research in Nature Materials , worked with large single crystals with dimensions of millimetres in this work. They say they now plan to move to 100-nm-thick active materials so that they can indeed incorporate them into LED devices.
When I read scientific papers, I often end up pondering questions that are – in the grand scheme of things – mere footnotes and details. Quite simply, I lose sight of the big issues. Fortunately, one benefit of teaching physics to undergraduates, as I do, is that it lets me take a broader perspective. Take the way that textbooks deal with the fundamental differences between the states of matter. While these works contain neat and cohesive descriptions of gases and solids, many struggle with liquids.
Consider David Tabor’s classic book Gases, Liquids and Solids, which has been reprinted many times since it was first published in 1969. “The main characteristics of [the gaseous and solid states] are well understood,” Tabor writes. “By contrast the liquid state, in some ways, has ‘no right to exist’ [and] raises a number of very difficult theoretical problems.” Then there’s Franz Mandl’s 1971 book Statistical Physics, in which he discusses the qualitative differences between liquids and solids, but then throws in a disclaimer that his argument is “not accepted by everyone”.
As we can see, scientists’ confusion regarding the description of the liquid state has been bubbling beneath the surface for decades. But if you think we have a problem understanding liquids, the situation is even worse with the “supercritical fluid” state, which I’ll come to later. However, recent advances mean we could resolve these problems and provide theoretical descriptions of both the liquid and supercritical fluid states over the wide range of pressures and temperatures that they exist across.
Liquids – what a gas!
While some physicists have tried to describe the liquid state directly from first principles – that is to say, without referring to the solid or gas states – this approach is very difficult. In a crystalline solid, the high level of order makes calculations and computations relatively easy. In a gas, the lack of any structural order is used to simplify calculations and computation instead. However, to fully understand the liquid and supercritical fluid states, neither option can be used. Instead, what researchers usually do is to use gases as a starting point and make some adjustments.
One way to do this is to wheel out the Van der Waals equation of state. In this approach, a sample is described as a non-ideal gas, in which the particles have a specific size (rather than being infinitely small point masses) and there is an attractive Van der Waals force between them. By applying this equation to liquids, you can understand boiling as a “first-order” phase transition, which means that as it turns from liquid to gas, there is a discontinuous (rather than smooth) jump in the material’s properties, such as its density, heat capacity and entropy.
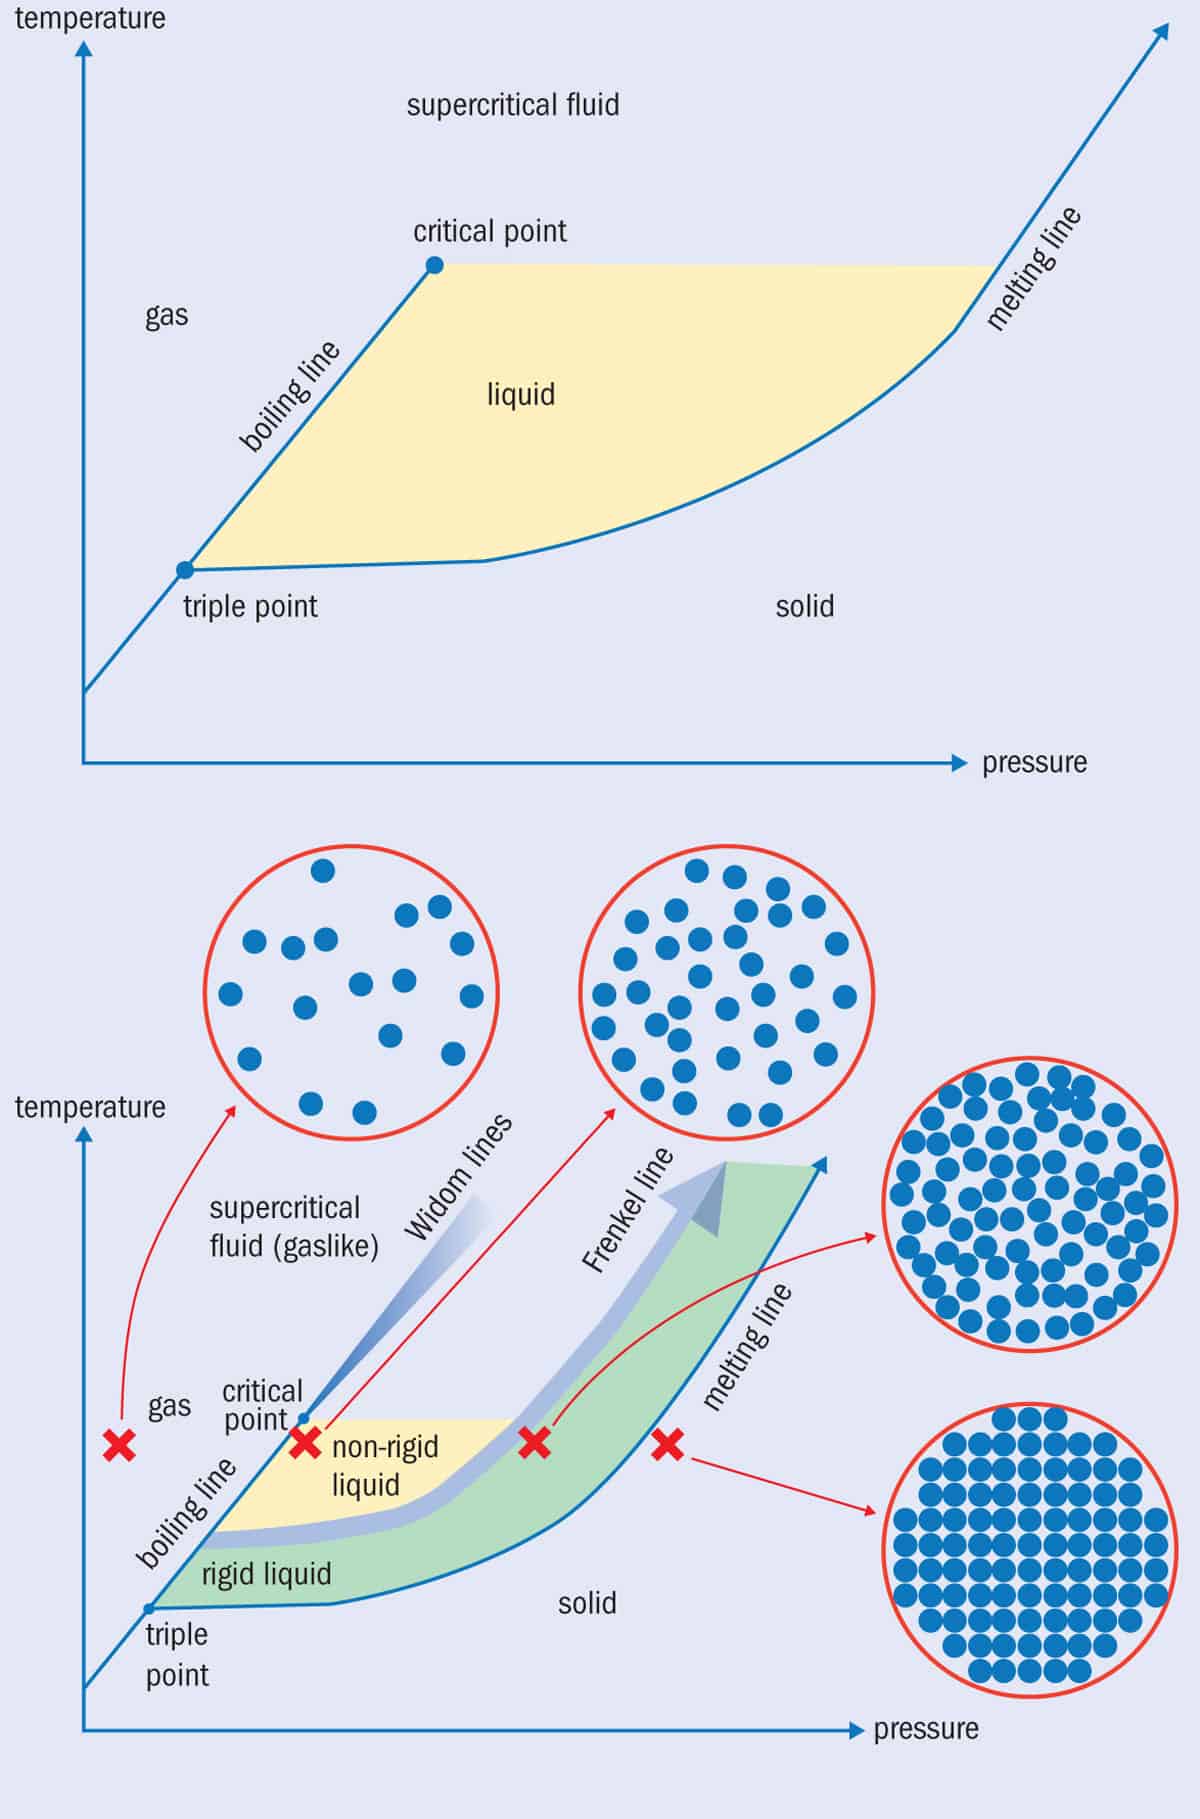
1 Beyond the textbook.
However, physicists are not interested only in what happens to a liquid at a single pressure. If you raise the pressure, the boiling temperature goes up too, with the line dividing the two states of matter on a temperature/pressure graph being known as the “boiling line” (figure 1a). What’s interesting is that as you go up in pressure, the jump in the liquid’s density, heat capacity and entropy as it boils becomes steadily smaller. Eventually, when the pressure is sufficiently high, a “critical point” is reached, beyond which there is no boiling transition at all. With no phase transition between liquid and gas states, the sample is now a supercritical fluid, a still-mysterious phase that shares properties of both a liquid and a gas.
Most textbooks leave liquids and supercritical fluids at that; but the supercritical fluid state has a complexity that physicists are only now starting to appreciate. For starters, parameters such as density, which usually change abruptly and discontinuously when we cross the boiling line, do something different if we make a transition above (albeit close to) the critical point. They still change over a narrow range of pressure or temperature but now do so continuously, not in a jump.
What this means is that the boiling line can now be extended beyond the critical point, where it is dubbed the “Widom line”, in honour of the Cornell University chemist Benjamin Widom (figure 1b). Indeed, we can plot out separate Widom lines for all the different properties that change when we boil a liquid, including its density, speed of sound and heat capacity. The Widom line links the different pressure-temperature points where there is a narrow change in each property. They start at the critical point but gradually diverge from each other and get smeared out.
Interestingly, if we increase the pressure on a liquid or supercritical fluid at a fixed temperature the sample always eventually solidifies. Nitrogen, for example, becomes a solid at room temperature if you squeeze it to about 24,000 bars pressure (2.4 × 10⁹ N/m2). Even hydrogen solidifies at room temperature if you take it to 55,000 bars. Using modern equipment, such as the diamond anvil cell, these kinds of experiments are routine; we really can take air from the atmosphere and freeze it solid.
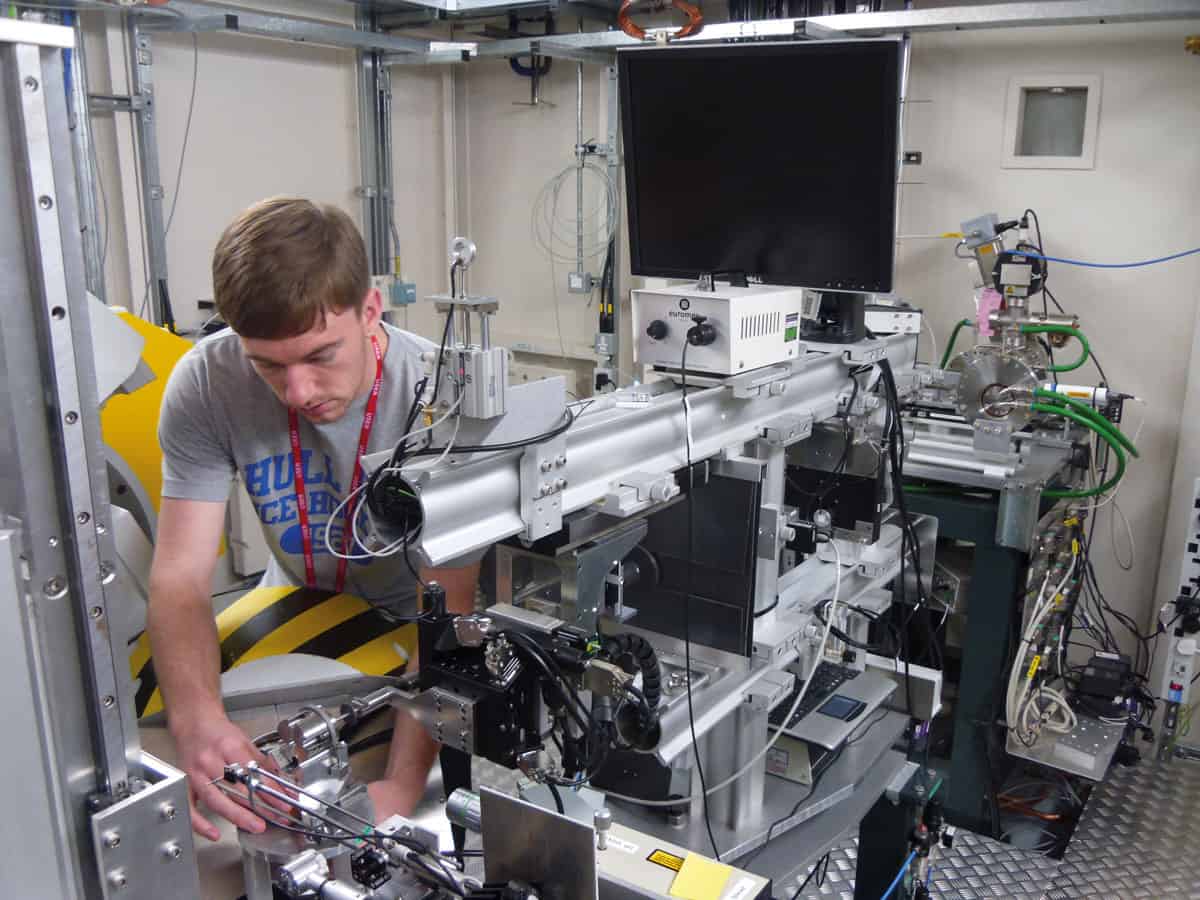
The pressure mounts: Liquids can be routinely squeezed to high pressures using a diamond anvil cell. (Courtesy: John Proctor)
But the problem is that long before it solidifies, the fluid becomes so dense that we can no longer describe it as being similar to a gas. For instance, in dense molecular fluids, such as water, neighbouring molecules will slot together in an ordered manner over short distances almost exactly like they do in solids. What’s more, a variety of experiments dating back to the 1960s have shown that dense fluids support shear waves. Both types of behaviour are totally different to what is observed in gases and in liquids near the critical point.
A solid start
As it is hard to describe these kinds of liquids and fluids by starting off with the behaviour of a gas, some physicists have instead tried to liken them to solids. Various theoretical descriptions of this ilk have been put forward over the decades or, if you include Maxwell’s work, over the centuries. Based on this solid-based approach, researchers have recently been able to model properties of dense fluids, discovering that they take on certain solid-like properties as you raise the pressure (P) or lower the temperature (T). Surprisingly, the onset of these properties occurs within a relatively narrow P–T range.
This narrow P–T range has been named the “Frenkel line” (figure 1b) after the Soviet physicist Yakov Ilyich Frenkel (1894–1952), who pioneered the solid-like theoretical approach to liquids. But what do we know about liquids beyond the Frenkel line? At the critical point, there is just enough room to squeeze in an additional particle in-between two adjacent particles. But when the Frenkel line is crossed, experiments show that the liquid takes on a relatively close-packed structure and has a density not much less than that of a solid.
2 Unexpected behaviour.
The Frenkel line at the critical temperature is therefore crossed at a much higher pressure than the critical pressure (figure 2). And as well as extending into the supercritical region at high temperature, the line should continue below the critical temperature and can in fact pass underneath the critical point. On the high-pressure side of the Frenkel line, it turns out that the sample is so stiff that some (though not all) shear waves can pass through such that it’s now termed a “rigid liquid”. As you heat the fluid, it takes more and more pressure to force it into the rigid-liquid state but you can still liquefy it far beyond the critical temperature. That to me is amazing: a liquid can exist at far higher temperatures than we previously believed. Indeed, the only reason for the Frenkel line to end is when the sample becomes so hot it turns into a plasma instead.
As for what happens on the low-pressure side of the Frenkel line, the liquid is in a more conventional, textbook-like non-rigid state. Some researchers claim that the non-rigid liquid state can also persist above the critical temperature, albeit not to such high temperature as the rigid liquid state. After all, the Widom line is simply the thermodynamic continuation of the boiling line. However, in my view – which, to quote Mandl, is not accepted by everyone – there are two flaws with this argument.
First, some properties, such as density, change as you cross the Widom line in a way that is qualitatively similar to what happens when you cross the boiling line. But other properties, such as heat capacity, change in a qualitatively different way in the two cases due to the complex and unique nature of fluids near the critical point. So the changes we make to the fluid when we increase pressure across the boiling line beneath the critical point into the non-rigid liquid state are not the same as the changes we make to the fluid when we increase pressure to cross the Widom line above the critical point.
The other reason I am not convinced that the non-rigid liquid state can persist above the critical temperature is the amount of thermal energy the particles have. Most particles have enough thermal energy to escape the attractive forces binding them to their neighbours. That’s why we call the sample a supercritical fluid rather than a liquid. The only way you can liquefy a supercritical fluid above the critical temperature is to make the sample so dense that there’s nowhere for the component particles to escape to. That means crossing the Frenkel line, not the Widom line.
Controversial claims
While researchers may argue about the significance of the Widom line, and how far it extends from the critical point, there is no dispute that it exists. That’s because the properties of fluids near the critical point have been studied in detail for decades due to their industrial importance in applications such as power generation, food processing and refrigeration. Those studies culminated in an online database of fluid properties, held by the US National Institute of Standards and Technology.
The Frenkel line, on the other hand, is a newer and more controversial concept. While experiments have shown that dense fluids and liquids can exhibit solid-like properties, such as being able to support shear waves, there have been very few systematic studies of how suddenly these properties pop up. In fact, we’re not even sure if they appear over a narrow enough range of pressures and temperatures to justify calling it a Frenkel “line”.
Recently, however, researchers at the University of Köln in Germany led by Clemens Prescher have studied how X-rays diffract when fired into fluid neon at ambient temperature, which is so far beyond the critical point of neon that only the Frenkel line could be reasonably expected to cause any narrow crossover in fluid properties (Phys. Rev. B 95 134114). They found that medium-range order (a characteristic expected for dense fluids on the high-pressure side of the Frenkel line) appeared rather abruptly, proposing that there was a sufficiently sudden change in properties to justify calling the transition the “Frenkel line”.
Meanwhile, my colleagues and I at the University of Salford were carrying out experiments in our own lab when we found something extraordinary. You don’t get many “Eureka!” moments in science, but this was one of them. We were working late into the evening – don’t tell the health-and-safety people – studying methane using optical spectroscopy. We were far above its critical temperature when we dropped the pressure to see what would happen. To our astonishment, we found that the vibrational frequency and other spectral characteristics changed abruptly.
The properties went from those expected from a rigid liquid (dominated by the repulsion between particles that have been forced far closer together than their equilibrium separation) to those expected from a gas-like sample (where attractive Van der Waals forces between particles dominate). These drastic changes indicated that we had crossed the Frenkel line and gone from the rigid liquid state and into the gas state. Then the computer crashed. We’d lost our data. Fortunately, we were able to repeat the experiment and confirm our finding (Phys. Rev. E96 052113).
These investigations will continue – not least because the applications of this research are so exciting. For example, if a liquid or fluid can support shear waves – as Frenkel’s solid-like description of the liquid and dense-fluid states suggests – then the sample has an additional way for it to store heat. This may sound mundane, but it is crucial if we are to understand how heat is stored in the planets Jupiter, Saturn, Uranus and Neptune. In recent years researchers have used Frenkel’s theoretical framework to accurately model the observed trends in fluid heat capacity as pressure and temperature are changed.
Frenkel proposed that dense liquids are a relatively close-packed structure in which, most of the time, particles oscillate around a certain equilibrium position. However, he added, a particle can occasionally swap places with an adjacent particle or hole. Physicists have proposed that the average time a particle spends in an equilibrium position between jumps – known as the “liquid relaxation time” – corresponds to the maximum period of a shear wave that can be supported by the fluid. This time will vary a lot with temperature and we can model the observed heat capacities of fluids by accounting for this. It turns out that when we turn up the temperature, the liquid relaxation time falls. In other words, the liquid can support fewer shear waves as it gets hotter and the heat capacity falls. In fact, the specific definition of the Frenkel line is that it is crossed on temperature increase when the liquid relaxation time becomes so low that no shear waves can pass through the fluid.
Another application of this work is to do with how fluids mix. Gases are always miscible, whereas liquids are miscible only in certain cases. Their behaviour in this regard is therefore more like solids given that only certain combinations of elements will form solid solutions (single-phase alloys). What we now want to explore is miscibility throughout the supercritical fluid phase: does the Frenkel line affect miscibility of fluids? This is not just exciting terra incognita in terms of basic physics, but could also be the most important consequence of the Frenkel line in planetary science. After all, Jupiter, Saturn and the other outer planets are diverse mixtures of different fluids and no-one really knows how well they mix together.
Before we get too excited about the future prospects for this research, I should point out that generating and measuring the required conditions is experimentally challenging. The pressures are beyond the reach of gas compressors and large-volume cells, but too low for the diamond-anvil cell, which struggles to even measure the required pressures. These problems get worse at high temperatures.
However, the most important point for me about the current situation is just how little we really understand about liquids. In the last five years, scientists have argued openly in the literature about how we define the liquid state and under what conditions we consider a sample to be in the liquid state (see, for example, J. Phys. Chem. Lett.8 4995 and Physica A478 205). The fact that the answers to these basic questions are still up for debate is, to me, extremely exciting. But once we get answers, it will – I hope – be a chance to rewrite the textbooks.
The US’s dominance in scooping Nobel prizes for work in the natural sciences could be nearing an end, according to a new analysis of previous winners. Carried out by physicist Claudius Gros from the Goethe University in Frankfurt, Germany, it also finds that the UK has won the most Nobel prizes per capita, with Germany coming second and the US a close third (R. Soc. Open Sci.5 180167).
Since they were first awarded in 1901, scientists who are nationals of the US, the UK, Germany and France have won the most Nobel prizes in physics, chemistry, and physiology or medicine. Around 120 laureates have been American, 40 British, 40 German and 20 French. To determine Nobel-prize productivity, however, Gros factored out population size, particularly given that the US population has more than quadrupled from 76 million in 1901 to 327 million today.
On a per capita basis, the US’s era is definitively coming to an end
Claudius Gros
Gros found that the US’s productivity peaked in 1972 at 0.83 Nobel prizes per year and per 100 million inhabitants. He says that the most striking element of the US data is the continued downward trend. Since 1972 its success rate has fallen by 60% to 0.34 Nobel prizes per year and per 100 million inhabitants, and it is still dropping. “On a per capita basis, the US’s era is definitively coming to an end,” Gros told Physics World. “Within 12 years the US science Nobel prizes productivity should fall by another 50%.”
Falling returns
Gros claims that the drop in the US’s productivity could be explained by falling interest in science – evidenced by decreasing number of US students in science PhD programmes and the increasing number of non-US faculties – or the county’s dominance in fields not covered by Nobel prizes. “It may be that the US realized that sciences like physics are mature research fields that have accumulated a vast body of knowledge,” says Gros. “That would imply that the return per dollar is falling and that it would make sense to invest into more promising fields, like artificial intelligence, where the US is leading.”
As for the UK, it has maintained a very consistent rate of awards during the prize’s history – except for a brief dip in the mid-1990s – maintaining a success rate of around 0.98 science medals per year and per 100 million inhabitants. Germany and France’s Nobel prize success, meanwhile, is due to particularly productive periods when they won lots of prizes, especially in the early years of the prize. Since then both nations’ success rate has been fairly consistent and is currently 0.2 and 0.24 medals per year and per 100 million inhabitants, respectively. France’s low Nobel prize yield could be due to excellence in other areas. Gros points out that France has 12 Fields Medals – said to be mathematics closest analogue to a Nobel prize – compared to 13 for the US, and by far the highest per capita success rate.
Knots have been removed from DNA by stretching the molecular strands with an electric field. The work was done by researchers in the US, who have quantified how stretching causes a knot to move along DNA so that it vanishes when it reaches the end of the strand. The experiment also gives insights into how nanoscale knots can become jammed on a strand. Understanding how to untangle knots in molecular strands could improve DNA sequencing technologies and lead to better polymer-based industrial processes.
Ropes, earphone cables, necklaces and other strands can quickly become tangled into knots – a frustration of daily life that has fascinated physicists. The longer a strand, the more likely it is to get tangled – and the same principle applies to long chain molecules (polymers) including DNA.
Scientists are keen to understand knots on a molecular scale because tangling affects industrial polymers as well as biological processes involving DNA interactions. And the ability to unpick knots could aid a range of industrial and biomedical applications.
Knotty blockage
In biomedicine, for example, there is a push to achieve rapid sequencing of an individual’s genetic make-up and this is driving scientists to develop new techniques that read longer and longer sections of DNA. One promising method involves threading DNA through a nanochannel, but this channel would be blocked by knots in the DNA.
The motion of knots along molecular strands has been studied in great detail using computer simulations, however there have not been many experimental studies to date. A few experiments have detected knot movement, but quantifying knot mobility at the nanoscale has proved challenging. Now Patrick Doyle and colleagues at the Massachusetts Institute of Technology (MIT) in the US, have come up with a better way of characterizing knot mobility in the lab.
Using a special T-shaped microfluidic channel, the researchers stretch out a single DNA molecule and observe knot mobility using fluorescence microscopy. Their experiment begins by creating complex knots of different topologies in DNA by applying an alternating electric field to the strands. Then a divergent electric field is used to trap and stretch a knotted strand within the microfluidic channel.
DNA tug-of-war
The divergent electric field pulls on either end of the negatively charged phosphate backbone of DNA. “It kind of creates a tug-of-war on the DNA,” says Doyle. The electric field also drives knots towards the nearest end of a DNA strand, where they untie. The experiments confirm predictions from computer simulations that knots are able to diffuse along uniformly stretched chains.
“It’s one way to control the dynamics of knots in DNA,” says computational biophysicist Davide Marenduzzo at the University of Edinburgh, who hopes the technique can be developed to improve genomic technologies.
Computer simulations done by Doyle and colleagues suggest that knot mobility is mediated by “self-reptation”, which is a snake-like thermal motion observed in microscopic strands. The speed at which a knot diffuses along a strand is thought to be determined by a competition between deterministic and Brownian motion.
To find out how tension in the DNA affects mobility, the researchers increased the electric field, which boosts the “stretch” applied to the DNA. They found that increasing tension past a critical point slowed knot diffusion and at higher tensions, the knots began to jam.
In a jam
“This idea that you could jam molecular knots has been floated around since the 1970’s, but not really accepted because it was never experimentally proven,” says Doyle. “I think we have provided good proof now.”
Intramolecular friction between DNA atoms is thought to cause jamming, with increased tension pushing atoms into closer contact and preventing self-reptation within knots. Cristian Micheletti, professor of statistical and biological physics at the International School for Advanced Studies (SISSA) in Italy is excited about the potential of this technique. “It gives a unique opportunity to understand friction at the molecular level,” he says.
Both Micheletti and Marenduzzo are particularly eager to see an extension of this study to examine the mobility of different types of knots.
Doyle has a multitude of plans to use this microfluidic system to tease apart a number of knotty questions. But at the moment he is focused on a project for moving DNA through 20 nm holes, work that has potential to feed into the sequencing of long strands of DNA.
“The most crucial result of this work is the correlation between form and function in supercapacitor materials,” states first author Dina Ibrahim Abouelamaiem. She elaborates that “our research is driven by the need for a greener future and improved energy systems”, which is why their Sustainable Energy Fuels paper focuses on understanding how the 3D structure affects the supercapacitor properties of biocarbon-based materials derived from plant cellulose. These materials could provide an environmentally-friendly alternative to precious metals and toxic chemicals currently used in top-performing supercapacitors.
Powering the future
Supercapacitors are devices full of potential, often quite literally, as they are charged to exhibit high power densities and long lifetimes. Due to these properties, supercapacitors are able to bridge the gap in device performance between batteries and fuel cells. Understanding the nanostructure in depth and over multiple length scales is paramount to optimize performance and design better devices. By combining an extensive set of complementary techniques, Ibrahim and her colleagues have shed light on the complex synergy between structure and performance, and show what electrode materials really need a hierarchical porous network to function most effectively.
In their study, biocarbon electrodes activated using potassium hydroxide act as a model system, and the findings are also tested against commercial materials to demonstrate wider applicability. To form a complete picture of the materials the researchers exploited a range of characterization methodologies, such as SEM (scanning electron microscopy), BET (Brunauer-Emmett-Teller theory for nitrogen adsorption), XPS (X-ray photoelectron spectroscopy), and X-ray CT (X-ray computed tomography). This long list of techniques (and associated large number of acronyms) covers a wide range of length scales, which means the researchers were able to analyse nano-, micro-, meso- and macro-pores altogether.
According to Ibrahim, it was the large suite of techniques available from the Electrochemical Innovation Lab (EIL), which is located in UCL’s Department of Chemical Engineering, that allowed the researchers to plug the gap in understanding structure function relationships in supercapacitor devices.
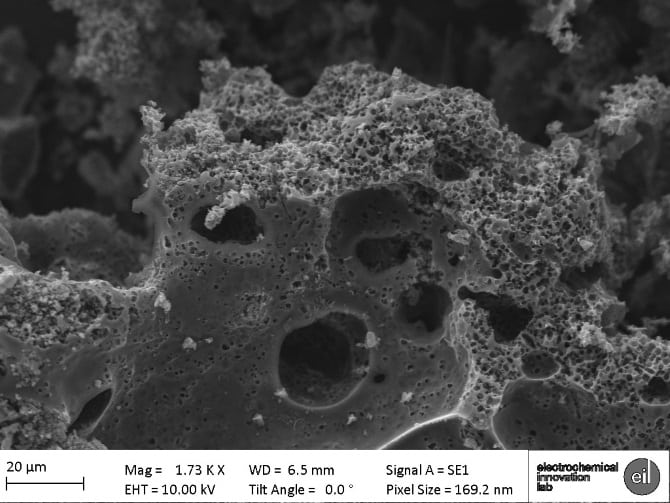
A mixture of pore sizes is needed to optimize biocarbon materials for supercapacitors. (Photo credit: Dina Ibrahim Abouelamaeim)
Within the pores of a supercapacitor
Results show that an increase in performance of materials is seen with a mixture of pore sizes nestled within one another, forming a hierarchical structure. The measurements reveal a direct correlation between high specific surface area and low cell resistance, which leads to a high specific capacitance. The team tested the performance of the supercapacitors using varied electrochemical set-ups and over extended operating cycles to demonstrate the lifetime performance and stability of the materials. These findings set the scene for more efficient and higher performing energy storage devices in the near future.
Full details of the research are reported in issue 4 of Sustainable Energy Fuels 10.1039/C7SE00519A.
X-ray mammography is the standard modality used to screen for early signs of breast cancer., Superposition of tissue in 2D mammograms can, however, sometimes mask cancerous lesions. To improve lesion visibility, some early adopters have begun to use digital breast tomosynthesis (DBT) alongside mammography. But before its adoption in routine breast screening, DBT requires thorough evaluation under clinically relevant conditions.
“We have developed a set of validated tools that allow us to model the key processes of X-ray breast imaging and produce simulated digital mammograms and DBT images,” explained first author Premkumar Elangovan. “One of the advantages is that we can insert simulated cancers into simulated breast models under a variety of conditions. This allows us to explore a range of tightly controlled imaging conditions that would be difficult to replicate in a clinical trial involving human subjects.”
Detection tasks
Elangovan and colleagues created 2D mammography and DBT projection images of virtual breast phantoms containing uniform spherical targets or solid masses with irregular margins. The targets had diameters of 4 or 6 mm, approaching the minimum detectable lesion size found in breast screening, and were simulated with three different contrast levels.
Screenshots from a 4-alternative forced choice assessment.
To assess lesion detectability, they performed a 4-alternative forced choice (4-AFC) assessment, in which an observer is shown the target in isolation, plus four image quadrants, one of which contains the embedded target. For the DBT images, a scrollable stack of images mimics DBT viewing conditions. The observers then identify the quadrant that they think contains the target.
The study included 11 specialist (five medical physicists and six experienced clinical readers) and five non-specialist observers. For each observer group, imaging modality and target type, the researchers determined the threshold contrast at which observers made 90.7% correct decisions.
For the 4 mm irregular lesion, the combined threshold contrast for all observers was 6.9% for 2D-mammography and 2.1% for DBT. Similarly, for the 6 mm irregular lesion, the combined threshold contrast was 3.9% for mammography and 0.7% for DBT. DBT also had a lower threshold contrast for the spheres: 2.9% versus 5.3% for mammography, and 0.3% versus 2.2% for mammography, for 4 and 6 mm spheres, respectively. These results demonstrate the superiority of DBT for detecting subtle masses in complex breast structures.
The authors note, however, that a previous study indicated that microcalcifications were detected more reliably in mammography than DBT. They attribute this to the superior ability of 2D systems to detect point-like, high-contrast objects.
Both observer groups found spheres significantly easier to detect than irregular masses. For 2D imaging, the threshold contrast for 4 mm spheres was 1.3 times lower than for 4 mm masses. With 6 mm spheres, differences in contrast threshold were much lower for both mammography (×2) and DBT (×2.7) compared with irregular targets of similar size. The only exception was for 4 mm objects and DBT, where irregular masses were easier to detect.
This difference in threshold contrast between spheres and mass lesions is an important finding as it indicates that studies using only spherical targets may produce over-optimistic detection thresholds.
Are specialists required?
The researchers compared the detection performance of specialist and non-specialist observers, and found that they were generally comparable, with each group marginally outperforming the other in particular tasks.
“We wanted to establish if there were differences in the performance of different types of observers as it is often difficult to find sufficient clinical experts in the types of image assessment trials that we run,” Elangovan noted. “If the performance of non-specialist observers is comparable to specialists then we can conduct such studies at a much faster rate, or even crowd-source the studies to get better statistics.”
Non-specialists required longer reading times than specialists for 4 mm targets, but both had similar reading times for 6 mm targets. The non-specialists’ performance improved after they had seen more data, possibly indicating that increasing familiarity with the task led to faster decision speeds. This supports the use of non-specialists (with training) to supplement the typically limited pool of specialist observers for some tasks.
The researchers concluded that their study quantified the extent of DBT’s superiority over 2D-mammography for detecting masses, as demonstrated by two to eight times lower contrast thresholds. “The results feed into our aim of optimizing how best to use X-ray imaging technology for breast cancer screening and, in particular, how tomosynthesis might be used routinely,” said Elangovan.
The team is now investigating the use of model observers as an alternative to human observers. “This will enable us to run evaluations and comparison studies using a fully simulated approach without time-consuming human observer studies,” Elangovan explained. “We are also studying how differences in the design of DBT systems affects cancer detection and how that in turn will affect the clinical outcomes of screening.”
Nobel laureates, business leaders and representatives from the arts, architecture, lighting and design are in Paris today to mark the inaugural International Day of Light (IDL). A ceremony is being held at the headquarters of the United Nations Educational, Scientific and Cultural Organization (UNESCO) that will see several senior scientists – including the 2017 Nobel laureate Kip Thorne and Khaled Toukan, director of the SESAME synchrotron in Jordan – give talks about the science of light and how it is used in culture.
The fact that UNESCO has proclaimed an International Day of Light is even more remarkable than the IYL, because it becomes a permanent annual fixture on the UNESCO calendar of observances
John Dudley
Following the success of the 2015 International Year of Light (IYL), which involved more than 13 000 activities taking place in 147 countries, UNESCO’s general conference gave its backing to the IDL on 7 November. “We saw during 2015 just how much enthusiasm there was in the science community for outreach, and the theme of light gives so much scope for many different activities,” says John Dudley an optical physicist from the University of Franche-Comte in France and chair of the IDL 2018 steering committee. “The fact that UNESCO has proclaimed an International Day of Light is even more remarkable than the IYL, because it becomes a permanent annual fixture on the UNESCO calendar of observances.”
The day aims to provide “an annual focal point for the appreciation of the role that light plays in the lives of the citizens of the world” with Dudley expecting hundreds of other events worldwide. “One thing I am very pleased about is that for the IDL we have established links with the UNESCO Schools Network that consists of 13,000 schools worldwide,” says Dudley. “I am very keen to see what they come up with – usually the best events are those that are unexpected, and the great thing about involving children in activities such as this is that they always surprise you.”