Extreme temperatures are a primary cause of death and disease worldwide, and heat extremes are projected to rise in many regions.
The research from the Red Cross Red Crescent Climate Centre and Columbia University (US), identified vulnerable areas of the world where the seasonality of these changes can be modelled and predicted, and where heatwave and cold weather plans could help mitigate the impact of those temperature extremes.
The study is published today in the journal Environmental Research Letters.
Lead author Erin Coughlan de Perez, from the Red Cross Red Crescent Climate Centre, said: “Extreme temperatures are one of the leading causes of death and disease in developed and developing countries, especially among infants and the elderly.
“Heat extremes are also on the rise in many regions. Heatwave plans and cold weather plans can reduce risk, and have been effectively used around the world. However, much of the world’s population is not yet protected by the early-warning systems that enable activation of heatwave protocols when a heatwave is imminent. That includes many data-scarce but highly vulnerable regions.”
The research team wanted to find out where prediction systems could reduce risk from temperature extremes on a global level. They examined long-term average occurrence of heatwaves and coldwaves; the seasonality of these extremes; and the short-term predictability of these extreme events three to 10 days in advance.
They used weather forecasting models from the European Centre for Medium-Range Weather Forecasts (ECMWF) and the National Oceanic and Atmospheric Administration. Data from the models was combined with population density estimates from the Centre for International Earth Science Information Network, to identify locations where humans are exposed to temperature hazards. This is the first study on predictability of heatwaves and coldwaves globally, and the first to combine these results with population density.
This enabled them to develop global maps showing the locations likely to benefit from the development of seasonal preparedness plans, and/or short-term early warning systems for extreme temperature.
Their findings showed that while almost the entire world experiences heatwaves – except for certain areas in the tropics – large areas of the world do not see sustained extreme cold.
Coughlan de Perez said: “We found a sizable percentage of the world’s inhabited areas – encompassing around five billion people – could benefit from heatwave and coldwave planning that covers seasonal preparedness as well as action based on shorter-term early warnings.
“Climate adaptation investments in these regions can take advantage of seasonality and predictability to help reduce risks to these vulnerable populations.”
“We have information coming at us at a rate that no human could possibly keep up with,” said Susan McLaughlin from IBM Watson Health. At the recent ESTRO 37 congress, speaking at a symposium hosted by Swedish radiotherapy specialist Elekta, McLaughlin explained that this data onslaught was IBM’s motivation for creating Watson for Oncology, an artificial intelligence (AI)-based clinical decision support system. The tool was developed in collaboration with the Memorial Sloan Kettering (MSK) Cancer Center, which provided training by expert clinicians using patient records and published guidelines. This was supplemented with millions of pages of text from over 300 research journals articles and 250 medical textbooks.
Earlier this year, Elekta announced a collaboration with IBM to offer Watson for Oncology within its digital cancer care systems, including integration into its widely used MOSAIQ oncology information system. “Joining forces with IBM Watson Health positions Elekta as the first radiation therapy company to offer capabilities that combine conventional health information systems with artificial intelligence and cognitive cloud computing,” said Richard Hausmann, Elekta’s CEO.
TF: What was Elekta’s motivation for collaborating with IBM Watson Health?
RH: Elekta has two product offerings, firstly the treatment solutions, which are the machines that deliver the dose and the associated software. On top of that is what I call a digitization level of healthcare, our MOSAIQ workflow software, which supports all data accumulation and storage of relevant data. MOSAIQ manages the patient from diagnosis through the whole therapeutic work-up, whether this is radiotherapy, chemotherapy, immunotherapy or surgery.
Within this digitized world, between diagnosis and treatment, there is typically a tumour board where experts come together to decide on the appropriate treatment for the patient. But in many cases, you don’t have all the experts available to do this effectively. Here, it makes sense to have a tool like Watson for Oncology.
So how does Watson for Oncology work with MOSAIQ?
Basically, all the patient’s information is input into Watson, both data from MOSAIQ and also from the diagnostic side, such as images, diagnoses, lab data – all the things that a tumour board typically sees. The data from the patient are then mirrored to the closest case at MSK, and Watson finds the most probable treatment that MSK would perform.
Elekta’s digital cancer care and its MOSAIQ oncology information system. Credit: Elekta
This is where the AI comes in – Watson also examines all of the studies that are relevant for this particular data set, and all of the publications in the field. It then creates probabilities of what would be the best therapy to use and provides a treatment recommendation – such as radiotherapy with a certain number of fractions, chemotherapy, radiation first to reduce the tumour size and so on.
Where will this technology be of most benefit?
This approach comes into play in situations where not all of the experts are in place, such as in developing countries where there can be a huge lack of oncologists, but still a huge need for treatments. Watson can extend the capabilities and knowledge of the few oncologists that there are, and increase access to care.
It also comes into the game for standardization of treatments in larger hospital chains or cancer centres, where variability of care can be significant. Here, the aim of using Watson is to create reproducible, standardized procedures. We see a huge application there as well.
Watson is really a workflow tool. Instead of having experts in place you can use the accumulated experience that was put into Watson and correlate this with your patient’s data set. Or you can use Watson as a control, if you have decided how best to treat, but want to check it against what MSK would have done.
Does Elekta plan to use Watson with its Monaco treatment planning system?
This collaboration is just starting – this is such a big area that we’ll do it step by step – but I’m sure we’ll get to the point where treatment planning forms part of it as well. To automate contouring for dose planning and dose calculation, for example, or to find organs-at-risk in images from the MR-linac, then these tools will get more and more important. And with every patient, the system learns – this is what deeper AI algorithms do. As well as improving quality, it will also make planning faster.
Elekta MOSAIQ colleagues and the IBM Watson Health delegation, including (far left) IBM’s Susan McLaughlin, at ESTRO 37.
Will this help with adaptive treatments, on the MR-linac for example?
In my view, in 10 years from now, there will be no planning scan at all. A patient will be diagnosed and then at every session on the MR-linac, there will be integrated segmentation, planning and execution, at a speed as fast as a pre-planned treatment today. It will happen, no question. And if you go to the next step, real-time adaption where you track moving parts of the body, then of course you will need the speed and automation of AI behind that.
How do you see the future of AI within oncology?
In Elekta’s business, we view AI, or deep learning, as a significant foundation for the future. One application, for example, is for tasks that we have to perform quickly and effectively, such as segmenting sensitive organs and the tumour itself. Automated tools can do this faster and more reproducibly than the human eye. It can be used for simpler things too, such as optimizing linac scheduling in case of unexpected events.
We also see AI as an important tool for improving our own products. Today, we choose which sensors to put into our systems and monitor these constantly. If a parameter changes, we conclude that we should perform preventative maintenance or exchange a part. I call this the “dipstick method” – you know what to look for, you make a sensor and you act on some parameters.
With AI, you could imagine a situation where you stream numerous data from a system, even things that you may not think relevant. With such a stream of data coming in, you can constantly evaluate correlations between those parameters and the status of the system. This would enable you to prepare to take action without even needing to know the actual physical correlation.
This seems to be a really interesting approach for preventative remote service. And since all our systems around the world are connected with our server, that is something that in principle can be implemented pretty soon.
Autism spectrum disorder (ASD) is a complex condition that’s challenging to diagnose, especially early in life. Now, US researchers have shown that electroencephalograms (EEGs), which measure brain electrical activity, can accurately predict or rule out ASD in infants as young as three months old (Scientific Reports8 6828).
“EEGs are low-cost, non-invasive and relatively easy to incorporate into well-baby check-ups,” said co-author Charles Nelson, director of the Laboratories of Cognitive Neuroscience at Boston Children’s Hospital. “Their reliability in predicting whether a child will develop autism raises the possibility of intervening very early, well before clear behavioural symptoms emerge. This could lead to better outcomes and perhaps even prevent some of the behaviours associated with ASD.”
The researchers examined EEG data from 99 infants considered at high risk for ASD (having an older sibling with the diagnosis) and 89 low-risk controls. EEGs were recorded from three until 36 months of age, by fitting a net containing 128 sensors over the babies’ scalps. All babies also underwent extensive behavioural evaluations with the Autism Diagnostic Observation Schedule (ADOS), an established clinical diagnostic tool.
The team used computational algorithms developed by first author William Bosl to analyse six EEG frequency bands (high gamma, gamma, beta, alpha, theta and delta). They computed nine nonlinear features for each of the frequency bands, to give as complete a characterization of the signal dynamics as possible. The algorithms predicted a clinical diagnosis of ASD with high specificity, sensitivity and positive predictive value, exceeding 95% at some ages.
“The results were stunning,” said Bosl. “Our predictive accuracy by nine months of age was nearly 100%. We were also able to predict ASD severity, as indicated by the ADOS calibrated severity score, with quite high reliability, also by nine months of age.”
Bosl believes that the early differences in signal complexity, drawing upon multiple aspects of brain activity, fit with the view that autism is a disorder that begins during the brain’s early development but can take different trajectories. In other words, an early predisposition to autism may be influenced by other factors along the way.
“We believe that infants who have an older sibling with autism may carry a genetic liability for developing autism,” said Nelson. “This increased risk, perhaps interacting with another genetic or environmental factor, leads some infants to develop autism – although clearly not all, since we know that four of five do not develop autism.”
Resting state BOLD SD drops at twilight (8 am and 8 pm). This is paralleled with improvements in visual detection ability. Reproduced from Nature Communications 10.1038/s41467-018-03660-8 under CC BY 4.0
Researchers from Goethe University, Germany, have used functional MRI (fMRI) measurements of the blood oxygen level dependent (BOLD) signal to investigate how activity in the visual cortex changes depending upon the time of day (Nature Communications 10.1038/s41467-018-03660-8).
Using resting-state fMRI, they discovered a drop in the standard deviation (SD) of the BOLD signal (producing a higher signal-to-noise ratio) at twilight, and between sunset and dusk. These results imply that the visual cortex endogenously becomes better at visual detection in low-light regimes. The authors suggest an anticipatory mechanism whereby visual detection improves according to the time of day.
Resting state and task scans
The researchers recorded resting state fMRI scans of 14 healthy males at 8 am, 11 am, 2 pm, 5 pm and 8 pm for two days. Nine of the participants also performed a visual detection task where they had to press a button once they saw an orange crosshair flashing for 500 ms on a screen.
BOLD SD dropped at 8 am and 8 pm, in visual, auditory and somatosensory cortices, as measured from the resting-state fMRI scan. The drop was between 17.9-25.8% compared with the SD at 2 pm, and occurred in the absence of any task, implying an endogenous modulation.
Participants performed the visual detection task during the same scanning session (at the same times of day as the resting state scan). While reaction time was consistent throughout the day, the number of times that a participant missed a stimulus (omission errors) followed the same daily pattern as the resting-state BOLD SD. This consistency between the task and resting scan shows a relationship between perception and behaviour.
Additionally, the researchers measured the task-based BOLD SD from the visual detection scans that showed a drop in SD at 8 am and 8 pm. Overall, the omission errors correlated positively with the SD in the visual cortex during rest and the visual detection task.
Lead author Lorenzo Cordani (left) and corresponding author Christian Kell.
Time of day modulation
The team concluded that there is a positive correlation between reduced visual cortex BOLD SD during twilight and improved visual detection. The important finding is that this occurs during resting state, indicating an endogenous, time-of-day dependency of visual cortex BOLD SD, perhaps to anticipate low-light regimes or close-to-threshold visual perception. Interestingly, the drop in BOLD SD was also found in somatosensory and auditory cortices, indicating a multisensory component to this phenomenon.
This work explores the relationship between the human diurnal cycle and BOLD signals, suggesting a likely endogenous increase in signal-to-noise ratio at times when our eyesight is hampered. This function was, perhaps, a crucial factor for survival prior to the introduction of electricity.
A new liver-on-a-chip made from natural collagen could offer a more realistic model for drug screening, as well as for the study of pathological diseases such as liver cancer and cirrhosis. The new device, which is made from self-assembled endothelial cells and two types of collagen in separate layers, remains bioactive for at least seven days.
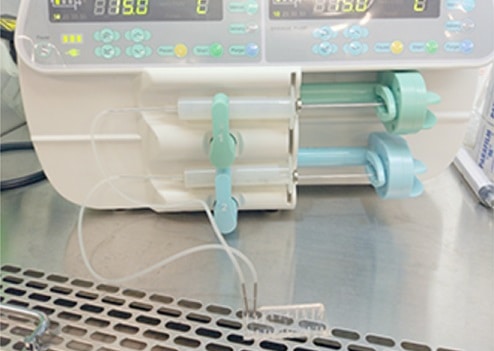
The system used to create the liver-on-a-chip.
One of the main reasons that new pharmaceuticals fail clinical trials is the damage they cause to the liver, which metabolizes all drugs ingested into the body. Researchers thus need to develop good in vitro models for evaluating the toxic effects that drugs can have on the liver, known as hepatoxicity. Conventional drug-screening techniques, such as animal testing, are time-consuming and costly, and can also be inaccurate.
A liver-on-a-chip offers an attractive alternative, thanks to its small size, precise architecture, and a controllable biomimetic physiological environment that allows scientists to carry out accelerated bioreactions. A research team led by Wei Sun of Tsinghua University in Shenzhen, China, has now fabricated a new device that more closely mimics the natural physiological environment of the liver, which should enable a more accurate assessment of hepatoxicity (Biofabrication10 025010).
Close to nature
The new device is designed to replicate the function of liver sinusoids, low-pressure vascular channels that mix oxygenated blood from the hepatic artery with nutrient-rich blood from the portal vein. These channels are flanked by plates of liver cells called hepatocytes, and the region between the endothelial lining of the sinusoid and the hepatocytes is called the “space of Disse”. Plasma from sinusoidal blood can flow almost unimpeded into this space, and the plasma that collects here flows back towards the portal tracts and then into the body’s lymphatic system.
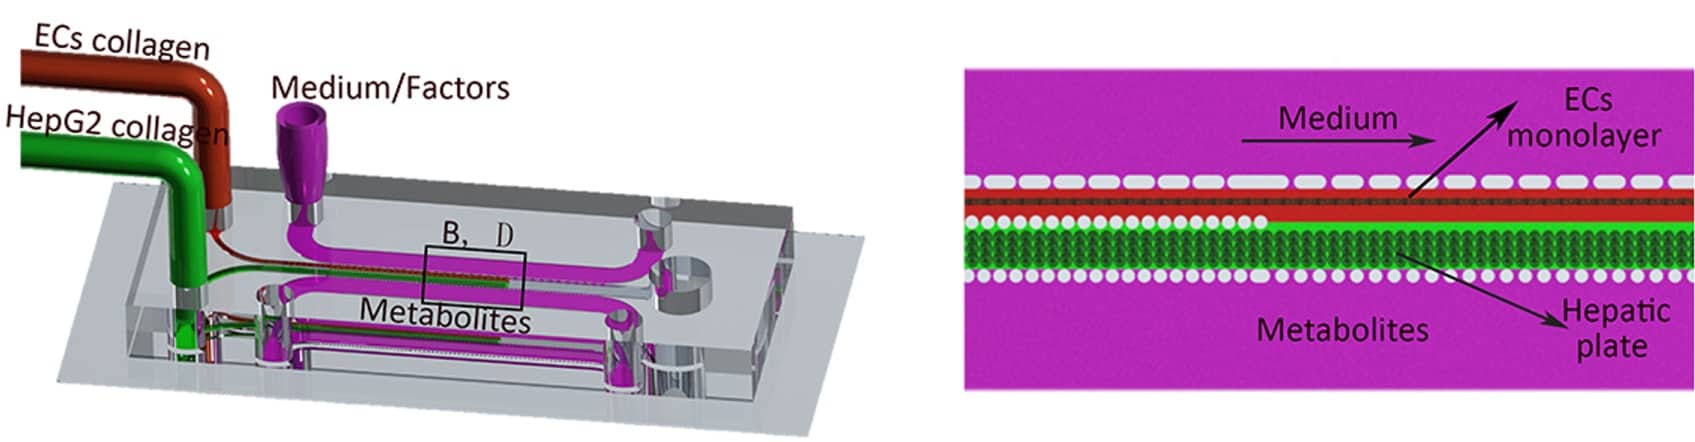
To make their liver-sinusoid model, Sun and colleagues first used standard soft lithography to fabricate a dimethylsiloxane (PDMS) chip with three chambers. Two kinds of natural collagen – one laden with hepatocytes and the other laden with endothelial cells (ECs) – were then simultaneously injected into two of the three chambers. By carefully controlling the flow rate, the researchers were able to form layers of cell-laden collagen with clear boundaries between the two types.
Stimulating self-assembly
“We then injected growth factors into the chamber next to the EC-laden collagen to stimulate the self-assembly of these endothelial cells,” explains team member Shengli Mi. “After roughly two days, the ECs in the collagen formed a monolayer – and this was our liver sinusoid on a chip.”
Creating the liver-sinusoid-on-a-chip.
Since the team’s model is made of natural collagen, it more closely mimics the biological environment in the human body – in which the collagen degrades slowly over time and is gradually replaced by the collagen produced from cells in the liver sinusoid. “This means that the reactions that occur in our device more closely resemble real biological reactions,” says Mi.
And that’s not all: the team also employed a passive micro-infusion pump rather than a traditional electric one to refresh the medium and to enable continuous nutrition exchange. According to Mi, this yields a cheaper device that’s also capable of high throughputs.
The researchers carried out basic quantitative measurements on the chip, such as cell viability, albumin secretion and urea synthesis, to test out its biomimetic function. “By comparing these functions with those in the presence of different concentrations of a hepatoxic drug like acetaminophen, for example, we could calculate how this drug affects the liver,” Mi told Physics World. “And by setting an allowable cell viability range or functional viability range, we could determine at which dose the drug was safe.”
Studying liver disease
Since cells migrate in the model, it can also be used to analyse the movement of cancer cells to or from the liver – which could help the study of liver diseases such as liver cirrhosis and cancer. The 3D self–assembly described in this study, which is published in the journal Biofabrication, might also come in useful for constructing different kinds of organs-on-a-chip.
The team says that it will now be focusing on designing improved passive pumps for its chip, which would allow longer periods of steady nutrition exchange. “What’s more, we will now also be designing a model with a greater variety of liver cells, such as hepatic satellite cells and Kupffer cells, and a more complex system-on-a-chip with biomimetic laminar structure and function for extended applications,” says Mi.
Read our special collection “Frontiers in biofabrication” to learn more about the latest advances in tissue engineering. This article is one of a series of reports highlighting high-impact research published in the IOP Publishing journal Biofabrication.
How did TRUMPF get involved in additive manufacturing?
We started working with additive manufacturing as early as the mid-1990s, when we experimented with using CO2 lasers for powder-type additive manufacturing. We then switched to solid-state lasers and developed a powder-bed additive manufacturing machine – where the laser creates new parts by building up layers from metal powder and fusing them together – that we introduced to the market in 2003. But unfortunately, the market was not ripe for it. People did not understand either the technology or the potential for it, and after three years without much success, we discontinued it.
In parallel, we continued offering powder-nozzle laser-based additive manufacturing, which is a different technique where the laser generates a weld pool on the component surface and powder is continuously added and melted onto it. But after a few years, we saw that the few customers we did have for our original powder-bed machine were really starting to understand its potential, and they began to approach us with requests to buy additional machines. That’s when we decided to restart this activity. Both types of manufacturing have their advantages and disadvantages. With the powder-bed design, for example, the surface quality and the overall part accuracy is much better, but the maximum part size is smaller and the productivity is lower because the process is slower by approximately a factor of five.
What did you learn from that first powder-bed machine?
We only sold 15 units over three years, and what was really discouraging was that the numbers were declining: the first year was the most successful year and it went down from there. We learned two things from that. One is that, obviously, you can be too early with the technology and the market. But we also learned that if you introduce a completely novel process for making parts, educating your users is important. We should have started by spending more effort on educating potential customers before trying to sell them a machine for $500,000 or $750,000.
What happened to make it possible to go ahead and produce those machines again?
A number of things. First is that advances in 3D computer-aided design systems gave people an ability to design intricate parts that simply wasn’t there before. Second, the experience with 3D printing plastic materials led people to understand that this technology has possibilities that can only be realized if you can do the same or similar processes in metal. And third, the powder-bed machines and processes became more productive and reliable than they were just after the turn of the millennium.
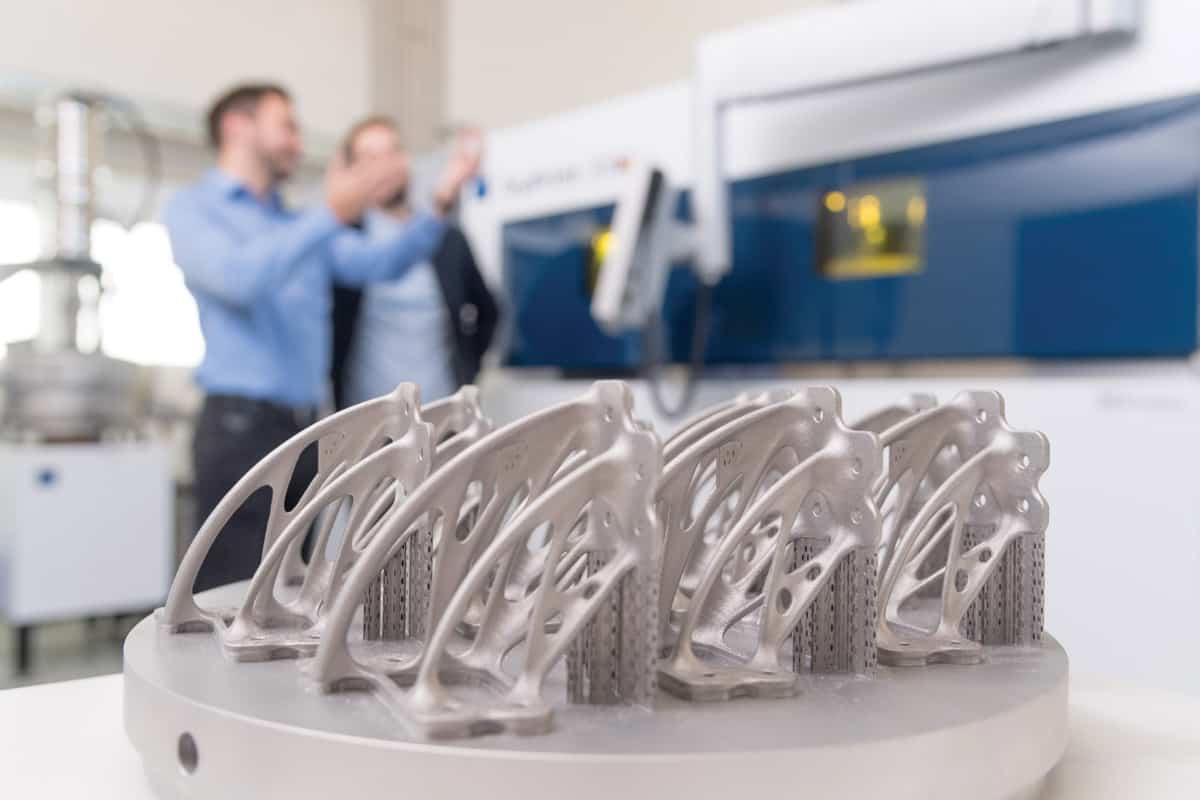
Fully formed: Metal parts made using powder-bed manufacturing. (Courtesy: TRUMPF)
Now that the sector is over that initial hump, there’s a lot of hype about additive manufacturing. What are the benefits and drawbacks of that?
One benefit is that because there is a lot of attention being paid to the field, there are a lot of players willing to invest. Another is that for this technology to develop further, a collaborative effort is required – it’s not sufficient for machine builders or powder producers to just focus on what they do in isolation – and the hype helps this collaborative effort. Finally, there is a market there where there wasn’t one before, and that helps the producers and developers of new machines to survive because they can generate sales revenues.
The drawbacks of the hype are the expectations created within the customer base. I think that a lot of CEOs read articles in mainstream media about 3D printing and ask their CTO: “Why aren’t we doing anything?” They have an expectation that within one, two or three years, introducing additive manufacturing will bring about real benefits for the company’s bottom line, but in reality it probably won’t happen that fast. So there is a chance of disillusionment, and I’m concerned about that because it could throw a lot of good players out of the market because they wouldn’t survive a “valley of death” – but that is speculation.
How do you avoid that disillusionment? You talked about education.
At my own company, I spend a lot of time trying to manage expectations about how fast and how big our additive manufacturing business can grow. But yes, I do think it’s important to talk to customers and explain to them what they can expect and how much they need to invest in educating their own staff if they want to be able to reap the benefits. The field of additive manufacturing is growing up, but right now, it has essentially reached puberty. I mention this because I have four children and at least two of them are in puberty right now, so I can see that it’s a wonderful age – they get very enthusiastic very quickly. But they are also a bit too enthusiastic sometimes, and then they get very frustrated at other times.
There is a chance of disillusionment, and I’m concerned about that because it could throw a lot of good players out of the market
What’s your current wish list for improvements or innovations in this field?
I think the robustness of the additive manufacturing process must be improved, and that can be done through intelligent sensing and good use of the data generated through those sensors. If we can learn from things that we see happening in the process and adjust the machines accordingly, that would be very good because we have to be able to adapt to different powder qualities and climate conditions. At the moment, if the Sun shines in the afternoon, sometimes we get a different part quality than we did in the morning. I’m exaggerating a bit, but that’s what it’s like, and better sensing could help.
What about more fundamental advances, such as in materials science or laser optics?
Those are also important – for instance, it might be nice to expand the types of laser sources used, the available wavelengths and so on. However, we have to keep in mind that these processes take a long time. If we develop a new type of laser source for additive manufacturing, we’re talking five years from the beginning of the project until we see the first part being printed and in production, and that’s a long time. The most immediate problems to be solved are the robustness of the process. Once we have that, we can expand the field.
What developments do you expect to see in the next five years?
I expect to see a fragmentation of the market in terms of the processes used for individual parts. We will probably see more hybridization, where different types of additive manufacturing are used in combination with each other or with traditional subtractive techniques. There are a lot of new companies entering the field, and in the next few years we are going to see a learning process where the community will come to understand which technique is best for which type of part.
Using water to cool non-domestic air-conditioning systems could have reduced outside air temperatures by as much as 1.5°C during a heatwave in Hong Kong, researchers have found.
The study shows that water-cooled air-conditioning units are not only more energy-efficient, but also relieve the anthropogenic “urban heat island” effect, which sees cities have greater ambient temperatures than the countryside.
“We cannot ignore the effect of air-conditioning systems on the city environment,” said Yi Wang of the University of Hong Kong.
As air-conditioning units cool us indoors, they expel heat outdoors. The amount of heat displaced can be enough to increase outdoor air temperatures measurably, contributing to the urban heat island effect.
And of course, if it gets warmer outdoors, even more air conditioning is needed indoors.
Not all air-conditioning systems are the same, however. Many rely on air to cool their condensing units, but those that are more energy-efficient use water. One method of water-cooling is known as direct cooling; it involves seawater being fed into the buildings that house condensers. Another type is centrally piped, with a tall cooling tower where air ascends amid a water cascade.
Wong and colleagues wanted to explore how these water-cooled systems affect the urban heat island in Hong Kong, where a subtropical climate has led to air conditioning accounting for some 30% of electricity consumption. Using a meteorological model, the researchers investigated the impact on the heat island had non-domestic consumers used one of the two water-cooled systems, compared with the baseline case of air-cooling. The team performed the simulation for conditions matching 23-28 July 2016, when Hong Kong experienced extremely high temperatures.
The results suggested that, had water-cooled systems been used, outdoor air temperatures would have fallen by 0.5-0.8°C during the daytime, and as much as 1.5 °C between 7 and 8 pm. Wong believes this demonstrates the importance of exploring the effects of air conditioning beyond the immediate environments of the systems.
“Existing studies have concentrated much more on single-building energy-efficiency using new air-conditioning systems,” said Wong. “However, the climate within or around every building is connected to the overall city environment. A city has tens of thousands of buildings, [a] large number of streets and many other facilities, and the environment has impact on each individual building.”
The researchers now plan to extend their study by exploring the effect of air conditioning on urban air quality, and on temperatures in other parts of the world.
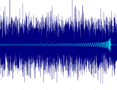
A deep-learning system that can sift gravitational wave signals from background noise has been created by physicists in the UK. Deep learning is a neural-inspired pattern recognition technique that has already been applied to image processing, speech recognition and medical diagnoses, among other things. Chris Messenger and colleagues at the University of Glasgow have shown that their system is as effective as conventional signal processing and has the potential to identify gravitational-wave signals much more quickly.
Gravitational waves are ripples in space-time that can be observed using the LIGO-Virgo detectors – which are laser interferometers with pairs of arms several kilometres long positioned at right angles to each other. As a wave passes through the Earth it very slightly stretches one arm while squeezing the other, before squeezing the first and stretching the second, and so on. This generates a series of tiny but distinctive oscillations that are recorded as variations in the interference patterns measured by the instruments.
The first gravitational wave to be detected was snared by the two LIGO detectors in the US in September 2015. Unlike signals observed since then, these oscillations were visible to the naked eye within the raw data. Normally gravitational-wave signals are swamped by noise – seismic, thermal motion or photon statistics – that must be filtered out using computer algorithms if the signal is to emerge.
Template matching
Usually signals are picked out from the noise using a technique known as matched filtering. This involves comparing the oscillations recorded by the interferometer with a series of templates representing waveforms produced by different astrophysicals event that are calculated using post-Newtonian and relativistic equations. A significant match between the observational data and any of the templates means a detection, while the type of waveform in the template reveals what caused the gravitational wave in question.
However, the need to compare large numbers of templates to ensure an accurate result means that matched filtering requires lots of processing power and is time-consuming. In the latest work, the team has shown they can potentially reduce the time needed – by using machine learning rather than conventional algorithms. Their system relies on a neural network, which, like the brain, consists of layers of processing units that fire when they receive a certain input.
The system’s input layer holds the raw data that would come from an interferometer – a series of numbers related to variations in the arms’ strain. These data are fed to the first of nine internal layers made up of neurons whose output depends on the input data and a weighting applied to each neuron. With those outputs then forming the inputs of the next layer, and so on, the system ends in a final layer consisting of just two neurons that each generate a probability value between 0 and 1. One neuron reveals how likely it is that the raw data contain a signal while the other, conversely, describes the likelihood of it containing just noise.
Training weights
Initially the neurons’ weights are set randomly and the system is “trained” by exposing it to a series of sample data sets, half of which consist of a gravitational-wave signal from binary black-hole mergers covered by “Gaussian” noise while the other half contain Gaussian noise only. The probability values computed by the system in each case are compared with the (known) data type – signal or noise – and the degree of error is then used to adjust the neuron weights layer by layer in a process called back propagation. The idea is that after enough iterations, the network can distinguish signal from noise reliably.
Having trained their system with half a million data sets, Messenger and co-workers then fed it 20,000 new waveforms to see how many it could correctly identify. They also analysed the same set of waveforms using matched filtering. They found that the two techniques performed nearly equally – their ability to find the buried signals depending in a very similar way on the signal-to-noise ratio and on the probability of mistaking noise for signal. However, because the bulk of computation for deep learning occurs during training, the new technique was far quicker – taking just a few seconds to analyse all the unknown waveforms rather than several hours.
According to Glasgow group member Hunter Gabbard, this greater speed might prove handy as interferometers become more sensitive and detect gravitational waves more often. This, he says, could help alert astronomers to signals from merging neutron stars so that they can point their telescopes to the patch of sky in question and pick up the accompanying electromagnetic radiation before it disappears.
Recognizing glitches
The Glasgow group, however, is not the only one to have applied artificial intelligence to gravitational-wave detection. In particular, Daniel George and Eliu Huerta of the University of Illinois in the US have already published two papers showing that deep learning can operate orders of magnitude faster than matched filtering. They have also used their neural network to estimate properties of gravitational-wave signals, such as the masses of radiating black holes, as well as analysing real, as opposed to simulated, LIGO data. Such data, they point out, can contain what are known as glitches – noise that can mimic a signal – as well as purely Gaussian noise.
Rory Smith of Monash University in Australia is slightly more cautious about the potential for deep learning. He says it “could one day show promise”, suggesting it might prove particularly useful for distinguishing astrophysical signals from glitches, but prefers to develop more physics-based “principled” approaches. “There’s still a lot of room to better understand the signals and data that we have without resorting to black-box techniques,” he argues.
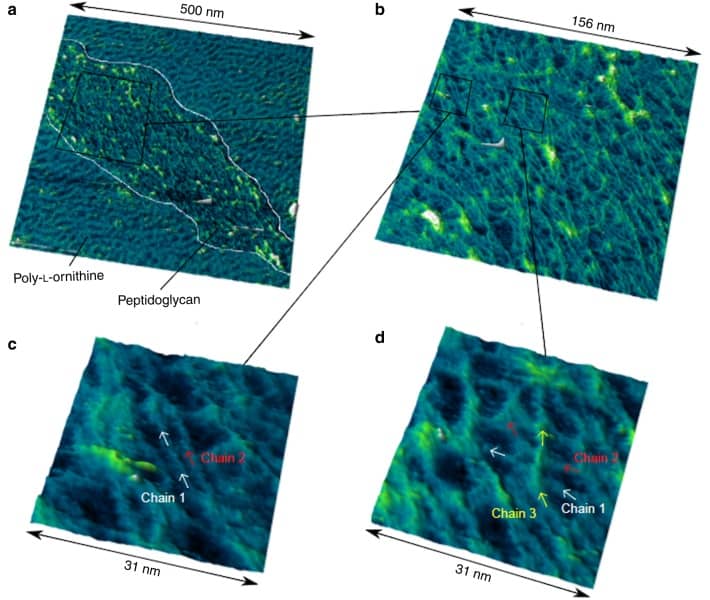
The biopolymer peptidoglycan that makes up bacterial cell walls was always assumed to be highly ordered. Textbook images like the one below have shaped our thinking. Robert Turner and his colleagues have now taken the first high-resolution images of the bacterial cell wall using atomic force microscopy (AFM), revealing that the polymer is much less ordered than previously thought. Additionally, the level of order changes with cell shape: in rod-shaped bacteria, polymer strands are somewhat ordered, while this order disappears when a round cell shape is induced (Nature Communications 10.1038/s41467-018-03551-y).
The team, from the research groups of Simon Foster and Jamie Hobbs at the University of Sheffield, isolated cell wall fragments and imaged them using AFM. This technique can take images at nanoscale resolution. In contrast to the textbook pictures, the images showed that peptidoglycan strands do not run exactly parallel and can even cross over one another. Analysis based on a Fourier Transform calculation showed that there is some order in the polymer, it is just not as high as assumed.
Atomic force microscopy shows individual peptidoglycan chains from bacterial cell walls are less ordered than expected. Reproduced from Nature Communications 10.1038/s41467-018-03551-y under CC BY 4.0
The fact that the polymer is less ordered than originally thought also opens up the possibility of answering another question: “How do bacteria interact with their outer membrane that lies beyond the cell wall?” Turner’s findings show that pores in the polymer could allow molecules to pass through the peptidoglycan wall and connect the inner and outer membranes. Further studies will need to confirm this hypothesis.
A long road to single-chain images
AFM works by recording the movement of a microscopically small cantilever tip scanning over a surface. The resulting image shows the topology of a surface much like the contour map of a mountain. Despite AFM being a powerful technique, Turner and his colleagues had to optimize the process to obtain images that resolve individual polymer strains. “After about a decade of looking at the bacterial cell wall with AFM, I managed to image individual molecular sugar chains,” Turner stated on Twitter.
Lead author Robert Turner achieved a breakthrough discovery when imaging individual peptidoglycan strands after 10 years of optimizing AFM and sample preparation.
Round cells are different
The authors investigated the length of polymers using a technique called size exclusion chromatography to separate fragments of different lengths. They found that the rod-shaped bacteria contained long strands of polymers.
When a round shape was induced in the same type of bacteria, by adding chemicals or making genetic changes, the polymer was disordered and contained shorter polymer chains. This might come as a surprise to some who thought that a round cell consisted of two cell poles stuck together. In such a case, the polymer strands would be oriented in a spindle like fashion, which was not observed in Turner’s experiments. It will be interesting to see how peptidoglycan is organized in bacteria that are naturally round.
This works lays the basis for bio-inspired nanostructures and improves knowledge regarding the bacterial cell wall, an important drug target for antibiotics.
New insights into why heat transfer between objects is enhanced at very short separations have been gleaned by Keunhan Park and colleagues at the University of Utah and University of Pittsburgh in the US. The team made exquisitely precise measurements of how heat moves between two quartz plates that are positioned just 200 nm apart. They found that energy transfer is enhanced by about 45 times at tiny separations, which they ascribe to the coupling of surface photon polaritons across the gap between the plates.
Normally, the heat transfer between two objects at different temperatures can be approximated by assuming that the objects are “black bodies”. These are ideal entities that absorb all radiation falling on them and emit thermal radiation according to Planck’s law. Physicists have known for some time that this breaks down when objects get to within a few hundred nanometres of each other, where they exchange heat much faster than predicted by the black-body approximation. Indeed, this “near-field” enhancement has already been used in some technologies including heat extraction and thermophotovoltaic systems.
However, more widespread use of the enhancement has been hampered by a poor understanding of the effect – which is a result of significant experimental difficulties in measuring heat transfer between objects separated by just a few hundred nanometres. These challenges include controlling unwanted heat flow and achieving precise control over the orientation and separation of the two objects.
Parallel lines
Now, Park and colleagues have measured radiative heat transfer between two macroscopic plates of quartz each measuring 5×5 mm and separated by a distance that they could vary between 200-1200 nm. A key feature of their experimental apparatus is that they can keep the plates parallel to within a fraction of a millidegree. Indeed, by varying the angle between the plates, they were able to show that heat transfer is extremely sensitive to how parallel the plates are – dropping off by 5% when the plates are misaligned by just 3 millidegrees.
As well as confirming that radiative heat transfer is enhanced over short distances, the experiments suggest that surface phonon polaritons are responsible for the boost. Phonons are particle-like acoustic excitations that occur in solids. Quartz is a polar crystal and this means that its phonons can generate oscillating electric fields. These fields can couple with photons at the surface of quartz to create surface phonon polaritons, which are photon-like excitations. Measurements reveal that the heat transfer is proportional to one over the square of the separation between the plates, which agrees with the theoretical calculations of how energy is transferred across the gap by surface plasmon polaritons.
Writing in Physical Review Letters, the team says that their technique could be used to measure the near-field thermal radiation properties of a range of different materials and structures.