Phase transition: illustration showing fluctuations between regions of two different local structures of liquid water
Water could exist in two different liquid phases with different densities. That is the conclusion of researchers in Sweden, Japan and Korea, who have used ultrafast X-ray scattering to measure the properties of supercooled water droplets.
Despite being the most ubiquitous and important liquid on Earth, water is a deeply puzzling substance with physical properties that deviate significantly from those of an idealized liquid. Several theories have been advanced to account for some of water’s idiosyncrasies, but experimental data have been lacking.
Solid ice is the most stable phase of water below 0° C, but the liquid phase remains metastable at sub-zero temperatures. Under normal circumstances, impurities such as dust particles provide nuclei around which ice crystals can form, so freezing occurs quickly. In the laboratory, however, it is relatively easy to supercool liquid water to well below 0° C by removing impurities. As the temperature goes down further, however, molecular motion slows and, below around -40° C, water molecules begin to form crystals around one another, allowing even pure water to crystallize very rapidly.
“No man’s land”
Many theories about liquid water predict a phase transition between a high-density liquid and a low-density liquid at low temperatures. However, this is expected to occur at temperatures and pressures deep inside the so-called “no man’s land” of the water phase diagram where experiments are very difficult to do.
In the new research, Anders Nilsson at Stockholm University and colleagues evaporatively cooled micrometre-scale water droplets by dispensing them into a vacuum. The droplets are then struck by femtosecond X-ray laser pulses, which determine the molecular structure of the water. The temperature that each droplet has reached when it is analyzed is determined by the distance that the droplet travels in the vacuum before it is struck by the X-ray pulse.
Ice crystals formed in many of the droplets, but the researchers identified these from their X-ray diffraction patterns and excluded such droplets from the analysis. By studying the diffraction patterns of the pure liquid droplets, the researchers measured how their compressibility varied with temperature, finding a maximum at around -44° C. A fluid becomes squishier when it is in fluctuating equilibrium between high-density and low-density phases. This is because an increase in pressure can be accommodated by some of the substance transforming from the low-density phase to the high-density phase. The researchers believe this compressibility maximum occurs around the crossover point, where liquid water comprises roughly equal proportions of high and low-density local structures.
At low pressures, this phase transition is not thought to be sharp. Instead, there should be tiny fluctuating regions of one phase within a much larger region of the other phase. If this model is correct, it could explain water’s anomalous properties under ambient conditions because, although water would mainly be in the high-density phase, there would be tiny, fluctuating bubbles of low-density liquid constantly moving around inside it.
Milk, oil and water
By fitting their experimental data to a theoretical model using molecular dynamics simulations, the researchers calculated that, at higher pressures, the crossover point between the two liquid phases would reduce in temperature. The length scale of the density fluctuations would also increase, reaching a “critical point” at a pressure of about 800 atm. “There the liquid would look like milk, because the fluctuations would have reached such a length scale that they would scatter visible light,” says Nilsson. At still higher pressures and lower temperatures, the researchers predict, the high and low-density phases would separate completely so that, at a particular, pressure-dependent temperature, “you would have two different liquids in a glass of water separated with a phase boundary – just like oil and water.”
Paola Gallo of the University of Roma Tre in Italy is impressed with the result. “This group succeeded in going beyond the limit of supercooling obtained before,” she says. “That means that in future we can go even further. There are fields in which it’s important to avoid crystallization: one of these, for example, is cryopreservation. In these cases, for example, solution can be of help, so knowing what is the exact density of water and what is the exact structure water assumes in the supercooled phase is very important.”
Alan Soper of the UK’s Rutherford Appleton Laboratory is intrigued but more sceptical. He notes that the inherent difficulty of measuring the temperature of the droplets makes drawing detailed conclusions difficult, and says the increase in compressibility the researchers record is tiny: “It’s just a very small increase in the scattering and it goes through some sort of maximum… It’s just as likely that it’s just going into the phase where it’s about to crystallize and the molecules are rearranging so they can form the crystal,” he says. “They’ve clearly seen something and it’s very interesting,” he concludes. “But what’s actually causing it is probably something we don’t have a straightforward answer to.”
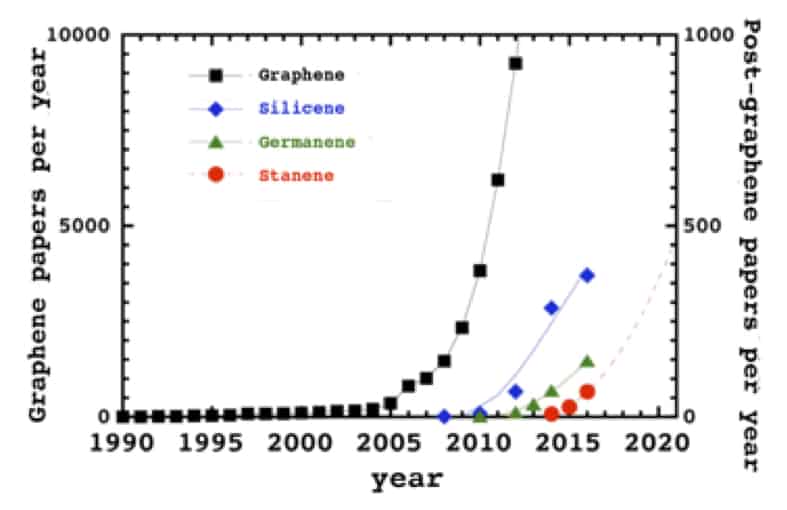
“Post-graphene” 2D materials are creating a flurry of interest in the research world at the moment because they are expected to have new and interesting electronics properties that might be exploited in next-generation devices. A team in Japan, Germany, Spain and France has now succeeded in experimentally synthesizing one such material, stanene, on a silver (111) substrate for the first time. The material, which is the tin analogue of graphene and the heaviest of its cousins, has strong spin-orbital coupling and is expected to be a robust 2D topological insulator with the quantum Hall spin effect, even above room temperature. These properties make it promising for nanoelectronics, spintronics and potential quantum computing applications.
In the last few years, researchers have made 2D materials like silicene, germanene, phosphorene and borophene on Ag(111), Au (111) and ZrB2(0001) substrates. Recent calculations showed that an Ag(111) surface could also be ideal for growing large-area high-quality monolayer stanene. A team led by Junji Yuhara of Nagoya University has now proved that this is indeed possible.
The researchers initially tried to prepare a stanene sheet directly onto a bulk-terminated Ag(111) but they found that the tin atoms chemically react with clean Ag(111) and form a 2D Ag2Sn surface alloy. They turned this problem to their advantage, however, when they discovered (thanks to both DFT calculations and experiments) that a stanene sheet could actually be synthesized onto the 2D Ag2Sn alloy.
Publications per year for graphene and post-graphene materials
“In fact, the Ag2Sn alloy appears to be one of the best substrates to form planar stanene thanks to its chemical and physical properties,” explains Yuhara. “It is typically chemically inert to stanene and there is perfect lattice matching between the planar stanene and the surface alloy.”
The researchers determined the crystalline structure of the stanene using scanning tunnelling microscopy, which is a highly surface-sensitive tool with a depth resolution of less than 0.01 nanometres (10 picometres). They found that the height of the Sn atoms in the stanene sheet varies by less than 5 pm and that the 2D material is also perfectly crystalline on the large scale. They backed up these findings with first-principles simulations of how 2D stanene behaves on an ordered Ag2Sn alloy, as well as with other experimental techniques like high-resolution synchrotron radiation photoemission spectroscopy.
Compatible with silicon technology
“As mentioned, stanene is the heaviest elemental cousin of graphene and thanks to its strong orbital-coupling and the fact that it is expected to be a robust 2D topological insulator, it might be ideal for spintronics applications and for making topological superconductors,” Yuhara tells nanotechweb.org. “And, last but not least, it is compatible with silicon technology, so stanene field-effect transistors might possibly be made using the same procedures used to realize the first silicene FETs.”
The team, which includes researchers from the Aichi Synchrotron Radiation Center, the Universidad del Pais Vasco in Bizkaia, the Max Planck Institute for the Structure and Dynamics and Matter in Hamburg and Aix-Marseille University, say that it is now busy characterizing the edge states in stanene. “We are also looking at how to detach the material we have made from its substrate so that we can characterize its electronic properties,” says Yuhara. “We will then be making plumbene, graphene’s lead cousin.”
Researchers at Harvard University in the US have made the first ultra-high-quality micro-ring and racetrack resonators from lithium niobate. The new devices, which consist of plasma-etched subwavelength waveguides that can propagate light across a metre-length path while losing only about half their optical power, have quality factors of up to 107. They might be used to make ultra-efficient integrated photonics circuits, in quantum photonics and optical communications.
Lithium niobate is used in a wide range of optical and microwave technologies thanks to its unique electro-optical properties that allow it to efficiently transform electronic signals into optical ones. Lithium niobate modulators, for example, are the workhorse of modern telecommunications and convert electronic data into optical information in fibre-optic cables.
There is a problem, however, with this material in that it is difficult to make high-quality small-scale devices out of it, which means that on-chip applications are simply not possible.
Plasma etching
A team of researchers led by Marko Loncar has now succeeded in overcoming this problem by fabricating ultra-high-Q lithium niobate micro-ring and racetrack resonators (with ultra-low loss and high optical confinement) for the first time by plasma etching these devices.
Researchers normally make optical microstructures using chemical or mechanical etching techniques. Lithium niobate is inert, however, so it cannot be chemically etched. Mechanical etching is also difficult given the hardness of the material.
Loncar and colleagues used standard Ar+ plasma etching to physically sculpt micro-resonators from lithium niobate films that were 600 nm thick and grown on a 2 micron-thick SiO2 wafer. The researchers had already successfully used this technique on diamond films in the past so knew that it worked for such hard materials. They etched a total of 350 nm of lithium niobate using a bias power of 112 W, leaving behind a 250 nm-thin lithium niobate slab. The integrated waveguide-coupled micro-ring and racetrack resonators they made have a bending radius of 80 microns and various “straight arm” lengths and waveguide widths.
Subwavelength waveguides propagate light across a metre-length path
The team measured the optical Q-factors of its devices using a tuneable telecom external cavity diode laser and found that they have propagation losses of less than 3 dB/m. This means that they can propagate light across a metre-length path while only losing about half their optical power. To compare, previous lithium niobate devices lost more than 99% over the same distance.
This new nanophotonic platform is a viable step forward for lithium niobate, say team members Mian Zhang and Cheng Wang. The fact that it has ultralow losses, high optical confinement and a tight bending radius and could be integrated with microwave electrodes bodes well for electro-optics and nonlinear optical systems. This opens up a wide range of applications, including ultralow-loss quantum photonics, coherent microwave-to-optical conversion and active topological photonics.
Since the lithium niobate device layer sits atop a standard silicon wafer, our platform might thus also be integrated with many existing photonics technologies, they add.
In basic and applied biology research, such as investigations of stem cells and drug screening, spheroid cell cultures are valuable, providing a more realistic test environment than the 2D cultures conventionally used. However, existing techniques for making cell spheroids lack reproducibility, have limited production yields and performance can vary with cell type.
Tackling this, researchers in Korea have developed a technique that generates high yields of spheroid cultures with reproducible shapes and sizes using “lab-on-a-CD” technology, also known as centrifugal microfluidics. The approach involves pumping cells outwards from the centre of a small disc into wells where they aggregate into spheroids. The researchers also used the technique to generate co-cultures containing two cell types in specific arrangements for the first time (Biofabrication9 045006).
Chung-Ang University researchers
“The rapid, reproducible formation of spheroids whose size we can control can contribute to accelerate biology and pharmacy research, especially cancer drug discovery,” said co-author Jung Chan Lee, who carried out the work with colleagues at Seoul National University and collaborators at Chung-Ang University, also in Seoul.
Spheroid creation
Cell spheroid manufacture is the first application of the well-established lab-on-a-CD technology in cell culture research. Already used for a variety of biomedical diagnostic tests including blood analysis and immunoassays, instrumentation is compact, relatively inexpensive and easy to use.
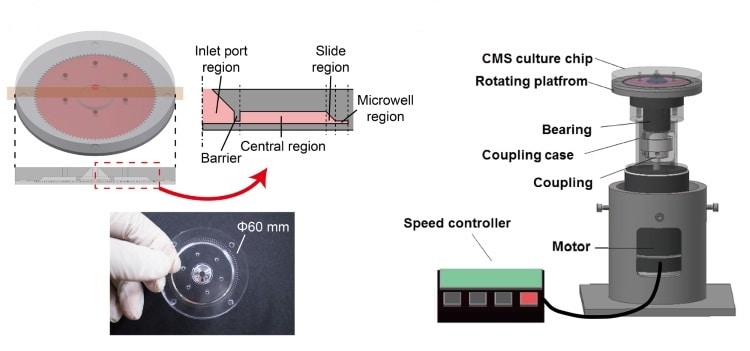
The new system comprises a 6-cm moulded silicone polymer disk on top of a rotating platform driven by a DC motor. The disk contains 100 radial channels measuring 1.4 x 1.5 x 16 mm, each of which feeds a cylindrical microwell 0.4 mm in diameter and 0.4 mm high.
Lab-on-a-CD generates 3D cell cultures
Suspensions of cells are injected through a port in the disk’s centre. Rotatable over a range of speeds, the platform subjects the cells to hypergravity with G-forces of 1-521 G. The centrifugal forces not only drive the cells into the wells and aggregate them into spheroids, but can also encourage cell proliferation.
Lee and co-authors used their system to create cell mono-cultures and co-cultures. They created batches of 100 spheroids at a time, measuring their shape and size using time lapse photography and fluorescence images. Cultures of human adipose-derived stem cells (hASC) and human lung fibroblasts (MRC-5) were created using the microfluidic approach and compared with those generated using conventional well plate-based spheroid (WPS) formation.
Overall, the new system performed better than the conventional method. It demonstrated, for example, a 100% production yield, meaning that significantly fewer cells are needed to generate a given number of spheroids.
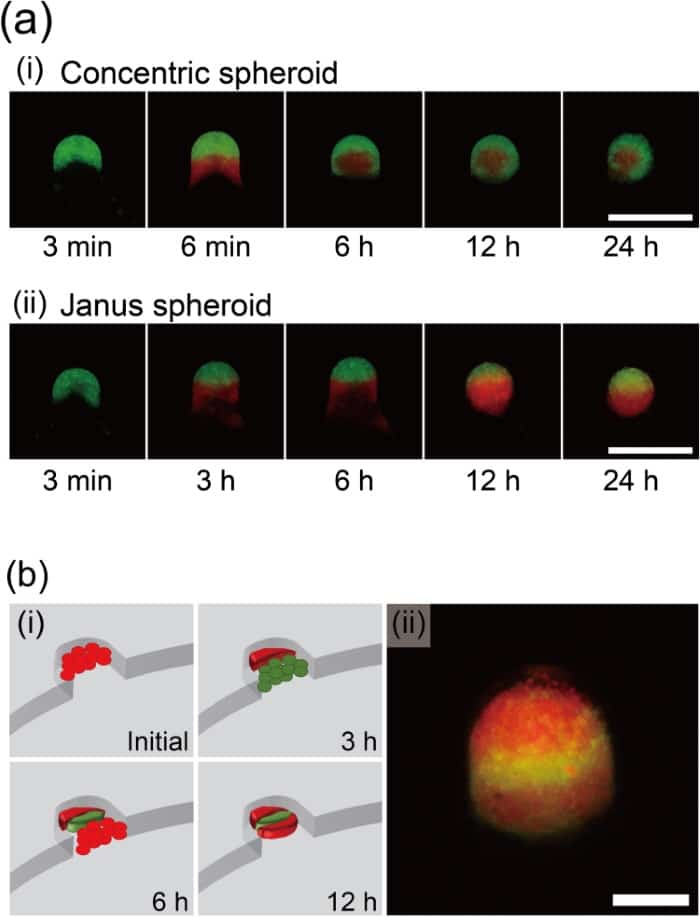
Various multicellular spheroid formations
Spheroid size was also significantly more consistent using the new technique, but only in spheroids generated at a higher 103 G-Force, suggesting that hypergravity is an important factor. Up to two days following formation, the spheroids were also more uniform in shape than those produced using the conventional method, indicated by smaller standard deviations in sphericity across the batch.
The researchers also successfully generated co-cultures with three spheroid arrangements: a spheroid of stem cells surrounded by a concentric shell of lung fibroblasts, a “Janus” arrangement of two hemispheroids and a sandwich of alternating cell layers. Each arrangement was created by the sequential addition of the different components to the disk at specific time intervals.
The concentric arrangement, for example, was made by injecting a suspension of one cell component, followed by the second three minutes later. At this point, centrifugal forces have driven the first set of cells into a U-shape. The second set of cells settles in this U for the outer layer to close around it.
In ongoing work, the researchers are seeking to further miniaturize their system, said joint first author Jiheum Park of Yale University, who worked on the system at Seoul National University. “One effort is to combine the system with wireless power transfer technology and eliminate the power line, which could be the possible source of incubator contamination,” Park told medicalphysicsweb. The researchers are also investigating the stacking of multiple disks to increase the throughput of the system by up to 100-fold.
A spallation neutron source has been used by physicists in Japan to search for possible violations of the inverse square law of gravity. By scattering neutrons off noble-gas nuclei, the researchers found no evidence of any deviation from the tried and tested formula. However, they could slightly reduce the wiggle room for any non-conventional interactions at distances of less than 0.1 nm, and are confident they can boost the sensitivity of their experiment over the next few months.
According to Newton’s law of universal gravitation, the gravitational force between two objects is proportional to each of their masses and inversely proportional to the square of the distance between them. This relationship can also be derived using general relativity, when the field involved is fairly weak and objects are travelling significantly slower than the speed of light. However, there are many speculative theories – some designed to provide a quantum description of gravity – that predict that the relationship breaks down at small distances.
Physicists have done a wide range of different experiments to look for such a deviation. These include torsion balances, which measure the tiny gravitational attraction between two masses suspended on a fibre and two fixed masses. However, this approach is limited by environmental noise such as seismic vibrations and even the effects of dust particles. As a result such experiments cannot probe gravity at very short distances, with the current limit being about 0.01 mm.
Scattered in all directions
Neutrons, on the other hand, can get down to the nanoscale and beyond. The idea is to fire a beam of neutrons at a gas and record how the neutrons are scattered by the constituent nuclei. In the absence of any new forces modifying gravity at short scales, the neutrons and nuclei essentially only interact via the strong force (neutrons being electrically neutral). But the strong force acts over extremely short distances – roughly the size of the nucleus, about 10–14 m – while the neutrons have a de Broglie wavelength of around 1 nm. The neutrons therefore perceive the nuclei as point sources and as such are scattered equally in all directions.
Any new force, however, would likely extend beyond the nucleus. If its range were comparable to the neutrons’ wavelength then those neutrons would be scattered more frequently in a forward direction than at other angles. Evidence of such a force, should it exist, can therefore be sought by firing in large numbers of neutrons and measuring the distribution of their scattering angles.
In 2008, Valery Nesvizhevsky of the Institut Laue-Langevin in France and colleagues looked for evidence of such forward scattering in data from previous neutron experiments. They ended up empty handed but could place new upper limits on the strength of any new forces, improving on the existing constraints for scales between 1 pm and 5 nm by several orders of magnitude. Those limits were then pushed back by about another order of magnitude two years ago, when Sachio Komamiya at the University of Tokyo and team scattered neutrons off atomic xenon at the HANARO research reactor at the Korean Atomic Energy Research Institute in South Korea.
Time of flight
In the new research, Tamaki Yoshioka of Kyushu University in Japan and colleagues use neutrons from a spallation source at the Japan Proton Accelerator Research Complex (J-PARC) in Tokai, which they fire at samples of xenon and helium. Because the J-PARC neutrons come in pulses, the researchers can easily measure their time of flight, and, from that, work out their velocity and hence their wavelength.
Armed with this information, the team can establish whether any forward scattering is due to a new force or simply caused by neutrons bouncing off larger objects in the gas, such as trace amounts of atmospheric gases. At any given wavelength, both types of scattering would be skewed in the forward direction and so would be indistinguishable from one another. But across a range of wavelengths different patterns would emerge. For atmospheric gases, the scattering angle would simply be proportional to the neutrons’ wavelength. In the case of a new force, on the other hand, the relationship would be more complex because the effective size of the nucleus would itself vary with neutron wavelength.
Reactors can also be used to generate pulses, by “chopping” a neutron beam. But that process severely limits the beam’s intensity. Taking advantage of the superior statistics at J-PARC, Yoshioka and colleagues were able to reduce the upper limit on any new forces below 0.1 nm by about an order of magnitude over the HANARO results – showing that their inherent strength can at most be 1024 times that of gravity’s (gravity being an exceptionally weak force).
Cost-effective search
That is still nowhere near the sensitivity of torsion balance searches at bigger scales – which can get down to the strength of gravity itself. As Nesvizhevsky points out, torsion balances use macroscopic masses with “Avogadro numbers” (1023) of atoms, whereas neutron scattering experiments involve at most a few tens of millions of neutrons. Nevertheless, he believes that the new line of research is well worth pursuing, pointing out that many theories positing additional gravity-like forces “predict forces in this range of observations”. Such experiments, he argues, represent “an extremely cost-effective way of looking for a new fundamental force” when compared to searches carried out in high-energy physics.
Spurred on by the prospect of discovery, Yoshioka and colleagues are currently taking more data. The lead author of a preprint on arXiv describing the latest research, Christopher Haddock of Nagoya University, says that they hope to have new results by the summer. A series of improvements to the experiment, including less scattering from the beam stop, he says, could boost sensitivity to new forces in the sub-nanometre range by up to a further order of magnitude and should also improve existing limits at distances of up to 10 nm.
It was almost over. There was only one week to go before the Advanced LIGO and Virgo detectors would complete their observational run, and be shutdown for a year. Indeed, many of my colleagues from the LIGO–Virgo team were already on vacation, while I was awaiting relatives who were visiting. Then my phone buzzed. An automated text message, which read “ALERT FROM GWHEN | New event: G298048 | Check your email!” prompted me to rush to my computer, to look at the signal in a LIGO database. When a flurry of agitated phone calls from collaborators followed, it became clear that a historic moment was unfolding. We observational astronomers needed to act quickly, and as our findings were still a secret, I couldn’t even tell my relatives, who had arrived in the middle of the excitement, why I would need to work.
On 17 August 2017 the LIGO detectors in Louisiana and Washington detected gravitational waves from the collision of two neutron stars – ultracompact dead stars that weigh as much as our Sun, but are barely 20 km in diameter, roughly the size of Manhattan. Such an event had been anticipated for decades, but had never been observed until now. Within two seconds of the arrival of gravitational waves at LIGO, NASA’s Fermi Gamma-ray Space Telescope detected a short gamma-ray burst. This made it even clearer: the gravitational-wave detection – dubbed GW170817 – was not a false alarm, and observatories across the globe quickly needed to turn towards the direction of the collision, or the data would be lost forever. More than 70 telescopes and observatories around the globe and in space were rapidly notified, and were able to execute a co-ordinated survey of the merger and its aftermath, across the full electromagnetic spectrum – gamma-rays, X-rays, light, radio waves – and neutrinos. A new era in multimessenger astronomy had begun (figure 1).
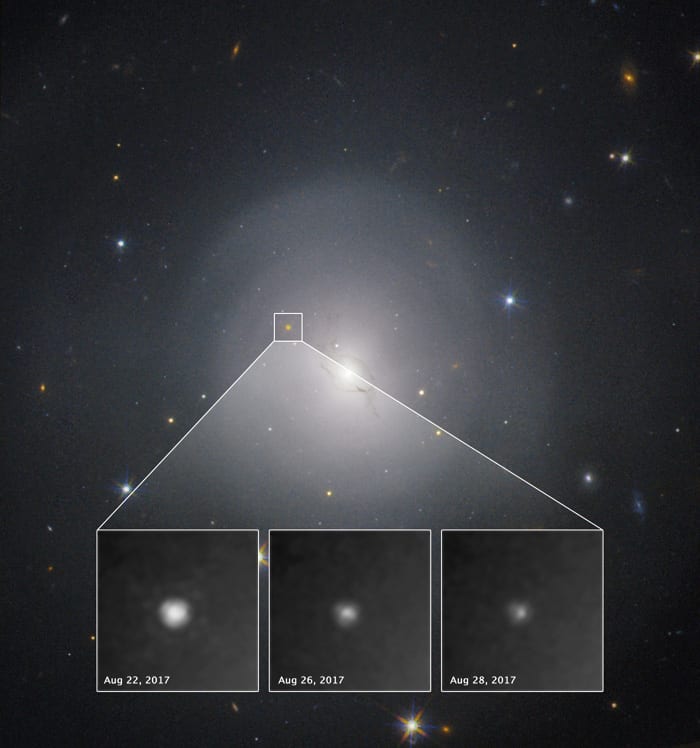
1 Kilonova burning bright On 17 August 2017 LIGO detected gravitational waves from a neutron-star collision. Within 12 hours observatories had identified the source of the event GW170817 within the galaxy NGC 4993 – shown in this Hubble Space Telescope image – and located the associated radioactive emissions, or “kilonova”. Hubble observed that flare of light fade over the course of six days, as shown in these observations taken on 22, 26 and 28 August (insets). (Courtesy: NASA, ESA; A Levan (University of Warwick), N Tanvir (University of Leicester), A Fruchter and O Fox (STScI))
Mixed messages
Until the turn of the 20th century astronomers relied on light to learn about the universe. But since the advent of radio astronomy in the 1930s, astronomers have expanded our view of the universe and we can now observe the cosmos across the full electromagnetic spectrum and by detecting other cosmic “messengers” such as cosmic rays, neutrinos and most recently gravitational waves. Multimessenger astronomy aims to combine information from all these cosmic messengers, to learn the most we can about distant phenomena. In general, each messenger carries complementary information about the source – be it a star, quasar or galaxy – and so multiple messengers provide a more complete understanding.
Apart from our Sun, the first cosmic phenomenon observed through multiple messengers was a supernova explosion in 1987. The event, named Supernova 1987A, occurred in our cosmic backyard, the Large Magellanic Cloud, some 170,000 light-years away. The explosion was so bright that it was visible to the naked eye. Apart from visible light, four different experiments, in Japan, Russia, the US and Europe, detected 25 neutrinos from the collapsing core of the dying star that produced the supernova.
Multimessenger searches involving gravitational waves began in the early 2000s when the twin LIGO observatories in the US began operating. By 2010 the global astronomy community had formed a broad network of telescopes, radio observatories, gamma-ray and X-ray satellites, and neutrino detectors to search for emissions from gravitational-wave sources. But for the first unambiguous detection, we had to wait until 2017.
Heavy pairs
Neutron stars are born during the cataclysmic collapse of very heavy stars. Matter in stars undergoes nuclear fusion, producing a variety of elements, the heaviest of which is iron, which sinks to the centre, forming an iron core. This core can eventually get so heavy that it collapses under its own weight, which occurs when the electric repulsion of atoms can no longer overcome the gravitational pull of the core. The collapse will be stopped by nuclear forces that become important once the density of the core reaches that of an atomic nucleus. The end result is a very compact, but heavy, dead star weighing about the same as our Sun. It is essentially a gigantic atomic nucleus, consisting primarily of neutrons; hence the name neutron star. The collapsing stars often end up creating a supernova.
Neutron-star collisions have long been one of the main targets of gravitational-wave searches. First, their small size and large mass make them very good producers of gravitational waves. Second, scientists already suspected that such collisions should occur frequently, thanks to the observation of gamma-ray bursts and binary neutron stars in our Milky Way. Sometimes, two neutron stars pair up to form a binary wherein they are gravitationally linked, and orbit each other in close proximity. In fact, most large stars in the universe were born together in binaries. When the stars in a binary collapse and explode as a supernova, they can both leave a neutron star behind, becoming a binary neutron-star system. Alternatively, independently formed neutron stars can encounter each other by chance and become gravitationally bound. This latter scenario can occur in locations with a large density of neutron stars, such as the centres of galaxies.
Neutron chirp: This spectrogram combines the signals from both LIGO detectors to show the characteristic sweeping “chirp” signal as the stars spiral inwards. As the neutron stars came closer to each other, circling faster, they produced higher-frequency gravitational waves shown by the greenish line sweeping upwards. (Courtesy: LSC/Alex Nitz)
These bound, dense stars can orbit each other potentially for billions of years, but over time, this orbit slowly shrinks due to the emission of gravitational waves. This process also accelerates as the orbit reduces – right before neutron stars merge, they circle each other about a thousand times per second, at velocities comparable to the speed of light. This final dance, minutes before they finally fall into one another, produces a strong gravitational-wave signal detectable by LIGO and by Virgo in Italy. When neutron stars finally merge, they form an even heavier, rapidly rotating neutron star. This new object, however, is typically too heavy for nuclear and other forces to support its weight, and quickly collapses further. The end result is most likely a black hole.
Most material from the neutron stars forms the black hole, but some of the matter scatters during the merger. This matter forms an accretion disc around the central black hole, somewhat like Saturn’s ring, and is slowly consumed by the black hole. Indeed, as the material is sucked into the black hole, an energetic jet of particles is launched, which drives some of the material outwards and creates a burst of gamma rays. As the jet passes through interstellar gas, it slows down and produces afterglow radiation – first X-rays, then visible light, and finally radio waves.
The scattered material around the black hole also produces other more exotic forms of radiation. Neutron-star matter torn away during the merger are neutron-rich heavy nuclei, which are favourable for the formation of heavy elements. Some of these elements will be radioactive, and their decay will produce substantial amounts of radiation. This radioactive emission, known as a “kilonova”, was the dominant source of ultraviolet, visible and infrared radiation observed from the neutron-star merger.
Multimessenger discovery
The observation of the merger of two neutron stars through gravitational waves and throughout the electromagnetic spectrum was a process that lasted for weeks, and is, in fact, still an ongoing cosmic event. Following the first reports of the detection, there was an influx of news from around the world that provided a fascinating, real-time picture of the emerging phenomenon. Information on observations was shared between the thousands of scientists who were involved, with close to 100 collaborating observatories – the data collected by one detector or telescope helped another one point to the right part of the sky. There were as many as 200 electronic notices that distributed some kind of information about the detection.
To date, we have observed gravitational waves, gamma rays, X-rays, ultraviolet, optical, infrared and radio emissions from this neutron-star merger, and its aftermath. But equally interesting is what we did not observe – namely the highest-energy photons and neutrinos, with energies above one billion electron volts. This non-detection is informative of what happened following the collision, such as how the debris left behind from the neutron stars can act as an energetic particle accelerator. Scientists expect to continue detecting radio waves from the debris leaving the collision site for years, and so the story is far from over.
What did we learn?
The colliding neutron stars were a mere 130 million light-years from Earth, much closer than we previously anticipated for such an event. This proximity meant that we could observe radiation longer and in more detail, presenting a rich source of information. Scientists are still analysing the copious observational data, but some key findings are already clear.
Neutron-star mergers may be the main source of heavy elements in the universe. Elements heavier than iron, such as gold and platinum, can form only in a neutron-rich plasma. The current observation indicates that neutron-star mergers are suitable sites to produce most of the heaviest elements. For a long time, scientists suspected supernovae to be the key source, but this now seems unlikely.
The expansion of the universe can be measured by neutron-star mergers. If we know how far away a collision is, and at what redshift, it can be used to measure how fast the universe is expanding. Distance is measured using the gravitational-wave signal, and redshift is measured through the electromagnetic spectrum of the galaxy that hosts the stars. The obtained distance-redshift relation describes how fast the universe is expanding. Currently there are two other means to measure expansion: one uses supernova explosions, while another looks at the cosmic background radiation. The expansion rates calculated using these two techniques currently don’t agree, and we don’t know why. It will be exciting to see whether future gravitational-wave signals can arbitrate.
We have a new upper limit on the mass of neutron stars. We know that neutron stars cannot get arbitrarily large. At some point, the gravitational pull becomes too powerful to stop consuming the whole neutron star, which then collapses into a black hole. However, it was not clear just how heavy neutron stars can get before this happens. Previously, scientists thought that the upper limit on this was about 2.8 solar masses. But based on our observation of the collision and its aftermath, as well as sophisticated numerical simulations, we can now say that the maximum mass of a non-rotating neutron star can be no more than about 2.2 times the mass of our Sun. This limit is more meaningful as it is close to the mass of the heaviest neutron stars detected so far.
The neutron stars in GW170817 orbited each other for billions of years before colliding. NGC 4993, the host galaxy in which the collision occurred, shows no sign of star formation. This means that the stars that collapsed and gave birth to the neutron stars had to have been born a very long time ago, estimated in the billions of years. Very large stars live fast and die young, while smaller stars, like our Sun, live very long.
The colliding neutron stars created a gamma-ray burst. Scientists anticipated for decades that at least some of the short gamma-ray bursts we observe were created by the collision of two neutron stars, but this was the first time such a connection was unambiguously established.
There’s something strange about the energetic jet. The gamma-ray burst we observed from this merger is distinctly weaker, compared to previous detections, but why this should be so is a mystery. Also, we have no idea why there was a very long delay before we observed any X-ray and radio emissions, which are typically detected very soon after a gamma-ray burst. It is also interesting that no high-energy photons or neutrinos were observed from such a nearby event. It’s possible that the energetic jet is pointing away from Earth, such that we can see only from the “side”. Or perhaps the jet needs to burrow through debris around the merger remnant. The jury is still out.
Twice as nice
LIGO and Virgo are currently offline for about a year, during which time they will undergo a thorough upgrade that will make them more sensitive for the next period of observation. With their new sensitivity, they could end up detecting neutron-star and black-hole mergers at double the rate of the previous period, promising many exciting discoveries. The fact that we observed a neutron-star collision even with limited sensitivity means that we can expect to observe many more neutron-star collisions when LIGO’s sensitivity further improves.
Remarkably, the expected rate is in line with what we previously anticipated from other observations, such as those of gamma-ray bursts (of which the source is unknown) or simply observing binary neutron-star systems in our galaxy, long before they merge. Once LIGO and Virgo are updated and become twice as sensitive, the detectors should in turn be able to observe collisions at twice the current distance, corresponding to about 10 times the volume of the universe from which we can detect mergers. This means that we may see a neutron star collision every month.
A large number of detections means more fun, but we should also have a better handle on the current mysteries that surround neutron stars. More detections will also mean that we hopefully see some less common events as well, like a mixed merger of a neutron star and a black hole, which may provide useful insights about extreme phenomena in the universe.
The discovery of gravitational waves from the collision of two neutron stars, and the ensuing streak of electromagnetic detections, was a historic scientific moment that concluded decades of research and will be viewed as a new frontier in multimessenger astronomy. With any luck, the next few years will see a quickly growing number of discoveries that will expand our knowledge of the most extreme cosmic events and the evolution of our universe, as well as allow us to explore hypotheses in fundamental physics that are difficult to test on Earth. It will be a great journey that, with the advancement of data.
Timeline of a collision
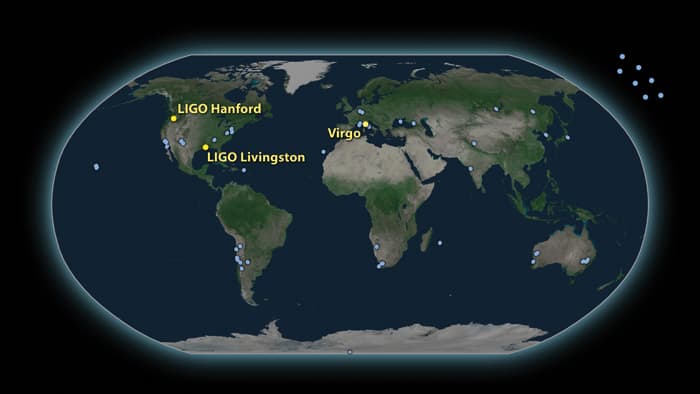
Looking out: More than 70 observatories, on Earth and in space, studied the neutron-star collision GW170817. (Courtesy: LIGO–Virgo)
–60 sec As yet unseen in visible light, gravitational waves from the inspiralling neutron stars start to appear in LIGO and Virgo data.
0 sec The two neutron stars merge.
2 sec The Fermi satellite discovers a gamma-ray burst.
14 sec The Fermi satellite sends out an automated message of detection.
6 min LIGO–Virgo software identifies a signal.
40 min Astronomy community is notified of gravitational-wave detection.
1 hr First neutrino results come in from the IceCube observatory – none were seen.
5 hr LIGO and Virgo gravitational-wave data are combined to make accurate map of source direction.
11 hr First optical detection reported by Swope Telescope, also identifying the host galaxy. Five other observatories take independent optical image of the event within an hour of Swope.
15 hr Swift satellite detects bright, ultraviolet emission.
17 hr Optical spectrum of the event is first measured by the 6.5 m Magellan Telescope.
9 days Chandra satellite reports observation of X-rays from the event.
15 days Radio emission is detected by the Very Large Array observatory.
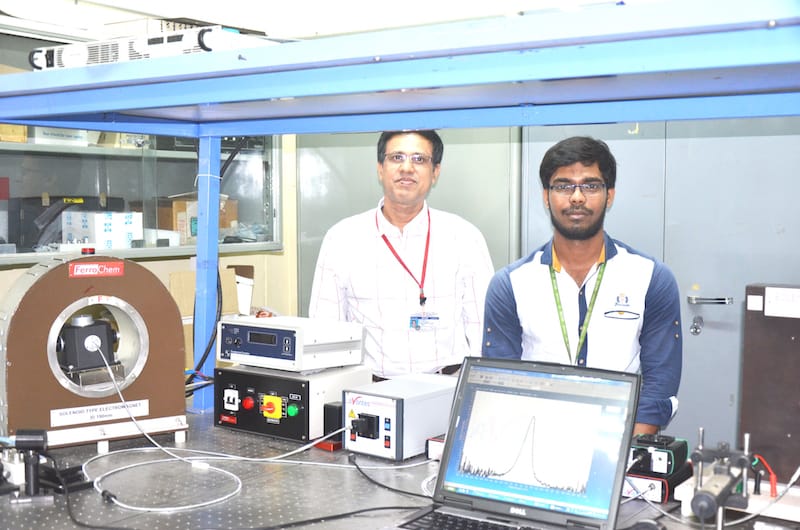
Researchers in India say they have discovered a new and simple way to probe how polymers behave at interfaces under different conditions. Their technique, which relies on magnetically polarizable nanoemulsions and visible spectroscopy, could benefit scientists working on developing colloidal formulations for improved food and cosmetic materials, drug-delivery systems and anti-bacterial surfaces, to name but a few.
Understanding how adsorbed macromolecules behave at liquid–liquid interfaces under different physico-chemicial conditions is extremely important for a number of scientific disciplines,” explains team leader John Philip of the Indira Gandhi Centre for Atomic Research. “Since the stability of a colloidal dispersion depends on the behaviour of the adsorbed moieties (for example, polymers or polyelectrolytes), studying their behaviour can also help improve the shelf life of industrial formulations.”
At the moment, researchers mainly use expensive and complex techniques like atomic-force microscopy and cryo-transmission electron microscopy to study the conformational behaviour of polymer molecules at interfaces. The new technique developed by Philip and colleague AW Zaibudeen is much simpler.
Measuring Bragg-peak position shifts
Bragg spectra
The researchers developed oil–water droplets that assemble into a periodic ID array under the influence of a weak magnetic field (with a strength of about 100 Gauss). “When we illuminate such 1D ordered structures with white light, they selectively reflect visible wavelengths when the Bragg condition is satisfied (that is, one colour is reflected),” explains Philip. “Since the droplet spacing falls in the submicron wavelength range (400–700 nm), the Bragg condition is satisfied at visible wavelengths (as opposed to X-ray wavelengths for metals) and the trick we have used in our work to probe conformational changes in polymers using this technique is quite simple.”
The researchers in fact attach the polymer they wish to study onto these droplets and then look at how the Bragg-peak position shifts when the droplets are placed in different environments – for example, in solutions of different pHs or ionic strengths, or at different temperatures. “All we need here is a mini fibre-optics-based spectrograph to measure the light wavelengths reflected by the drops,” says Philip.
In the lab
Thanks to their technique, the researchers say they were able to observe conformational changes in the polymers under these different conditions, and determine how they behave, for example when they are extended and stretched or when they are collapsed.
Important for understanding biological processes
As well as being important for developing colloidal formulations for industrial applications, as mentioned, the way polyelectrolytes behave under various environmental conditions is also fundamentally important for understanding biological processes such as protein folding and DNA condensation, he states. This is because a polyelectrolyte adsorbed at a liquid–liquid interface mimics the in vivo conditions of charged macromolecules at cell–fluid interfaces.
The team, reporting its results in the Journal of Molecular Liquids doi.org/10.1016/j.molliq.2017.12.090, says that it is now busy developing a portable spectrograph that has magnetic field and temperature control options. “We are also trying to design a microfluidic set up incorporating the above features,” Philip tells nanotechweb.org.
Similar to auditory perception when listening to music, imagining a song in your head also produces neuronal signals in specific regions of the brain. Understanding how the brain encodes such “auditory imagery” could impact the development of brain-machine interfaces for patients who have lost the ability to speak.
Researchers from EPFL and UC Berkeley, in cooperation with other institutions in Switzerland, Germany and the USA, have designed an experiment that, for the first time, quantified and compared neural activity during auditory perception (listening) and auditory imagery (imagining) of a song. The authors found that the neural activity under these two conditions substantially overlapped in frequency and cortical location. Using models that decode the neural activity during auditory imagery, they then reconstructed the spectrogram (a plot of time versus frequency) of the imagined song (Cerebral Cortex 10.1093/cercor/bhx277).
Novel experimental approach
Studying auditory imagery is challenging because it is difficult to align the measured neural activity with the auditory imagery stimuli due to the subjective nature of mental representations. In this study, the authors implemented a novel approach that allowed them to measure neural activity with high spatial and temporal resolution and simultaneously synchronize it with either auditory perception or imagery.
The participant was an epileptic patient who had undergone electrocorticography – an invasive procedure used to treat epilepsy – which involved implantation of electrode arrays in the left hemisphere of the brain covering regions of the auditory cortex, temporal lobe and sensorimotor cortex. During the experiment, the participant, who was also a professional piano player, was asked to play a song under two conditions.
The experimental design (click to zoom)
In the first condition, the participant played a song with the sound of the piano turned on, whereas in the second, he played the same song with the piano sound turned off. In both cases, the researchers recorded the piano spectrogram and the neural activity of the participant. The neural activity recorded in the first condition corresponded to auditory perception, whereas in the second condition it corresponded to auditory imagery.
Shared neural representations
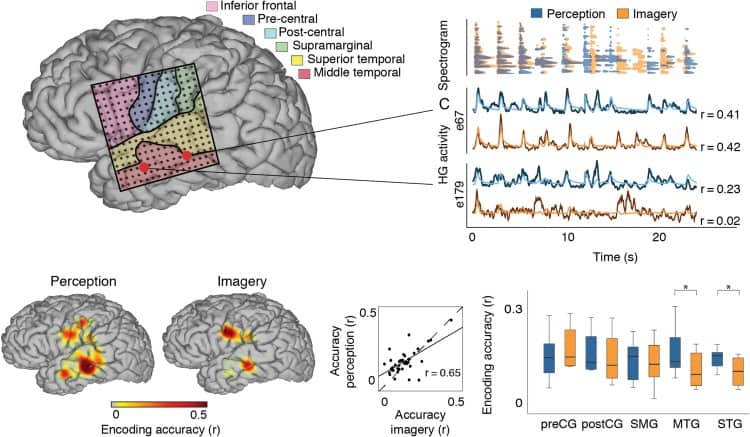
The authors compared the neural activities measured during perception and imagery conditions to that predicted from neural encoding models based on the spectrogram of the recorded song. They found that the prediction accuracies of neural activity during auditory perception and imagery were correlated.
They also observed that the two neural activities shared cortical locations and displayed similarities in temporal and frequency tuning. However, the overlap was not complete: some cortical regions (such as the superior temporal and middle temporal gyrus) showed lower prediction accuracy for the imagery condition, as well as differences in temporal and frequency tuning.
Encoding of auditory perception and imagery
Decoding neural activity
In this study, the authors developed decoding models and reconstructed an auditory spectrogram of the played song from the neural activity measured for each condition. Their results showed the potential use of auditory imagery for decoding specific acoustic features in a song.
Future research based on these findings, along with the development of less invasive technology for measuring neural activity with high spatial and temporal resolution, will have implications for the development of brain-machine interfaces. For instance, these interfaces could be used to decode speech directly from the mental representations of patients with neurological impairments that affect their ability to speak.
The ability to work-out the Casimir force between arbitrarily-shaped objects could be one step closer thanks to work done by physicists in the US. The team used an atomic force microscope to measure the force between two gold-coated spheres. This is unlike most experiments today, which are limited to measuring the Casimir force between a flat surface and a sphere.
The research could lead to a better understanding of the Casimir force in complicated geometries – something that would be very useful to those trying to create more robust and versatile microelectromechanical systems (MEMS).
In 1948, the Dutch physicist Hendrik Casimir predicted, counter-intuitively, that two uncharged, parallel mirrors, or “plates”, should attract one another very slightly when in a vacuum. He reasoned that the virtual photons, which quantum mechanics says continually flit into and out of existence within the vacuum, would exert radiation pressure on both sides of each plate. But because the plates create what amounts to an optical cavity, only electromagnetic waves with certain well-defined frequencies could exist between them. The radiation pressure would therefore be greater on the outside, so pushing the plates inwards.
Alignment woes
Casimir’s prediction has since been confirmed in the lab many times over. However, most experiments do not involve parallel plates because the effect is extremely sensitive to changes in distance. Therefore, any minute misalignment between plates would affect the results. Instead, most experiments measure the attraction between a single, long plate and a sphere. In this configuration, there is no need to worry about alignment because the shortest distance between the two objects will remain the same no matter how the sphere rotates.
Because Casimir’s equation describes the case of two parallel plates, predicting the outcome of plate-sphere experiments relies on approximating a curved surface by a series of very small parallel plates and that the total force involved is the sum of the forces from the individual plates. To date, this approximation has withstood nearly all empirical testing. However, according to Jeremy Munday of the University of Maryland, it should break down for very sharp curvatures and at edges.
In the latest work, Munday and colleagues Joe Garrett and David Somers consider the force between two spheres, which they describe as a “complex interaction geometry”. Unlike the plate-sphere tests, this kind of experiment requires continually aligning the centre of the two objects. The only time it has previously been attempted involved the interaction of polystyrene spheres in a liquid, rather than metals in air or a vacuum. Because the spheres were transparent they could be aligned optically (using optical tweezers), but, says, Munday, their interaction – being very-short range (between 8-20 nm) – was better described by van der Waals than Casimir forces.
Unambiguous target
The new experiment instead unambiguously targets the Casimir effect. It involves two gold-coated hollow glass spheres, each about 80 µm in diameter, which are separated by distances between 30-400 nm. One of the spheres is attached to a silicon substrate while the other is fixed to the cantilever arm of an atomic force microscope.
The idea is to set the bottom sphere oscillating up and down by a few nanometres and to measure the effect that has on the upper sphere by deflecting a laser beam off the cantilever arm to monitor its movement. If the spheres feel the Casimir force then they should move together in phase – as the bottom one moves upwards it reduces the gap between them, so increasing the force and causing the top one to move downwards, and vice-versa.
To carry out their experiment, the researchers had to overcome several technical challenges. To keep the spheres centred to within 1% of their radii over a 24 h period they imaged the spheres’ relative horizontal positions using the atomic force microscope before each measurement. They also had to filter out the potentially confounding effects of drag because the experiment was done in air. This can be done because drag is proportional to the velocity of the lower sphere and therefore 180° out of phase compared with the Casimir force, which depends on the sphere’s displacement. They also removed any possible electrostatic forces and calibrated their set-up, by applying suitable bias voltages to the spheres.
The team did a series of nine experiments in which three different-sized top spheres and three different-sized bottom spheres, each with a different radius. Analysis of data from all the measurements revealed that the spheres oscillated together just as predicted. This agreement between theory and experiment, says Munday, “suggests that the experiment was working as expected”.
Deviant behaviour
However, what he and his colleagues really want is a deviation, showing that the approximation they employed no longer holds. Detecting discrepancies, he estimates, will require reducing the effect of thermal noise from the cantilever by about an order of magnitude. The team will try to achieve this by increasing the number of measurements and by using a wider variety of sphere radii.
Establishing a deviation, says Munday, would allow them to test different theories about how the Casimir force behaves in more complex geometries, which should allow better control of the Casimir force inside MEMs. He points out that the Casimir force is already a problem for very tiny devices, since it can cause parts to stick to one another and break. But by better understanding how geometry affects the force, he says, it may be possible to reduce it or even make the force repulsive.
What’s more, adds Munday, in future it might be possible to invert their scheme and create an extremely sensitive displacement sensor by measuring tiny changes in the Casimir force. This, he says, might allow MEMS – which are used in everything from airbags to mobile phones – to become even smaller and cheaper to run.
A paper describing the research has been accepted for publication in Physical Review Letters.
Happy new year and welcome back to Physics World after our winter break. Why not get 2018 off to a great start with the January 2018 issue of Physics World, which is now out in print and digital format.
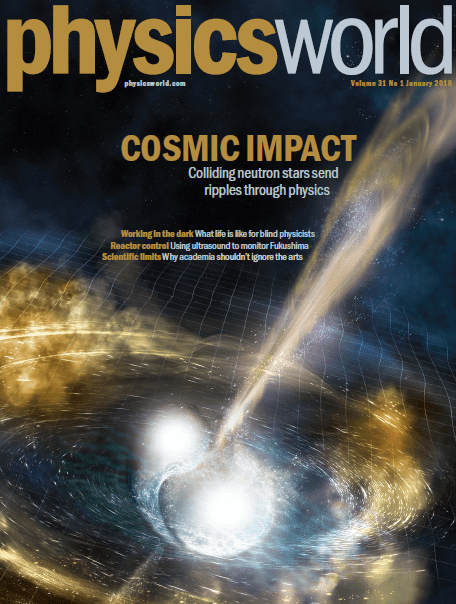
In our fantastic cover feature this month, Imre Bartos from Columbia University in New York examines the massive impact on physics that last year’s spectacular observation of colliding neutron stars will have.
Remember that if you’re a member of the Institute of Physics, you can read the whole of Physics World magazine every month via our digital apps for iOS, Android and Web browsers.
For the record, here’s a run-down of what else is in the issue.
• Multimessenger work bags award – The Physics World 2017 Breakthrough of the Year goes to an international team that ushered in a new era of multimessenger astronomy, as Hamish Johnston reports
• Neutrino hunter – Nigel Lockyer, director of Fermilab in the US, talks to Michael Banks about the future of particle physics – and why neutrinos hold the key
• Why the arts matter – With many countries doing all they can to get more students into science and technology, can there ever be too much of a good thing? Paul Axelrod warns against ignoring other subjects
• The dark side – Robert P Crease describes his adventures creating a database to tackle the history of physics
• A new cosmic messenger – The first observation of gravitational waves from two merging neutron stars that was recently made by the LIGO and Virgo detectors has – along with date from telescopes across the globe and in space – kicked off a new era in multimessenger astronomy. Imre Bartos describes this watershed moment, which crowned decades of research and will shape the future of observational astronomy
• What next for Fukushima? – Nearly seven years after a powerful tsunami caused catastrophic damage to Japan’s Fukushima Daiichi nuclear-power plant, the clean-up and recovery is still ongoing. Bruce Drinkwater and Rob Malkin recently visited the disaster site and the undamaged Tsuruga plant to see if they can pinpoint the true extent of the damage in the dangerously radioactive reactors
• Physics in the dark – Modern technologies and educational policies aim to make physics fully accessible to the blind. But just how easy is it for the sightless, asks Jon Cartwright
• The man behind the machine –Vint Cerf reviews The Turing Guide by Jack Copeland, Jonathan Bowen, Mark Sprevak and Robin Wilson
• Let’s start at the very beginning – Sabine Hossenfelder reviews Origins: the Scientific Story of Creation by Jim Baggott
• How to write a good CV for industry – If you want a job in hi-tech industry, it pays to tailor your CV so that it makes the most of your business-relevant skills and expertise, says Andrew Hirst
• Once a physicist: Lydia Harriss – meet the head of physical sciences at the UK’s Parliamentary Office of Science and Technology
• How physics saved my life – physics teacher Russell Peters on his experience of the 2004 tsunami
Members of the Institute of Physics can read the whole of Physics World magazine every month via our digital apps for iOS, Android and Web browsers.