Launched in February, data from the sensitive suite of instruments aboard NASA's Solar Dynamics Observatory are already reshaping what we know about solar processes and the causes of space weather, says Alan Title

The Sun is at its most beautiful when it is at its most dangerous. That beauty is visible down here on Earth in the form of the northern and southern lights, which appear when charged particles from the Sun strike the Earth’s upper atmosphere. But out in space, the consequences of Sun-caused “space weather” are not so benign: the high-energy particles, X-rays and gamma rays that the Sun emits can damage sensitive electronics, crash computers and have dangerous (possibly even fatal) effects on astronauts.
Most of the time, the Earth’s atmosphere and magnetic field protect us from the more violent events that occur in the solar atmosphere, such as explosions near the Sun’s surface (known as solar flares) or eruptions of huge bubbles of gas from inside the Sun (called coronal mass ejections, or CMEs). Even so, when charged particles from the Sun hit the Earth’s magnetic field, the field gets distorted and compressed. The resulting changes in the densities of charged particles in the Earth’s upper atmosphere can produce significant effects. Radio communications can be disrupted and, sometimes, such changes can induce damaging currents in long power lines, buried cables and oil pipelines. Giant flares have even destroyed power transformers and brought down electrical grids.
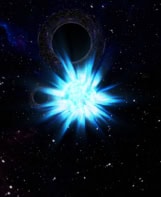
Yet like the auroral displays, the solar processes that cause space weather are also stunningly beautiful. The image on the left shows a ring-shaped prominence erupting from the surface of the Sun, sending a pulse of plasma rushing outwards at a speed of about 300 km s–1. Before the eruption, this prominence existed as a long tube of relatively cool, magnetically contained material just above the visible surface. It was then destabilized by mechanisms that are not completely understood. Such mechanisms are important because they can produce CMEs, which can launch up to 10 billion tonnes of hot plasma into the heliosphere – with serious consequences for any object, human or otherwise, that happens to be in the way.
One of the major goals of NASA’s new Solar Dynamics Observatory (SDO) mission is to understand these destabilization mechanisms. To learn more about them, and the phenomena they produce, we need to be able to observe solar events as they happen. This is not easy. Flares and CMEs can occur nearly anywhere at any time, so we need a monitoring system that can observe the entire Sun’s surface continuously. Moreover, solar explosions are fast – speeds of 1000 km s–1 are not uncommon – so images must be obtained at a rate and with exposure times that can capture the evolution of these complex events. Sending the data from so many images back to Earth and distributing then to the scientific community is also difficult. Finally, there are all the usual problems associated with working in space: you only get one shot, so if equipment does not work, then you cannot fix it; all equipment has to be as light as possible because it costs £200,000 per kilogram just to launch an experiment; and the sensitive instruments and computers must be able to withstand the very space weather they are meant to study, without the protection of the Earth’s magnetic field.

All of these factors posed a challenge for those of us who designed the instruments on the SDO. As the first mission in NASA’s “Living with a star” programme, the SDO’s purpose is to help us to gain a better understanding of how solar events, such as the ring prominence shown in figure 1, affect the heliosphere and, in particular, how they cause space weather. In doing so, the SDO is building on earlier missions such as SOHO and STEREO, which were launched in 1995 and 2006, respectively. These two missions are still operating, adding to our knowledge of solar events by collecting additional data on the outer corona and, in the case of STEREO, providing additional views of solar eruptions. Similarly, TRACE, which was launched in 1996 and turned off in September, provided high-resolution images of selected regions of the solar atmosphere.
The results from these earlier missions offered a tantalizing glimpse of how the Sun operates. However, this new mission will tell us much more about the Sun than its predecessors ever could. All previous images of the solar corona suffered from three major limitations. One is that they did not combine high spatial resolution with observations that covered the full disk of the Sun. Second, the instruments could not take lots of images in quick succession (known as “high cadence” operations) because of limitations to the rate that data could be sent back to Earth. And finally, because previous instruments could not take images across a range of different wavelengths, and at a rate comparable to coronal evolution, it was impossible to distinguish whether the observed events were due to heating, cooling or density changes.
A solar-observing trio
The SDO was launched from the Kennedy Spacecraft Center on 11 February and carried into a geosynchronous orbit 36,000 km above the Earth by an Atlas V rocket. The three instruments on board were designed to complement each other. The Heliospheric and Magnetic Imager (HMI), which was developed by researchers at Stanford University and the Lockheed Martin Space Astrophysics Laboratory (LMSAL), will study the behaviour of magnetic fields at the surface of the Sun. To do this, every 30 s the HMI makes maps of material flowing in the solar surface. It also maps the “line-of-sight” magnetic field every 45 s and the vector magnetic field every 15 min. The surface-flow maps let us infer some of what is going on below the surface of the Sun, because patterns in the surface flow can reveal the behaviour of magnetic fields even before they appear on the visible hemisphere. The vector-field maps, meanwhile, show the direction and strength of the magnetic field that emerges through the solar surface. As for the line-of-sight maps, they reveal the magnetic flux in the direction of the Earth. The vector field offers more information, but the line-of-sight measurements are more sensitive.

The second instrument on the SDO is the Atmospheric Imaging Assembly (AIA), which was also developed at the LMSAL (figure 2). Its task is to study how the solar corona responds to the magnetic fields that the HMI observes near the Sun’s surface. The AIA’s four telescopes (see box) direct light onto four CCD cameras, which take images of the Sun’s atmosphere at wavelengths that correspond to ionization states of iron and helium, as well as three spectral bands in the ultraviolet region of the spectrum. Data from the iron spectral lines allow us to map the temperatures of the corona in a band from 700,000–20 × 106 K, while the helium data probes temperatures from 30,000–100,000 K.
The final instrument aboard the SDO is the Extreme Ultraviolet Variability Experiment (EVE). Developed by staff at the University of Colorado’s Laboratory for Atmospheric and Space Physics, EVE consists of an array of spectrometers that measures the total solar irradiance over wavelengths between 0.1–105 nm. Because EVE and the AIA are flying together, it is usually possible to associate changes in the Sun’s irradiance with specific solar events, by comparing the timing of changes in EVE’s measurements with the spectral-band data in the AIA’s images.
Dealing with the data
The requirements for high imaging rate, high spatial resolution and broad spectral coverage drove the design of all three instruments, as well as the properties and orbit of the spacecraft that carries them. The observatory’s geosynchronous orbit, for example, offers two significant advantages for studying the Sun. First, such orbits are high enough above the Earth that the planet only blocks out the Sun for one hour a day at the most – and even then only for two, two-week periods each year, in September and March. Second, geosynchronicity means the SDO spacecraft is always over the same latitude, so it can broadcast data and receive commands continuously from a single ground station near White Sands in New Mexico.
Being in continuous contact with the ground station is vital for the SDO, thanks to the sheer volume of data it produces. There are a total of six CCD cameras on the SDO – two on the HMI and four on the AIA – and almost every second a 4096 × 4096 pixel (16 megapixel) image from one of them must be read out and transmitted back to Earth. The actual pixels are big by the standards of commercial camera CCDs (13 × 13 µm).
Because the number of photons that can be detected in a single exposure scales with the pixel size, the CCDs on the AIA have a big dynamic range – from 1 to 10,000. (The cameras were designed and manufactured by scientists and engineers at the Rutherford Appleton Laboratory near Didcot, while the special CCD detectors were made by e2v, also in the UK.) This is wonderful for covering the broad range of intensities in a solar flare, but it also means that each image contains a quarter of a terabit of data. Indeed, the total amount of data sent from the AIA and the HMI to the New Mexico ground station is about 1.8 terabytes per day, or 67 megabits per second. To get an idea of the scale of data involved, consider that each image would fill 6.25 DVD discs, so it would take about 540,000 DVDs to hold all the images obtained in a single day.
This high data rate had a significant impact on the design of the Joint Science Operations Center for the HMI and the AIA (EVE, with a much smaller data rate, has its own data centre), the data-distribution system and the system the rest of the scientific community uses to access the data. This last feature is particularly important, given that if you ask a scientist what data they want to see, their first response is usually “All of them!” Unfortunately, the awful truth is that once the images are uncompressed, the AIA alone generates about 3.5 terabytes of data per day – equivalent to downloading about 700,000 high-sound-quality MP3 files.
To make life easier for solar scientists, a number of utilities have been developed that allow them to mine the SDO archive for data that contribute to specific science objectives. For example, some questions that scientists are investigating include whether flares are associated with CMEs, what types of flares are associated with specific features in the EVE spectra, and what the statistical relations are between filament ejections and magnetic-field configurations. We have also produced a data viewer, which allows scientists to view the archive using compressed data. This greatly reduces the number of data that must be collected before precise science evaluations can begin. Other data-processing tools include a “Sun Today” webpage (sdowww.lmsal.com) that shows samples of the AIA images and HMI magnetograms, updated every five minutes, as well as daily movies of solar events.
What we are learning
In late March, we opened the doors of the AIA’s telescopes for the first time. The first images were beautiful. All the delicate front filters on the telescopes had survived the launch and all the instrument functions were working perfectly. A few days after we started taking data, the Sun rewarded us with a huge eruptive prominence on its east side – a wonderful start to our planned five-year mission.
Since then, we have been observing the Sun almost continuously, with only minor breaks for calibrations. During this period, the Sun has presented us with a number of CMEs, filament eruptions, small flares and even a few moderately large ones. As a result, we are now beginning to appreciate just how much of the Sun is impacted by a magnetic rearrangement in a very local region. For example, areas without spots can create disturbances that impact 30–60% of the visible surface.
Taking images at a high cadence has also been richly rewarding. At the beginning of a filament activation or CME, some features occur at speeds of 100–600 km s–1. At the onset of a flare, there are occasional “puffs” of plasma that move at speeds of 1000–2000 km s–1. When such events are captured, part of their diffuse appearance is caused by motion blur; a typical 3 s exposure taken by the AIA, for example, blurs the image of a 2000 km s–1 structure by 4–8 pixels. A 30 s exposure typical of earlier spacecraft would cause five or more times more blurring and make the event appear 25 times fainter – so faint, in fact, that the event might not have been detected at all. We also see wave patterns that move along magnetic field lines at 1000–2000 km s–1 as the flare event evolves. These fast waves had never been seen before and we do not yet know the mechanism that produces them or their role in the flare process.

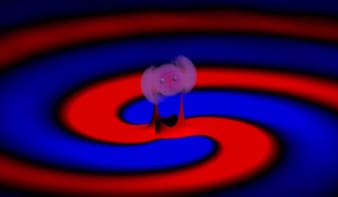
Although some of these data are better interpreted numerically, the multiple temperature images taken by the AIA can also be combined to make several types of false-colour temperature maps, like those shown in figure 3. Movies of such colour maps allow solar scientists to study how temperature patterns evolve when the Sun is quiet, as well as when it is active. These movies provide a visual picture of the relations between events on the Sun that are quite distant from one another. For decades there have been arguments about whether flare or filament eruption can cause another distant event. Now, after only a few months of observations, the AIA movies have clearly established causality on distances of a solar diameter and more. Even though we are currently experiencing the deepest minimum in solar activity for more than a century, the Sun still has plenty to tell us.
The AIA telescopes: a fourfold challenge
NASA’s Solar Dynamics Observatory carries three instruments, one of which is the Atmospheric Imaging Assembly (AIA). Designing its four telescopes presented us with four main challenges, the first of which is caused by sunlight itself. The amount of light that reaches a typical extreme ultraviolet (EUV) channel is a billion times weaker than the sunlight that falls on the front of the telescope. To reject the visible light, the front of each EUV channel is covered with a metal filter that is only 150 nm thick, or about 0.2% the diameter of a human hair – thick enough to block visible light, but thin enough to pass the desired EUV light.
Manufacturing such filters is challenging, but designing mounts for them is even harder. These mounts must be sturdy enough to survive the vibrations and pressure changes they are subjected to at launch, but they cannot block a significant fraction of the EUV light. The image shows one of many filters that failed while we were testing various designs to determine which one would survive the launch environment.

The second challenge is making sure that the EUV light will be reflected from the telescopes’ mirrors. EUV light does not reflect from the single layer of silver or aluminium that suffices for the mirrors of visible-light telescopes, so instead we had to coat the mirrors with a series of thin alternate layers of silicon and molybdenum. These coatings are not removable, so a failure in the coating ruins a mirror. The mirrors also have to be the right shape, and because the wavelength of EUV light is so short, they must also be extremely smooth, with root-mean-square variations of about 0.3 nm.
The third challenge is that EUV light is easily absorbed by contaminates such as the silicon and hydrocarbon compounds used to hold the AIA telescope together. A coating of contaminates just 50 nm deep would be enough to lower the telescope’s transmission by 50%, and the AIA telescopes have 11 different surfaces where such contaminates can settle, including multiple filters, the telescopes’ primary and secondary mirrors, and the surface of the CCD camera itself. This means that less than 5 nm of contaminates could be allowed to collect on any given surface, either during the fabrication process or from the outgassing of components after the AIA goes into orbit.
Finally, there is the question of stability. Each pixel on the AIA’s CCD cameras samples light from a cone about 0.6 arcseconds wide, which corresponds to about 730 km at the centre of the solar disk. To produce sharp images, the motion induced by the spacecraft must be limited to about 0.02 arcseconds, or about 14 km on the solar surface. This requires a system of active stabilization, where signals generated by the telescopes themselves are used to control the angles of secondary mirrors that are mounted on piezoelectric actuators. The result is so stable that it is like being able to keep a laser pointed at a 1 mm-diameter target circle from a distance of 10 km. For golf fans, this is equivalent to a player making a hole in one on the Old Course in St Andrews while standing in Piccadilly Circus.