The heterogeneity of malignant tumours can impede the success of radiotherapy, as characteristics such as vasculature, metabolic activity, proliferation and cell death can vary throughout a tumour. The ability to identify therapy-resistant areas of a tumour may facilitate more effective and individualized treatment.
Researchers from the Netherlands have used pre-treatment, multi-parametric imaging of metabolic activity (FDG-PET/CT), hypoxia (HX4-PET/CT) and tumour vasculature (dynamic contrast-enhanced (DCE)-CT) to identify regions of non-small cell lung cancer (NSCLC) tumours with characteristic phenotypes. They then linked the images with treatment outcomes of 35 patients who had received (chemo)radiotherapy while participating in two prospective clinical trials (Radiother. Oncol. 125 379).
Principal investigator Wouter van Elmpt, an assistant professor at Maastricht University Medical Center and MAASTRO clinic, and co-authors developed a data-driven clustering approach that combined multiple functional imaging techniques to identify high-risk tumour subregions. Their objective was to derive a methodology to comprehensively assess subregions based on anatomical and functional imaging, without using any prior knowledge.
The team used imaging data collected at MAASTRO clinic under the supervision of Philippe Lambin, professor of radiation oncology at Maastricht University Medical Center and principal investigator of the two clinical trials. In addition to the planning FDG PET/CT, both clinical trials had an extensive imaging protocol. The resulting imaging data set is thus highly unique, lead author Aniek Even told medicalphysicsweb, noting that the data set provided valuable information on a wide range of tumour characteristics and the links and overlap between those characteristics.
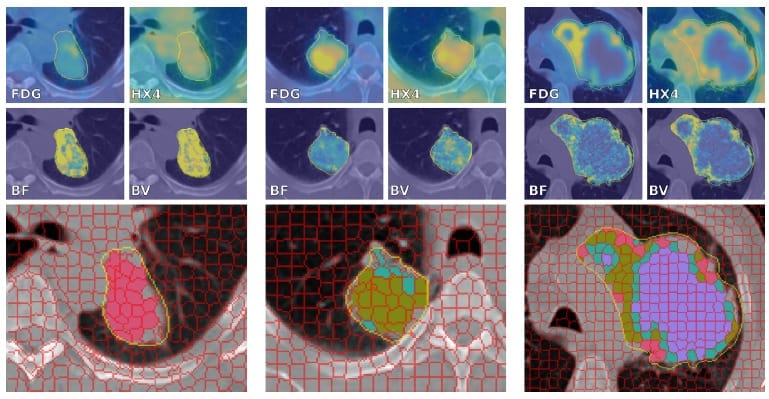
The researchers performed kinetic analysis on DCE-CT scans to acquire blood flow and blood volume maps. They non-rigidly co-registered HX4-PET/CT and DCE-CT scans to the planning FDG-PET/CT scans. They also performed a clustering step on the multi-parametric images to segment each tumour into supervoxels representing homogeneous subregions. Only supervoxels with at least 90% of their voxels in the gross tumour volume (GTV) of the primary tumour and CT Hounsfield units (HU) larger than –100 HU were used for the analysis.
Next, the team performed a second clustering step to group the supervoxels of all tumours into phenotype clusters, and assigned these clusters to all supervoxels of all patients. Depending upon the absolute or relative volume of supervoxels present from each cluster, the researchers assigned tumours to one or more clusters. They assigned a tumour to a cluster if more than 50% of the tumour contained supervoxels of that cluster or if the cluster volume exceeded the median volume over all patients.
Each patient had between 1 and 1744 supervoxels, with a median of 60. The researchers identified four clusters and assigned patients to these based on supervoxel distributions. Characteristics included: low blood flow, low blood volume and low PET uptake values, indicative of necrosis (cluster 1); low perfusion and intermediate PET uptake values (cluster 2); intermediate perfusion values and the highest HX4 standardized uptake value (SUV) and FDG SUV (Cluster 3); and high blood flow, high blood volume and intermediate PET uptake values (Cluster 4).
Cluster 3 patients had a significantly worse survival than patients assigned to the other three clusters, with a 26% survival probability two years after treatment, compared with 67% for the other three groups. The authors tested the prognostic value of the total tumour volume to confirm that their results were not driven by tumour volume.
“Our study showed that an intra-tumour classification of heterogeneous subregions may allow us to predict NSCLC patient prognosis after (chemo)radiation,” Even explained. “But what is most interesting is the image analysis framework that we developed. With the increasing amount of data available for every cancer patient, analysis methods are required that can manage multiple scans and can combine the information provided by every imaging modality or scan.” One example, she said, could be combining multiple functional MRI sequences or PET acquisitions from a PET/MRI scanner in prostate or head-and-neck cancer.
Even also pointed out that the methods used are largely based on open-source software, including image registration, generation of the supervoxels and the clustering of the supervoxels. “The methodology to combine multi-parametric images can easily be implemented and used in other projects,” she said.
The team also used part of the methodology to predict hypoxia levels and hypoxia spatial patterns. The model that they developed correctly classified all tumours, and could aid tumour hypoxia classification and patient stratification.
“Combined data from CT, FDG-PET and DCE-CT already available could potentially replace cumbersome and expensive hypoxia PET scans,” Even explained. “This could provide information on the hypoxia status of a tumour without large changes in current clinical workflow. However, additional validation and external validation of our findings need to be performed before any imaging biomarker can be used in clinical applications. The availability of tracers and imaging techniques will, in addition, largely determine success.”