Accurate determination of cancer stage is a highly qualitative process, with the initial cancer assessment often relying on visual examination of cells under microscope. A new approach that combines confocal fluorescence microscopy and advanced structural disorder analysis could provide a more precise way to differentiate cancerous and non-cancerous cells and identify different stages of malignancy.
Researchers from the University of Memphis, led by Prabhakar Pradhan, have developed a photonic technique to quantify structural changes in intracellular organelles. In their latest work, they demonstrate that the approach can be applied to differentiate breast and prostate cells at different cancer stages (J. Biophotonics 10.1002/jbio.201700257).
“This photonic technique provides an efficient way to compare changing heterogeneous structural alteration at nano to submicron scales and can target molecular-specific (DNA, for example) alteration in a cell as well,” highlighted Pradhan. “This will lead to many interesting applications in biological studies, including cancer detection.”
“This work describes a new way to quantify structural disorder in the mass density distribution of nuclear DNA,” said lead researcher Peeyush Sahay. “This offers a novel way of differentiating cancerous cells from normal cells, and identifying unknown cancer stages with higher accuracy. Our technique offers an alternative way to determine cancer stage quantitatively, which is much easier and will reduce human error in histopathological tests.”
Optical approach

The approach uses confocal fluorescence microscopy to selectively image intracellular molecules. Nuclear DNA, for example, can be targeted by staining with the fluorescent dye DAPI. The pixel intensities of the resulting micrograph are used to create an “optical lattice”, which represents the spatial mass density distribution of a selected molecule (nuclear DNA in this study) inside the cell.
The degree of structural disorder is determined by evaluating the strength of light localization – a phenomenon arising from interference of light waves inside a disordered medium – in these optical lattices. The researchers then use advanced statistical analysis to determine the inverse participation ratio (IPR) of the eigenfunctions of the optical lattice, which provides a measure of light localization strength of the optical lattice. The average IPR, , represents the “disorder strength” and incorporates the effects of all types of structural heterogeneity in a single parameter.
To demonstrate the IPR technique, Sahay and colleagues quantified the structural disorder in the nuclear DNA of various DAPI-stained normal and cancerous cells. They first examined MCF-7 breast cancer cells and non-cancerous MCF-10A breast cells. For each cell, they recorded 5–6 confocal fluorescence micrographs from above and below the middle plane of the nucleus.
Representative (colour coded) IPR images, obtained at a scale of 0.4 μm (a 0.4 × 0.4 μm sample area), showed more regions of higher structural disorder in the cancerous MCF-7 cells than in the MCF-10A cells.
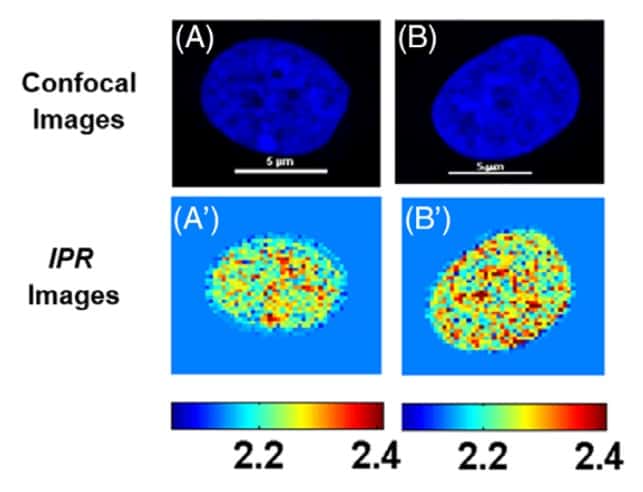
“In addition to the quantitative analysis, this approach also allows a better qualitative visualization of any structural changes occurring in the cells,” pointed out Sahay. Huda Almabadi, a graduate student and another lead contributor, explained it further: “The IPR images, for example, reveal regions of chromatin clumping, which is not apparent from the original confocal images of the cells.”
The values calculated at 1.6 μm were 2.55 for MCF-10A cells and 2.76 for MCF-7 cells. Statistical analysis of all IPR values for each cell type suggested that the mean disorder strength of the cancerous cells was significantly higher than for the control cells.
The researchers also calculated at length scales from 0.4 to 1.6 μm, and found that the average disorder strength for the MCF-7 cells was higher than for MCF-10A cells at all measured scales. This finding suggests that degree of tumourigenicity in breast cancer cells could potentially be quantified by measuring the disorder strength of their nuclear DNA.
Next, the team used the IPR technique to analyse nuclear DNA in human prostate cells. They examined four prostate cell lines: normal PWR, tumorigenic and low metastatic LNCaP, highly tumorigenic and highly metastatic DU145, and highly tumorigenic and highly bone metastatic C4-2 cells.
IPR images of DAPI-stained prostate cell nuclei (at a scale of 1.40 μm) clearly distinguished the three metastatic cell lines from the normal PWR cells, suggesting higher structural disorder level in the cancer cells.
The PWR, LNCaP, DU145 and C4-2 prostate cell lines exhibited values of 2.89, 2.95, 3.08 and 3.18, respectively, at a scale of 3.5 μm. These results demonstrate that disorder strength increases in accordance with the cell line’s tumorigenicity level and metastatic potential. Analysis at different length scales (1.25–3.5 μm) consistently showed higher values for metastatic cell lines than for the normal prostate cells.
The increase in , and hence disorder strength, with increasing tumourigenicity is attributed to changes in the configuration of DNA molecules’ distribution inside the nucleus. As cells become cancerous, compaction of the chromatin structure inside the nucleus occurs, increasing the fluctuation of nuclear DNA mass density.
“Based on the information generated from this innovative technology, we will not only be able to do cancer staging, but also effectively discriminate non-cancerous and cancer precursor cells early in the game and predict a patient’s prognosis,” said Subhash Chauhan, a collaborator from University of Tennessee Health Science Center.
To demonstrate how the technique could be used to predict cancer stages in unknown cell types, the researchers described a representative calibration framework for the prostate cancer example. The framework comprises an line plot of the measured structural disorder strengths, with the spread of values for each cell type colour coded. They note that a calibration curve for clinical application could be developed in a similar manner using data from extensive clinical studies.
The authors concluded that disorder strength could act as a potential biomarker to characterize carcinogenesis. “This technique will also be able to evaluate the efficiency of drug doses in cancer treatments, by quantitatively analysing recovery in the cell structure of cells after drug treatment,” Pradhan told medicalphysicsweb.