Motion tracking: Example image projections overlaid with the positions of the ground-truth target (green), shifted planning target volume (red), unshifted planning target volume (magenta), heart (dashed red) and diaphragm (blue). (Courtesy: Phys. Med. Biol. 10.1088/1361-6560/ac1834)
With a single radiation treatment, a patient’s irregular heartbeat will be corrected; but there’s a catch. This particular patient inhales unevenly but exhales smoothly, presenting an uncommon challenge to the patient’s care team: as the patient breathes unsteadily, their heart moves irregularly, so healthy heart tissues will receive some unwanted radiation.
Nicholas Hindley, an Australian Fulbright scholar and PhD candidate at the University of Sydney’s ACRF Image X Institute, may have found a ready solution to this problem. He and his collaborators developed an algorithm that tracks the diaphragm – the predominant driver of internal organ motion during a radiation treatment – in real-time using low-energy X-rays. The tracking algorithm would help a patient’s care team irradiate affected regions of the heart and avoid healthy tissue without needing any specialized equipment, just a standard linear accelerator and some code.
Irregular diaphragm motion? No problem
Hindley is driven by the increasing global burden of cardiac arrhythmias – abnormal heart rhythms – and the growing demand for timely, inexpensive and non-invasive treatments like cardiac radioablation.
“There has been a recent flurry of activity in the medical physics community to develop safe and effective ways for treating abnormal electrical activity in the heart using radiotherapy,” said Hindley. “The technology required for real-time tracking of targets and organs-at-risk is available now, without the need for fancy, expensive equipment. We simply need to complement existing hardware with clever software.”
Hindley’s latest work, published in Physics in Medicine & Biology, uses simulation studies to demonstrate that the research team’s diaphragm-tracking algorithm, combined with the imaging capabilities of a standard linear accelerator-based radiotherapy system, can focus radiation to certain regions of the heart while avoiding others, all while a patient breathes.
The algorithm uses pictures obtained with four-dimensional computed tomographic (4D-CT) imaging to figure out how far the heart moves relative to the diaphragm’s motion. This respiratory motion model is then used to track the diaphragm, and thereby the heart, in real-time during treatment. The method accounts for motion of the heart’s substructures by applying a uniform margin before treatment.
“There are many parameters within this method that may be tweaked, and the use of asymmetric margins is certainly one of them,” Hindley explains. “One could speculate that asymmetric margins may work well in an image-guided regime, since we know that the motion and deformation experienced by cardiac substructures is not uniform across the left–right, superior–inferior and anterior–posterior axes.”
Tracking performance: The first minute of a simulation showing the motion traces for the ground-truth target, shifted planning target volume and unshifted planning target volume centroid positions. (Courtesy: Phys. Med. Biol. 10.1088/1361-6560/ac1834)
Saving lives, improving quality of life
Hindley notes that their study is proof-of-concept as it uses digital phantoms developed by Paul Segars at Duke University. These digital representations of a patient, created using real patient images, are adjusted using biomechanical models so that researchers like Hindley can test their algorithms. Hindley plans to demonstrate the performance of the team’s code on real patient images using clinical trial data, anthropomorphic phantoms, or some combination of these.
One challenge Hindley foresees before the algorithm is implemented clinically is justifying the additional radiation dose the patient receives with X-ray imaging guidance. But he argues that the benefits outweigh the potential costs.
“This added radiation dose from X-ray imaging is miniscule when compared to the potential reductions in radiation with a more targeted approach,” Hindley says. “We hope tools like ours increase confidence for radiotherapy teams in treating these tricky targets. Over the long-term, we hope to facilitate the widespread adoption of cardiac radioablation, which has the potential to save or improve the quality of millions of lives every year.”
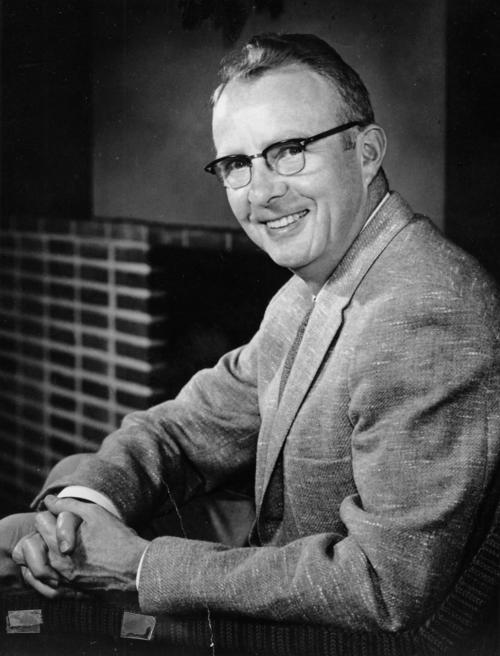
I don’t remember the first time I heard the theory that the dinosaurs were wiped out by an asteroid crashing into the Earth. It’s a dramatic story that gets told to wide-eyed children in classrooms and natural history museums at an earlier age than many can remember, so it feels more like absorbed knowledge. What is less commonly known, however, is that one of the originators of this proposal was Luis Walter Alvarez, who won the 1968 Nobel Prize for Physics for his work on the hydrogen bubble chamber.
But it wasn’t just dinosaurs and asteroids that Alvarez got excited about. Throughout his long and varied career, Alvarez was also involved in sending particle detectors into the sky in high-altitude balloons and searching for hidden chambers inside ancient Egyptian pyramids. It appears that his innate curiosity and experimental creativity, which were so vital for winning the Nobel prize, also led him to investigate many more questions both within physics and beyond.
Born in San Francisco in 1911, Alvarez studied at the University of Chicago and gained a PhD there too after building a cosmic ray telescope with Arthur Compton. He then moved to the University of California, Berkeley, working with nuclear scientist Ernest Lawrence to obtain the first observational evidence of K-electron-capture – the process by which a proton in a nucleus can absorb an atomic electron, turning into a neutron and emitting a neutrino. He also developed a method to produce beams of very slow neutrons; and, with Felix Bloch, measured the magnetic moment of the neutron.
His innate curiosity and experimental creativity, which were so vital for winning the Nobel prize, also led him to investigate many more questions both within physics and beyond
After war-time military research, including a stint on the Manhattan nuclear-bomb project, Alvarez returned to Berkeley, becoming an expert on particle accelerators. Most importantly, he led the development of the hydrogen bubble chamber in the 1950s, with which his team then discovered many particles and resonance states.
Luis Alvarez won the Nobel prize in 1968. (Courtesy: Lawrence Berkeley National Laboratory, courtesy AIP Emilio Segrè Visual Archives, W F Meggers Gallery of Nobel Laureates Collection, Physics Today Collection)
In the years between developing the hydrogen bubble chamber and winning the Nobel prize for it, however, Alvarez started taking his expertise out of the purpose-built lab and into real-world settings. In 1964 he proposed gathering data on high-energy particle interactions by sending lab equipment to high altitudes in balloons. This might sound like a whimsical idea, but it resulted in the High Altitude Particle Physics Experiment, which paved the way for the Cosmic Background Explorer (COBE) satellite.
Perhaps the 1960s brought Alvarez a flurry of out-of-the-lab inspiration, for it was in 1965 that he suggested a new investigation of the Egyptian pyramids. As unexpected a project as this sounds for a physicist, there was a key connection with his previous work; the idea was to place a particle detector underground beneath the pyramids to measure muons – one component of the cosmic rays constantly showering Earth. This is called muon tomography, and it can indicate hollow spaces in a structure through differences in the energies of muons coming from different directions.
Together with an international team of archaeologists and physicists, Alvarez spent a few years using this technique to search the Pyramid of Khafre – the second largest of the Pyramids of Giza – and the project was in full swing when he was awarded the Nobel prize. His biography published by the Nobel Committee at the time did not mention his archaeological exploits, which was perhaps no bad thing as, when the search concluded the following year, no chambers had been detected despite 19% of the pyramid having been scanned.
This null result might not sound exciting, but it was a meaningful one for archaeologists, and muon tomography has continued to be a useful tool in searching other structures. Speaking to Physics World in 2014, Arturo Menchaca, a physicist who has used muons to study the Pyramid of the Sun in Mexico, recalled once meeting Alvarez and referring to the project at the Pyramid of Khafre as having discovered nothing. “He furiously corrected me,” Menchaca said. “He had demonstrated there was nothing inside the pyramid.”
Since the pyramid project was well under way before Alvarez won the Nobel prize, it can’t have been this prestige that allowed him to pursue such a left-field idea. But perhaps the fact that he had already done such stellar (albeit more conventional) work in physics gave him the freedom and credibility to lead a team on this bold departure from the lab.
So when his son Walter, who was a geologist, told him about the mystery surrounding the dinosaur extinction, it was perhaps no surprise that Alvarez was quick to get involved. He enlisted the help of two nuclear chemists he knew at Berkeley – Frank Asaro and Helen Michel – to study the layer of sediment that represents, within multitudes of geological strata, the point in time when the extinction happened.
Perhaps the fact that he had already done such stellar (albeit more conventional) work in physics gave him the freedom and credibility to lead a team on this bold departure from the lab
The team discovered that the layer is hundreds of times richer in iridium than average, and suggested that an asteroid strike covered the Earth in the element and triggered the mass extinction event. The theory, now known as the Alvarez hypothesis, was hotly debated, and Alvarez defended it ardently right up until his death in 1988.
More evidence has accumulated over the years, not least the discovery of the huge Chicxulub impact crater under the Yucatán Peninsula in Mexico. Although there isn’t a complete consensus among geologists, the “Alvarez hypothesis” is now generally accepted as the most likely explanation for why the dinosaurs disappeared.
It’s hard to compare Alvarez’s eclectic mix of achievements with one another, for the very reason that they are in such disparate areas – he even looked into the assassination of President John F Kennedy. His bubble-chamber work will naturally be what physicists remember him for, but for the public, it was his research relating to asteroids and dinosaurs that captured the imagination. How remarkable that his Nobel-prize-winning work isn’t even his most famous achievement.
Physics World‘s Nobel prize coverage is supported by Oxford Instruments Nanoscience, a leading supplier of research tools for the development of quantum technologies, advanced materials and nanoscale devices. Visit nanoscience.oxinst.com to find out more.
A new optical transistor has been designed by researchers in Russia, Switzerland, and Germany. The team, led by Anton Zasedatelev at Skoltech in Moscow, used a combination of laser beams, an optical cavity, and a specialized organic polymer to trigger sudden switching between two distinct quantum states in their device. The transistor could be a promising step towards advanced optical computers, which have the potential to outperform their electronic counterparts.
The transistors at the heart of modern technology work by switching currents of electrons on and off. As electrons flow through circuits, they dissipate heat. Getting rid of this waste heat is a significant challenge in modern chips containing vast numbers of tightly-packed transistors.
A more energy efficient avenue involves quantum optics technologies. These replace the role of electrons with photons, which dissipate much less heat than electrons. In their study, Zasedatelev’s team developed a new concept for an optical transistor, This features an organic semiconducting polymer, sandwiched between the highly reflective walls of a light-trapping microcavity. The researchers direct two pulsed laser beams at the material: a bright “pump” laser, and a far weaker “seed” laser, which delivers just a few photons per pulse.
Light–matter hybrids
As the pump pulses bounced repeatedly between the cavity walls, their intensity is boosted by a factor of up to 23,000. This results in a strong coupling between the laser photons and the polymer’s organic molecules, generating groups of quasiparticles called exciton-polaritons – quantum particles that are a hybrid of light and matter.
When the seed pulses are switched on, it stimulates the exciton-polaritons to make a sudden transition from a quantum state with the same energy as the pump beam, to a Bose-Einstein condensate. The latter is an exotic state of matter comprising many identical exciton-polaritons in a collective ground state.
By measuring the difference between the number of exciton-polaritons in their ground state both with and without the seed beam, Zasedatelev and colleagues could reliably detect light at the single-photon level. As a result, their device could rapidly and efficiently switch between two possible logic states – making for an ideal optical transistor.
Faster and less power
Compared with the latest electrical transistors, the device exhibited numerous advantages: it requires 10,000 times less power and operates at room temperatures. In addition, it could perform some 1 trillion operations per second – at least 100 times faster than the most advanced electrical transistors available today.
Although the commercial rollout of the technology is still some way off, Zasedatelev’s team expect that further improvements could soon be made by replacing the organic polymer with perovskite crystals, which enhance the coupling between light and matter. This could enable the use of less intense pump lasers, further reducing power consumption. More broadly, the researchers hope that their transistor could become part of a growing toolkit of optical components, suitable for a new generation of vastly superior optical computers.
The UK government has released a long-term vision for the country’s burgeoning space sector. The National Space Strategy includes several measures that it says will “unleash” the industry’s potential and brings together – for the first time – the UK government’s civil and defence space activities. Yet while the strategy includes many bold aims, some state that it is recycling “old ideas”.
The report, released yesterday, notes that the global space economy is projected to grow from an estimated £270bn in 2019 to £490bn by 2030. The space sector in the UK is worth over £16.4bn per year and employs more than 45 000 people. Next year, the UK aims to become the first country to launch a rocket into orbit from Europe and by 2030 hopes to be a leading provider of commercial small satellite launches in Europe.
The strategy notes that while commercial space stations are being planned and built – and space-tourism operators are taking their first customers into orbit – advances in space are also a threat to information networks. “Space is changing,” the report notes, “the UK must respond”. The strategy therefore brings together science and technology, defence, regulation and diplomacy into what it calls a single “bold national vision”.
Cash will be the deal breaker
Chris Newman
The document includes a package of measures to “unlock growth in the UK space sector”. They include allowing space businesses to access private finance through “space-oriented venture capital funds”; maintaining the UK’s role in the European Space Agency while building new relationships with other countries; as well as collaborating on the NASA-led Artemis programme to return humans to the Moon.
The strategy also commits to the delivery of the UK’s first Defence Space Portfolio, which will see the government investing an additional £1.4bn – above the £5bn already committed to enhance the military’s satellite communications.
Chris Newman, a professor of space law at Northumbria Univeristy, claims that the new UK strategy is “more of a restatement of existing ideas rather than a new strategic direction”. He adds, however, that the proposal is “much more integrated in terms of defence and civilian than anything we’ve seen previously”. Newman says that while it is “nice to see mention of things like sustainability and applications of space data to climate change, cash will be the deal breaker.”
Solar power
Alongside the space strategy, meanwhile, the UK government has released a feasibility study into Space Based Solar Power (SBSP). The technique would involve placing satellites – adorned with photovoltaic panels – into geo-stationary orbit. The solar energy captured by the panels would then be beamed to a fixed point on Earth via radio waves.
The feasibility study, which examined two SBSP concepts — the US-led SPS Alpha and the UK-led CASSIOPeiA — states that the engineering challenges for SBSP could be overcome to allow enrolment of the technology by the 2050s to meet “Net Zero” emissions pledges.
The report states that a thorough cost and economic analysis should now be undertaken. The UK government has also stated that future funding will be made available for SBSP technologies through the £1bn Net Zero Innovation Portfolio.
X-ray dark-field chest imaging – a new technique touted as the most significant advance in standard chest X-ray in 100 years – has shown for the first time that it may help diagnose lung disease in humans, according to a study published in Radiology.
German researchers designed and built a prototype and tested the system in healthy patients. They confirmed X-ray dark-field chest imaging picks up signals in the lungs that are undetected in standard chest X-rays and established its qualitative and quantitative characteristics – a crucial step toward evaluating the new system in future trials.
“These findings prove that the dark-field signal is indeed sensitive to the subject’s lung condition alone and is independent from demographic factors, highlighting its potential value for diagnosis and monitoring of respiratory diseases,” write a team led by first author Florian Gassert of the Technical University of Munich.
The researchers first investigated X-ray dark-field chest imaging in 2008. In contrast to attenuation-based conventional radiography, dark-field imaging harnesses the wave properties of X-rays. Specifically, the system detects the signal of ultrasmall-angle scattering that takes place in water-to-air transitions in the alveolar structure of the lungs.
In attenuation-based radiography, dense structures generate a high signal, while in dark-field imaging, the small-angle scattering in lung tissue generates a high signal. Because dark-field X-ray imaging excludes unscattered photons, the space around the lungs appears dark (because there is no material there to scatter photons).
Since they developed the system, the researchers have conducted a number of animal studies that show the signal in X-ray dark-field chest imaging decreases in lung diseases that interfere with alveolar structure, such as emphysema, fibrosis, lung cancer and ventilation-induced lung damage.
In the current study, they sought to describe the qualitative and quantitative characteristics of X-ray dark-field images for the first time in humans.
Exploiting the wave properties of X-rays: Attenuation-based (A) and dark-field (B) radiographs of the thorax in a 33-year-old man. While attenuation-based images show attenuating structures, such as bones and soft tissue, dark-field images show the amount of tissue interfaces in the beam path. (Courtesy: Radiology)
Between October 2018 and January 2020, the researchers enlisted 40 healthy patients who underwent chest CT as part of their diagnostic workup. Inclusion criteria were a normal chest CT scan, the ability to consent and the ability to stand upright without help.
Importantly, the researchers developed a prototype that acquired both attenuation-based and dark-field chest radiographs simultaneously. Each patient’s total dark-field signal was correlated with his or her lung volume, and the dark-field coefficient was correlated with age, sex, weight and height.
The researchers found normal human lungs on dark-field chest X-ray imaging produced high signal, while the surrounding osseous structures had low signal and soft tissue produced no signal. The average total dark-field signal intensity over all participants for the entire lung was (17±4)×10-3 m2 and the total signal demonstrated a positive correlation with lung volume.
In addition, no differences were found between men and women, and age, weight and height did not influence the dark-field signal.
“Because of the nature of signal generation in dark-field imaging, bone structures and soft tissue generate only a minimal dark-field signal compared with lung tissue. This feature allows for a detailed depiction of lung tissue without impairment by surrounding structures. We found that the quantitative X-ray dark-field coefficient based on the total dark-field signal and lung size is independent from the subject’s characteristics,” the researchers write.
The team noted limitations, namely that only healthy subjects were included. However, future studies will assess abnormal changes in the lung tissue, they conclude.
In an accompanying editorial, Hiroto Hatabu and Bruno Madore of Harvard Medical School note that dark-field X-ray is still in its infancy – even results in animal models are still very preliminary – but that the work is an important step toward establishing normative values for dark-field X-ray chest imaging in humans.
Chest imaging has come a long way since it first emerged as a clinical test after the discovery of X-rays by Wilhelm Röntgen, yet through it, all X-ray imaging has continued to only exploit the particle aspect of X-ray photons rather than their wave aspects, they say.
“We welcome the addition of the dark-field approach to the universe of chest radiography methods available for human imaging and diagnoses,” Hatabu and Madore write.
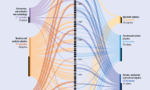
Nobel disciplines: this infographic shows all physics Nobel prizes in terms of subject area. Click to enlarge.(Courtesy: IOP Publishing)
We are getting excited here at Physics World because on Tuesday 5 October, the Nobel Prize for Physics will be announced. I have been writing about the physics Nobels for 15 years and now – as ever – I can honestly say that I have no idea who is going to win. And I am very happy about that.
For me, this uncertainty is the most exciting thing about the Nobel prize. There is no public shortlist and no-one except for the Nobel prize committee members has any clue about who will be getting the telephone call from Stockholm next Tuesday morning. What is more, nominations for the prize are kept secret for 50 years so it is impossible to know who has been in the running recently.
If you are interested in how the committee makes its decision – and the veil of secrecy surrounding it – check out this article I wrote about Lars Brink, a Swedish particle theorist who served on the Nobel Committee for Physics on eight separate occasions.
Bolts from the blue
For me, some of the most memorable prizes have come as bolts from the blue. These can be awards honouring important work that was done a very long time ago and all but forgotten by most Nobel pundits. My favourite example is the 2009 prize shared by Charles Kao, Willard Boyle and George Smith for work done in the 1960s on technologies that eventually made the Internet possible.
I also find it very exciting when the prize is given for recent work, which can equally come as a surprise. Indeed, just one year later in 2010, Andre Geim and Kostantin Novoselov were honoured for their isolation of graphene, which they did in 2004. Novoselov was just 36 when he bagged his prize, compared to Boyle who was 85.
Only once in the past 15 years have I predicted the Nobel winners. That was in 2013 when François Englert and Peter Higgs shared the prize for their theoretical prediction (made in the early 1960s) of the existence of the Higgs boson. That was an easy one because the Higgs boson was finally discovered experimentally at CERN in 2012 and it would have been a travesty if Englert and Higgs had not been honoured promptly.
Looking for patterns
Several years ago, I thought that I could improve my predictive powers by looking for patterns in how physics disciplines are favoured by the Nobel committee. As a guide, we produced the above infographic, which shows both the prevalence and chronological order of prizes in seven disciplines – and you can see the updated version above.
To me, the most striking recent feature in the infographic is the dominance of astronomy, astrophysics and cosmology prizes in the past decade. There have been four prizes in this discipline since 2011, with two in the past two years. The next most popular discipline is nuclear and particle physics, with two prizes in the past decade.
Since its inception in 1901, 11 Nobel prizes have been awarded (at least in part) in astronomy, astrophysics and cosmology. The first was in 1936 when Victor Hess shared one half of the prize for his discovery of cosmic rays. It took more than 30 years for the next prize to come round, which was bagged by Hans Bethe in 1967 for his work on nuclear reactions in stars. The 1970s, 1980s and 1990s saw at most two prizes per decade and it was not until the 21st century that numbers started to pick up.
Precision cosmology
Of these recent awards, I find the 2019 prize the most telling. Half of the award went to James Peebles for his theoretical work in cosmology. Peebles is celebrated for forging links between what had been the highly speculative world of cosmology and the increasingly precise observations of the universe being made by astronomers. This ushered in the era of “precision cosmology” whereby physicists have already made great strides in understanding the origins and nature of the universe.
The second half of the 2019 prize was shared by Michel Mayor and Didier Queloz for their discovery of the first known planet orbiting a Sun-like star. That discovery was made in 1995 using exquisitely precise observational techniques, which astronomers continue to improve on. So, if I am going to make a prediction, I would say to expect more Nobel prizes related to precision measurements of the cosmos.
Physics World‘s Nobel prize coverage is supported by Oxford Instruments Nanoscience, a leading supplier of research tools for the development of quantum technologies, advanced materials and nanoscale devices. Visit nanoscience.oxinst.com to find out more.
As scientists, one of the most frustrating things we can be told is “nice idea, but the technology to achieve it doesn’t exist yet”. Academic researchers rarely have enough time and resources to push the development of such technology forward, so these ideas invariably get shelved.
One such nice idea would be to use mass spectrometry to “see” metabolism – the chemical processes that underpin life itself – as they take place, to help our understanding of diseases. As you might imagine, the technology to do this doesn’t yet exist. But for once, a team of physicists, to which we belong, has been given both the time and resources to try and change that.
Mass spectrometry – where a sample is ionized to separate its components and measure them, based on the combined masses of its atoms – is one of the most sensitive and versatile techniques for studying the nature and interactions of molecules in a biological sample. The use of this century-old technique for biological applications has grown exponentially over the last 20 years, thanks to the discovery of “soft” ionization techniques, which allow researchers to analyse much bigger molecules than was ever possible before. Combined with the use of today’s improved computational power, mass spectrometry is now able to study everything from antibodies to viruses. Indeed, it allows researchers to identify, characterize and quantify proteins and other molecules present in biological samples.
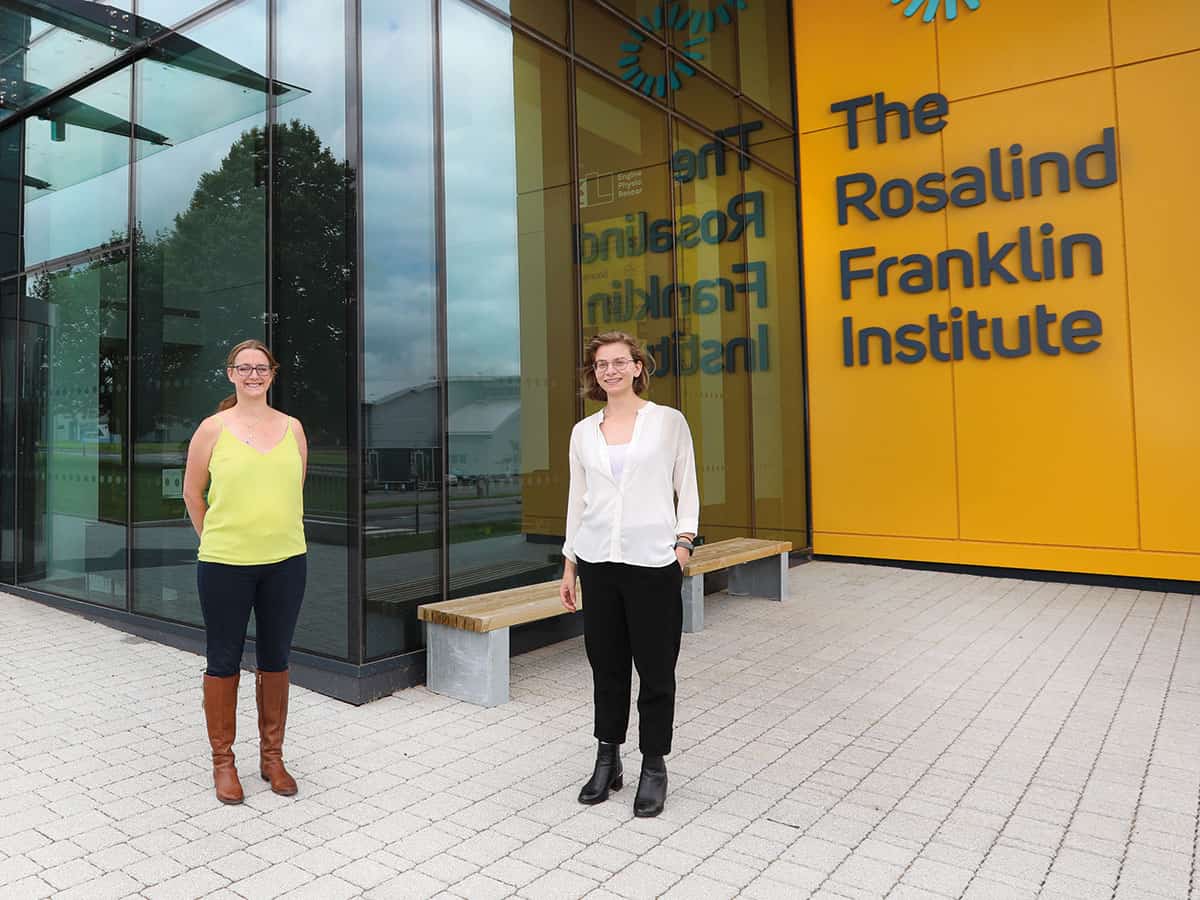
Instrumental imagers Felicia Green (left) and Anna Simmonds are part of a team at the Rosalind Franklin Institute that is developing a novel mass spectrometry instrument. (Courtesy: Rosalind Franklin Institute)
Our team, based at the Rosalind Franklin Institute in the UK, is primarily interested in two areas of mass spectrometry: mass spectrometry imaging and structural mass spectrometry. Mass spectrometry imaging allows images of biological tissue samples to be produced by collecting mass spectra in a spatially resolved manner. Structural mass spectrometry methods make the technique increasingly useful for studying the structure of biological molecules, not just their identity. However, to study everything that is happening in a biological tissue sample at the molecular level at one time requires a degree of complexity that isn’t currently possible.
What we need is the ability to measure things at a systems level, to see all the molecules in one place, even in something highly heterogenous, like a tumour sample. The goal is to be able to measure and identify all the metabolic substances, the lipids and many of the proteins, in their original spatial location. This would create a complete picture of metabolism in situ, alongside the key proteins that govern that metabolism at a cellular level. If specific molecular interactions can be related to a disease state, it could make a fundamental impact on our understanding of diseases and how they might be treated.
Setting the challenge
Our team, led by analytical chemists Josephine Bunch and Zoltan Takats, has set itself quite a challenge: to develop new mass spectrometry instrumentation that can make molecular maps of biological tissues at unprecedented sensitivity, chemical depth and spatial resolution.
To do this, we are tackling the three Achilles heels of mass spectrometry for biological imaging: size of molecules, speed and molecular identification. The goal is to be able to study both large and small molecules using the same instrument, while also making measurements faster and increasing their sensitivity. And not just that: the machine will also need to have subcellular spatial resolution and swiftly identify the structures of all species detected.
We are tackling the three Achilles heels of mass spectrometry for biological imaging: size of molecules, speed and molecular identification
As a first step, the various groups involved in the biological mass spectrometry project have, with industry partners, been developing instruments that use new technologies – such as a new type of ion source – and combining existing technologies for the first time. The goal set by the Franklin for technology development is to improve by a factor of 10 on what’s currently possible – but in reality, we’re looking at much more than that just for these initial individual instruments. If we are finally able to combine them all into one mass spectrometer, it’s almost impossible to calculate quite how extraordinary that could be. Even if, ultimately, creating that one mass spectrometer with all these capabilities just isn’t possible, those individual improvements we will have made in sensitivity, image resolution, ion mobility resolution, mass accuracy, mass resolution and speed will still have wide-ranging benefits.
Shape and structure
One of the planned instruments is a hybrid that incorporates two mass analysers, a time-of-flight (TOF) analyser and a Fourier-transform ion cyclotron resonance (FT-ICR) analyser. The team working on this brings together scientists from our institution, along with those from the National Physical Laboratory and Imperial College London in the UK, as well as the global analytical instrumentation company Bruker. This hybrid instrument is being developed in parts, with the team currently spread across three locations and two countries. Ensuring that each piece works well independently is important, but we also have to make sure that all the pieces will fit together when we start to combine them, so we’re in frequent communication with each other to share our progress and ideas.
The high throughput of the TOF analyser in the hybrid instrument allows the rapid spectral acquisition necessary for high spatial-resolution MSI experiments, while the FT-ICR allows unparalleled mass resolution and access to many ion-manipulation techniques that will make it possible to probe the structure of biological molecules, not just their identity. The instrument will also include a tandem trapped-ion mobility spectrometry (TIMS) device, which can in addition analyse the structure of biomolecules as well as separate out the components of biological samples based on their shape (Analyst143 2249). We are currently working on modelling multiple possible geometries of the device, to explore how ions travel through it, as well as studying how the device would be able to direct ions into either one of the mass analysers.
1 The hybrid imaging instrument A schematic of the hybrid mass spectrometer, including a multimodal ion source, a tandem trapped-ion mobility spectrometry device and both a time-of-flight mass analyser and a Fourier-transform ion cyclotron resonance mass analyser. (Courtesy: Rosalind Franklin Institute)
To generate ions from biological samples, we are also designing a multimodal imaging source that will be coupled to the hybrid mass spectrometer. This source will include multiple ionization techniques to provide choice and flexibility over a number of aspects, including the pixel size of the resultant mass spectrometry image; which classes of biomolecules are ionized; and how much preparation needs to be performed on the sample prior to its analysis. We still need to make significant improvements to obtain the required sensitivity, while at the same time producing data that can be interpreted. With this in mind, we’re planning to include post-ionization techniques to increase the number of molecules detected from each sampling location, as well as to improve the range of biomolecules detected from tissues.
A prototype of the multimodal ion source has been developed and installed on a Bruker timsTOF fleX mass spectrometer. The current iteration of this ion source includes atmospheric pressure “matrix-assisted laser desorption/ionization” (MALDI) – an ionization technique that uses a laser-absorbing matrix to create ions from molecules, with minimal fragmentation – in both transmission and reflection modes. The set-up has successfully demonstrated an enhancement of detected ion intensity, by plasma post-ionization (Analytica Chimica Acta1051 110). This set-up has the ability to complement the molecular information collected by commercially available MALDI systems, by allowing a number of different chemical components to be analysed.
We currently use in-house software to control the source, which allows real-time processing of data to create a live mass spectrometry image, as the data are being acquired. It also provides feedback control of experimental parameters in an on-the-fly manner. As the software is highly modular, it will allow us to easily incorporate new additions, as the instrument evolves. Work is also under way on a new atmospheric-pressure interface that will improve the transmission of ions from the multimodal ion source into the mass spectrometer. Traditional interfaces are based on simple capillaries, which tend to have significant transmission losses when transporting ions and charged clusters into vacuum. By exploring novel inlet designs, we aim to create a new inlet that is customisable to each mode of the source, thereby significantly increasing our transfer yields, and improving the overall sensitivity of the set-up.
Protein problems
Analysing proteins, in particular, using mass spectrometry imaging is a key challenge for scientists, as proteins are often large and challenging to extract from biological samples. “Bottom-up” techniques aim to study proteins by digesting them (almost always enzymatically) into smaller fragments, which can then be “reconstructed” into the original protein. Unfortunately, these techniques often use liquid-phase reactions (such as “liquid chromatography” – a technique used to separate and analyse a mix of proteins) that are incompatible with mass spectrometry imaging, and require significant sample preparation and time.
With this in mind, we have developed an “atmospheric pressure glow discharge device” that can digest proteins and other large molecules in situ. A glow discharge is a plasma that forms when an electric current flows through a gas; and such plasmas have long been used as ionization sources in mass spectrometry. By developing this device, we aim to produce unique, consistent and spatially resolved markers from proteins, which could be subsequently analysed by mass spectrometry imaging. This would represent a dramatic reduction in sample preparation and, crucially, would retain the valuable spatial information in native samples. Another mass spectrometer we have planned will exploit new developments in the use of water cluster beams for molecular desorption, which can enhance sensitivity 100-fold while reducing and controlling the fragmentation during surface sampling. It will help us to retain sensitivity at very low pixel sizes and ensure full coverage across the types of biological molecules detected.
Snapshot in time
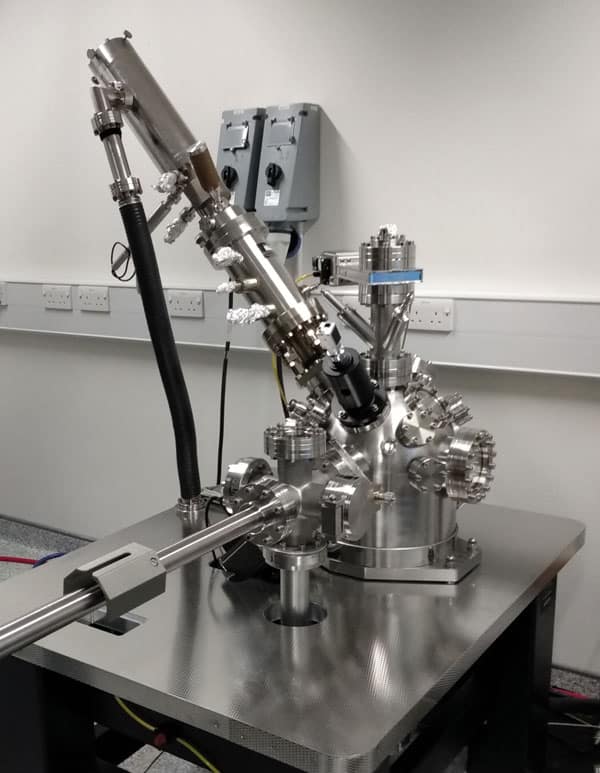
Yet another instrument we’re developing as part of the theme will use mass spectrometry in “microscope mode” and is based on secondary-ion mass spectrometry (SIMS), in which the specimen’s surface is sputtered using a focused primary ion beam, and the analysis is done by collecting ejected secondary ions.
Joint endeavour The stigmatic SIMS at the first stage of the build, including the C60+ primary ion gun and chamber of the instrument, installed at the University of Oxford. (Courtesy: Rosalind Franklin Institute)
Our “stigmatic” (microscope) SIMS instrument allows for rapid molecular mapping of biological tissues at unprecedented speed, as it decouples acquisition time from spatial resolution. Typically, mass spectrometry imaging works by scanning across a surface, and taking a mass spectrum at each spot, to build up the pixels of the image. In this case, however, the whole surface is imaged simultaneously using state-of-the-art cameras that operate as an array of position- and time-sensitive detectors, recording a mass spectrum for each pixel in the camera image (Rapid Commun. Mass Spectrom.27 2745).
This instrument design is a joint endeavour between the Franklin, chemists at the University of Oxford and staff from the ion-beam technology company Ionoptika. The ion source was built, tested and installed at Oxford by Ionoptika. Typically, SIMS is used for microprobe analysis, which uses a highly focused (~500 nm) primary ion beam, so the next stage required us to produce a uniform defocused beam (~2 mm) for microscope mode. This involved detailed modelling and simulation of the primary ion dynamics, and experimental measurement to ensure beam size and uniformity at the sample, before we could consider secondary ions and imaging. The Oxford team’s expertise in adapting complementary metal oxide semiconductor (CMOS) sensors into pixelated time-sensitive cameras (Phys. Chem. Chem. Phys. 16 383) will allow us to develop spatially sensitive detection systems that record the arrival position and time of each secondary ion with nanosecond timing resolution. By combining new ion beam technology (J. Am. Soc. Mass Spectrom.31 1903) and fast detectors, our team aims to improve both mass and spatial resolutions while maintaining rapid imaging. This would mean a mass spectrometry image of a standard tissue biopsy would take seconds rather than hours or days, paving the way for routine analysis.
The next stage of development will take place at the Franklin’s new hub building, which opened on the Harwell Campus near Oxford this year. The Franklin’s mission is to develop new technologies that can have a major impact on the life sciences, by pushing the boundaries of physical sciences. The building has been designed to house the new technologies being developed under each of the institute’s key research areas – which include artificial intelligence and structural biology, among others – as well as providing space for the teams to work together on further innovations. Bit by bit, we’ll be moving our novel instruments, developed at different sites around the UK, into their new home. Then we’ll need to see if we can combine them all together, turning that “nice idea” into reality.
Elastomers that undergo large spectral shifts in colour when stretched very little have been developed by researchers in the US and South Korea. The material scientists say that these liquid crystalline elastomers with an unusually large Poisson’s ratio could have a variety of uses, from visual displays to smart windows.
Colour can be produced by the absorbance of light by dyes and pigments. Any wavelengths not absorbed reflect back and create the colour that we perceive. But colour can also be produced by nanoscale structures that scatter and reflect light. Indeed, such structural colours represent some of the brightest colours in the natural world.
There has been a lot of research interest in creating structural colours. As well as having the potential to be brighter, they offer other advantages over dyes and pigments. The nanostructures are more robust and longer lasting, and scientists claim they could be more environmentally friendly. They can also be engineered to scatter non-visible light, with reflection of infrared light having potential applications for passive cooling.
One challenge that material scientists have struggled with, however, is creating structural colouration that can change colour. One way to do this is to mechanically deform the material. The problem with this approach, says Shu Yang, an engineer and materials scientist at the University of Pennsylvania, is that you have to stretch it a lot. To shift from red to blue you would need to stretch the typical liquid crystal elastomers used by at least 40%, and in some cases by as much as 70%, she explains.
Now, Yang and her colleagues have managed to create an elastomer that can colour shift from near-infrared to ultraviolet wavelengths when stretched by less than 20%. They describe their work in Nature Materials.
Pressure-activated displays
To create structural colour, the team used chiral nematic liquid crystalline elastomers. When these elastomers are produced, a chemical dopant encourages the molecules to form helixes. It is these helixes that create the structural colour, with the wavelengths reflected dependent upon their dimensions. If the material is stretched, the helixes compress and the material’s colour changes.
Yang tells Physics World that when one of her colleagues was playing around with the production of these liquid crystalline elastomers to improve the uniformity of the helixes and therefore the colour, they managed to produce a very soft material. It turned out that the elastomers the team created had an unusually large Poisson’s ratio. This means that when you stretch them in one direction, they compress much more than you would expect in the other plane. “That is why we are able to have a very large wavelength change at a small strain,” Yang says.
Next, the researchers used the elastomers to create pneumatically actuated displays. They 3D printed a plastic base containing circular cavities connected by air channels, and then sealed a layer of their new elastomer on the top, creating a series of colour “pixels”. Pumping air into the channels inflates the elastomer membranes, causing them to stretch and changing the colours that they reflect. The colours can be controlled by varying the pressure and the size of the cavities in the 3D-printed base.
Creating structural colour: The pixelated platform includes a base with air channels, a supporting layer and a pneumatically actuated membrane of chiral nematic main-chain liquid crystalline elastomer (MCLCE). (Courtesy: Nat. Mater. 10.1038/s41563-021-01075-3)
The researchers demonstrated that an increase in pressure of just 9.6 kPa was enough to switch the wavelengths reflected by the pixels from near-infrared through red, green and blue to ultraviolet. They also showed that by using multiple air channels to activate groups of pixels, or individual pixels, they could create displays such as number countdowns.
As well as displays, the researchers suggest the material could be used for colour-changing soft robots and cryptic colouration, such as disruptive imaging and countershading. Yang says that because the material changes colour when subjected to a very small deformation, it could be used to create temperature, pressure or mechanical sensors.
Yang also suggests that the material may be suitable for building smart windows that reflect more infrared light as the ambient temperature rises. “That’s one of the interests, whether we can use the heat induced expansion of the air,” she tells Physics World.
When a simple system of two liquids is driven out of equilibrium, it can generate a far more diverse array of structures than previously thought, new experiments have shown. The discovery was made by Jaakko Timonen, Nikos Kyriakopoulos and colleagues at Aalto University in Finland, who identified structures including filaments, lattices, and square-shaped droplets, when applying electric fields to thin sheets of different combinations of conductive, polarizable oils.
If two liquids are brought together, they will usually settle into the steady state of thermodynamic equilibrium. Depending on their miscibility and relative densities, they can form uniform mixtures (such as water and ethanol), separated layers (such as oil floating on top of water) – or emulsions such as mayonnaise. Far more interesting behaviour can emerge if these systems are driven out of thermodynamic equilibrium by the application of external forces such as an electric field.
Non-equilibrium behaviours underly a wide array of fascinating phenomena: from the emergence of unexpected patterns within materials, to collective motions of self-propelling microbes. As a result, they are of immense interest across different numerous fields: from physics to biology. With existing theories, however, it can be incredibly challenging to predict the nature of the complex states that emerge.
Polarized oils
To shed new light on two liquid systems, the Aalto team designed a new set of experiments involving several different oils: each with different densities and electrical conductivities; and which become electrically polarized to different degrees when electric fields are applied.
When a thin sheet of any combination of two of the oils was subjected to an electric field, charges would build up at the interface separating them. Through the effect of electrohydrodynamic shearing, these charges were set into motion, driving the entire system out of equilibrium. The result was a wholly unexpected diversity of patterns and shapes.
At low levels of shearing, the researchers identified symmetry breaking at the interface between the oils, creating 1D patterns of corrugation. When shearing was slightly stronger, topological changes at the interface gave rise to microfilaments that rolled and rotated about their axes, and which could connect to form intricate networks.
Strong shearing
Alternatively, the oils could also form 2D lattices – which are virtually unheard of in liquids. When shearing was at its strongest, the system transitioned into square, hexagonal, and doughnut-shaped droplets, which could actively propel themselves forwards.
Timonen’s team hope that their discoveries could soon enable researchers to create temporary droplets, filaments, and lattices with well-defined sizes, which could be turned on and off by an applied voltage. If achieved, this could lead to many exciting applications: including controllable optical devices, and the ability to mimic the dynamics of swimming microbes, such as bacteria and algae.
A new memory assessment technique could pave the way for earlier diagnosis of Alzheimer’s disease, the underlying cause of around 60% of dementia cases. The approach uses electroencephalography (EEG) to measure brain activity while participants watch flashing images on a computer screen.
Current diagnostic tests for Alzheimer’s disease are not effective during its early stages, meaning that Alzheimer’s is typically only diagnosed late in the disease process. As such, there’s a real need for early diagnosis tools that could enable the timely initiation of lifestyle interventions to slow the rate of cognitive decline. Such a tool could also help drug development, through earlier and more accurate identification of dementia patients in clinical trials.
The research team developing the new EEG-based test, led by cognitive neuroscientist George Stothart from the University of Bath, think that it could lower the age of diagnosis by up to five years in the near future. In the longer-term, the technique – known as Fastball EEG – has potential to improve this further.
EEG works by using multiple electrodes placed on the scalp (in an EEG cap) to record the brain’s electrical activity. Fastball uses a method called fast periodic visual stimulation (FPVS), which measures brain signals as the subject views a series of rapidly presented images, a few of which are repeated at slower intervals. The technique is highly effective at picking up small, subtle changes in brain waves that occur when a person remembers an image.
The big advantage of Fastball EEG is that it is completely passive. The person performing the test is not given any instructions prior to the task, which is important as dementia patients may struggle to follow complex instructions, and is not asked to reflect on, respond to or remember any items. The technique is also low-cost, non-invasive and uses technology that’s already available in hospitals.
“Fastball offers a genuinely novel way of measuring how our brain is functioning,” Stothart explains in a press statement. “The person being assessed doesn’t need to understand the test, or even respond, they simply watch a screen of flashing images and by the way we manipulate the images that appear we can learn an enormous amount about what their brain is, or is not, able to do.”
Fastball trials
The FPVS procedure induces two discrete frequency responses in the EEG, which reflect the participant’s periodic neural responses to the stimuli. The first reflects visual processing at the image presentation frequency. The second mirrors the brain’s response to previously seen images and reflects the patient’s recognition memory. Analysing the EEG spectrum at this second, slower frequency can quantify the patient’s memory response.
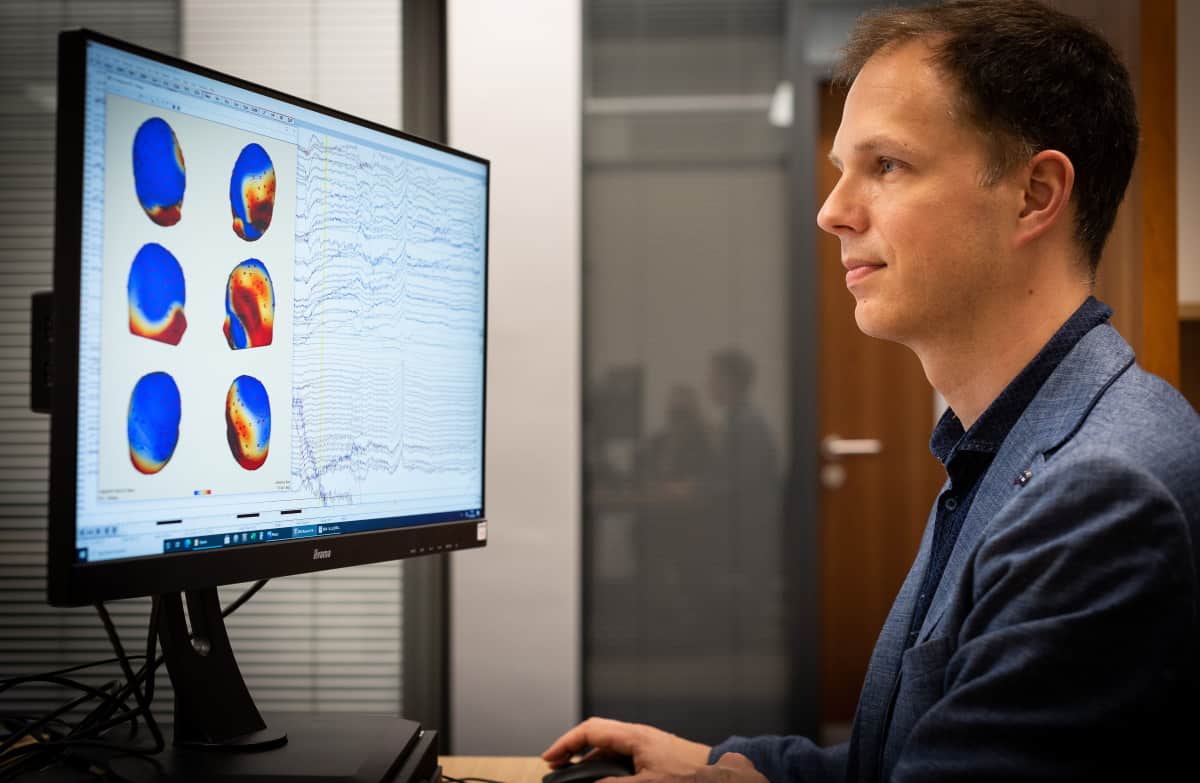
Data analysis: George Stothart examines the Fastball EEG data. (Courtesy: Nic Delves Broughton/University of Bath)
In a study reported in Brain, Stothart and collaborators tested Fastball EEG in 20 patients with Alzheimer’s disease, 20 healthy older adults and 20 healthy younger adults. Participants performed the Fastball task, which took less than 3 min, under three conditions: recognition, repetition and control. In the recognition condition, eight images were viewed beforehand, and then repeatedly shown within a stream of unique previously-unseen images. In the repetition condition, the eight images were not seen in advance but were repeated during the Fastball task. In the control condition, subjects only viewed a stream of novel images.
For both the recognition and repetition conditions, Fastball EEG detected significantly impaired recognition memory in Alzheimer’s disease patients compared with healthy older control subjects. There were no differences between the two groups under the control condition, where image recognition was not included. The Fastball test could also discriminate Alzheimer’s disease patients from healthy older adult controls, with an accuracy of 86%. No significant performance differences were seen between older and younger healthy controls.
After the Fastball task, participants completed a forced-choice task, in which they had to identify a previously seen image from two alternatives. Here, the researchers observed little difference between Alzheimer’s disease patients and controls, suggesting that Fastball was more sensitive to memory performance than this behavioural recognition test.
The researchers conclude that this new method for measuring visual recognition memory is sensitive to changes in recognition memory processes in Alzheimer’s disease that would be missed by behavioural testing alone. “The tests we currently use to diagnose Alzheimer’s miss the first 20 years of the disease, which means we are missing huge opportunities to help people,” says Stothart. “Ultimately, the Holy Grail of a tool like this would be a dementia screening tool used in middle age for everyone, regardless of symptoms, in the same way we test for high blood pressure. We are a long way from that, but this is a step towards that goal.”
The team has now extended the approach into earlier stages of dementia, examining subjects with mild cognitive impairment, which for some people (although not all) is a precursor to Alzheimer’s disease. “We are conducting a longitudinal study of patients with mild cognitive impairment using an expanded battery of Fastball tasks designed to capture a range of cognitive functions,” Stothart tells Physics World.