Transportation accounts for 23% of energy-related carbon dioxide emissions and electrification is a pathway toward ameliorating these growing challenges. All solid-state batteries could potentially address the safety and driving range requirements necessary for widespread adoption of electric vehicles. However, the power densities of all solid-state batteries are limited because of ineffective ion transport at solid–solid interfaces.
New insight into the governing physics that occur at intrinsic and extrinsic interfaces are critical for developing engineering strategies for the next generation of energy dense batteries. However, buried solid–solid interfaces are notoriously difficult to observe with traditional bench-top and lab-scale experiments.
In this talk, Kelsey Hatzell will discuss opportunities for tracking phenomena and mechanisms in all solid-state batteries in situ using advanced synchrotron techniques. Synchrotron techniques that combine reciprocal and real-space techniques are capable of tracking multi-scale structural phenomena from the nano- to meso-scale.
This talk will discuss the role that microstructure plays on transport and interfacial properties that govern adhesion. Quantification of salient descriptors of structure in solid-state batteries is critical for understanding the mechanochemical nature of all solid-state batteries.
Kelsey Hatzell is assistant professor of mechanical engineering, assistant professor of chemical and biomolecular engineering, and Flowers Family Dean’s Faculty fellow in engineering at Vanderbilt University. Her research focuses on printable materials and understanding electrochemistry at interfaces as well as solution-processed material synthesis of low-dimensional materials for energy storage and water desalination application. She earned her BS/BA in engineering/economics from Swarthmore College; MS in mechanical engineering from Pennsylvania State University, US; and PhD in material science and engineering at Drexel University, US. Hatzell has received research awards including the Sloan Fellowship in Chemistry (2020), POLiS Award for Excellence (2021), MRS Nelson “Buck” Robinson Science and Technology Award for Renewable Energy (2019), ECS Toyota Young Investigator Fellowship (2019), Oak Ridge Associated Universities (ORAU) Ralph E Powe Award (2017), and NSF CAREER Award (2018). She was also a Scialog research fellow in energy storage and negative emissions technologies. She joins the faculty of Princeton University School of Engineering and Applied Science and the Andlinger Center for Energy and the Environment (ACEE) in the fall.
The electrons in certain magnetic bilayer materials behave very differently depending on whether the two layers are twisted left or right with respect to each other. This finding from researchers at East China Normal University in Shanghai could shed fresh light on so-called moiré systems and aid the development of new two-dimensional materials for optoelectronics and perhaps even energy storage devices.
In 2018, scientists at the Massachusetts of Technology (MIT) showed that “twisted” bilayer graphene – made by stacking two sheets of graphene on top of one another, and then rotating one of them so that the sheets are slightly misaligned – could support a wide array of insulating and superconducting states, depending on the strength of an applied electric field. When placed on top of each other in this way, the graphene sheets form a moiré pattern, or superlattice, in which the unit cell of the two-dimensional material expands as though it were artificially stretched in the two in-plane directions. This expansion dramatically changes the material’s electronic interactions.
Twist angle
The twist angle in twisted bilayer graphene in important. The MIT study, for example, showed that at an angle of 1.1°, the material switches from an insulator to a superconductor, capable of carrying electrical current with no resistance at temperatures below 1.7 K.
In the new work, researchers led by Chun-Gang Duan studied a particular crystalline phase of vanadium diselenide, 2H-VSe2. This material belongs to a family of bilayer transition-metal dichalcogenides (TMD) designated 2H-MX2, where M is a transition metal and X is a chalcogenide such as sulphur or selenium. Using first-principle calculations on a twisted supercell of this material, the Shanghai team found that the material responds very differently to an applied external electric field depending on whether the sheets are right- or left-twisted with respect to each other at an angle near 30°.
Rare effect
The researchers explain that this exotic property stems from the electrons in the sheets redistributing themselves according to the direction in which the lattices are stacked.
When an external electric field is applied to a neutral atom, an electric dipole (a pair of negative and positive charges) usually forms. The induced dipole moment, or polarization (which is defined as pointing from the negative charge towards the positive charge with a size that equals the strength of each charge multiplied by the separation between the charges) generally points in the same direction as the external field.
In the case of right-twisted 2H-VSe2 sheets, however, no apparent electric dipoles form when an electric field is applied. In the left-twisted case, electric dipoles do form, but the induced polarization can even align in the opposite direction to that of the applied field – an effect that is very rare in nature.
“Since this is a novel magnetoelectric property, there could be many possible applications,” Duan tells Physics World. “These include energy storage devices, negative capacitors and new-generation optoelectronics.”
The researchers, who report their work in Chinese Physics Letters, say they now hope to detect such magnetism-mediated dielectric polarization in laboratory experiments.
Researchers in Iran have used a deep neural network (DNN) to extract the foetal electrocardiogram (ECG) from a single abdominal ECG channel. Their method, described in Physiological Measurement, may improve foetal monitoring in the future.
How to isolate foetal ECG?
Currently, the electrical activity of a foetus’ heart is measured using an ECG acquired from electrode patches placed on the expectant mother’s abdomen. Clinicians can use the foetal ECG to evaluate foetal health and diagnose abnormalities.
The challenge? It’s difficult to isolate the foetal ECG signal from abdominal ECG because the latter contains signals from both the foetus (“foetal ECG”) and the mother (“maternal ECG”), as well as from sources of interference, such as muscle contractions. This task becomes even more demanding toward the end of pregnancy, when the amplitude of the foetal ECG signal is comparable to that of the maternal ECG.
Arash Rasti-Meymandi, lead author on the study and a graduate student at the Iran University of Science and Technology, and his colleagues thought of a potential solution to this problem that relies on DNNs.
Arash Rasti-Meymandi (left) and Aboozar Ghaffari from Iran University of Science and Technology.
Rasti-Meymandi was inspired by Unets, convolutional networks that are often used in medical image segmentation tasks. He and co-author Aboozar Ghaffari applied a modified version of a Unet to extract first the maternal ECG and then the foetal ECG signals.
“The Unet was able to outperform other techniques in image segmentation challenges,” Rasti-Meymandi says. “To extract different components of the abdominal ECG, we examined the abdominal ECG signal at different resolutions, [similar to the process used in a Unet model].”
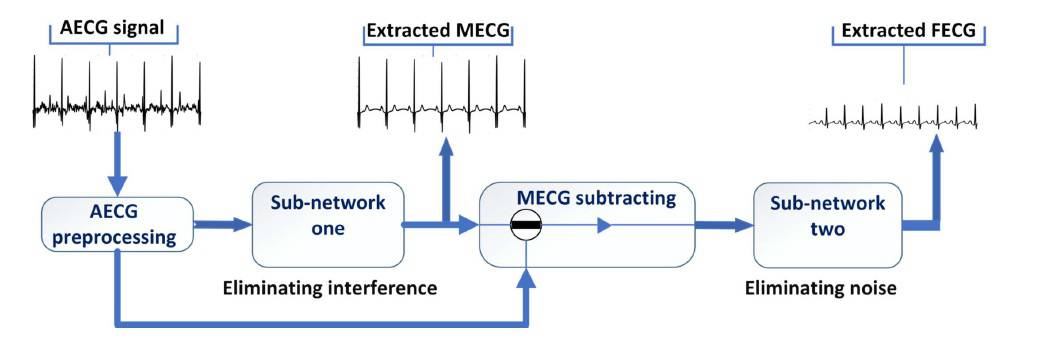
The researchers’ DNN – called AECG-DecompNet – extracts the foetal ECG from a single channel of abdominal ECG using two sub-networks in series. The first sub-network extracts the maternal ECG signal; the second, the foetal ECG. The researchers trained the two sub-networks separately using simulated ECG signals and then evaluated the sub-networks using both simulated and real abdominal ECG recordings.
AECG-DecompNet processes the abdominal ECG signal by first extracting the maternal ECG signal and then recovering the foetal ECG signal. (Courtesy: Physiol. Meas. 10.1088/1361-6579/abedc1)
Using a graphics processing unit, the researchers’ DNN could process four seconds of abdominal ECG recording in approximately one second.
The future of DNNs and foetal ECG
Unlike other signal denoising methods, which require the morphology (P, Q, R, S and T waveforms indicating the heart’s electrical activity) of a reference ECG, multiple channels of ECG, or both, the researchers’ method requires only a single channel. This not only improves the mother’s comfort during ECG acquisition but also requires fewer resources and less time to implement than traditional ECG recording and signal extraction methods.
The researchers also found that relative to other methods, theirs better preserved the shape and structure of foetal ECG signals – all five waveforms were well-preserved for examination and diagnosis of foetal abnormalities.
“The primary result of this research is the effectiveness of using DNNs to extract foetal ECG signal from a single-channel abdominal recording with high precision,” Rasti-Meymandi tells Physics World. “We are currently working on a more sophisticated algorithm … to further increase the accuracy of the extracted heart rate.”
The team is also working on ways to implement their DNN in real-time on smartphones.
Limitations of their method include a potential overreliance on the training dataset, especially when the foetal ECG signal is weak, and the potential for errors to be propagated to the second sub-network from the first.
Have physicists at Fermilab found evidence for a new force? In this episode of the Physics World Weekly podcast Sam Grant of University College London explains why he and his colleagues on Fermilab’s Muon g-2 experiment are excited about their recent measurement of the muon’s magnetic moment and what it could mean for the future of particle physics. Grant also talks about how the experiment is searching for the elusive electric dipole moment of the muon and what it is like to work at Fermilab during the pandemic.
Cattle produce vast amounts of methane, which is a potent greenhouse gas. Physicists are developing new technologies that could help to reduce the amount of gas emitted per kilogram of milk or meat produced, as science writer Michael Allen explains in the second segment of the podcast. Allen also talks about how the piezoelectric properties of wood can be enhanced by treating it with fungus – which could soon bring us wooden floors that generate electricity from our footsteps.
As scalable quantum computers move closer to reality, researchers need better ways of measuring and controlling the delicate systems that comprise them. One method, known as quantum state tomography, uses repeated measurements across the entire system to reveal the quantum state. However, this powerful diagnostic tool becomes impractical as quantum systems grow larger because in its conventional form, the number of measurements required increases exponentially with the size of the system. Now, researchers at the University of Queensland have applied a “self-guided” tomography method that more easily determines the quantum states encoded in the spatial shape of packets of light. This experiment opens the doors for using self-guided tomography on a wide array of quantum systems.
A two-dimensional quantum object is called a qubit in analogy with classical bits, but the same concept can be generalized to a higher number of dimensions. The resulting higher-dimensional object is usually called a qudit, and it can be equivalent to many entangled qubits. “Most quantum systems are actually higher dimensional, and we just ignore, or sometimes actively empty, most of our higher-dimensional system for it to become a qubit, ” says Markus Rambach, a researcher at the University of Queensland, Australia and lead author of the study, which is published in Physical Review Letters.
Rambach’s team showed that these higher-dimensional quantum objects could, in principle, be used to characterize the quantum state of large entangled systems in an efficient way. The team created its qudits using devices called spatial light modulators (SLMS), which function like a transparency on an old-fashioned overhead projector: they only allow a certain shape of light – a quantum state – to pass through perfectly. While one SLM prepares the initial quantum state, creating superpositions of ring-like patterns of light, another SLM performs the analysis measurement and sends the light through an optical fibre to a detector. Then, the researchers apply the self-guided tomography method to the second SLM, iteratively tweaking the “transparency” until the two SLMs perfectly align, providing them with the correct quantum state.
A more practical way to uncover quantum states
To understand how self-guided tomography works, picture a quantum state as an intricate cathedral steeple in the middle of a barren landscape, standing out as a flash of colour above the monotony. To capture the beauty of that building using conventional quantum state tomography, you would need to paint a picture of the entire landscape, spending just as much effort on the rocks and sky as you do on the Gothic architecture. This would require a lot of time and paint, and moving to an ever higher dimensional space would be even worse – like having a larger landscape to consider while the tower stays the same size.
Finding the right path: Starting from a random point within the quantum space, this new self-guided tomography performs averaged measurements and reaches the ideal quantum state, labelled by the red arrow, using fewer resources than conventional methods. (Courtesy: American Physical Society)
In contrast, self-guided tomography directs your attention more rapidly towards the church. Taking into consideration just a few portions of the broader landscape, your gaze quickly settles on the space near the building, bringing it into sharp focus. Then you create a detailed sketch of only the region of interest – the bell tower, the stainedglass windows, and the carefully planted garden. This method is similar to the gradient descent methods popular in machine learning. However, while gradient descent narrowly follows the path of maximal change, and can therefore get stuck in local extrema, self-guided tomography only moves in the optimal direction on average. By using repeated averages, it therefore converges to the global maximum, representing the desired quantum state.
In a quantum landscape, how close you are to that ideal quantum state is quantified by the fidelity, which ranges from 0% for no overlap to 100% for two identical states. The self-guided tomography method shows that increasing the number of iterations of the algorithm makes it possible to reach ever higher fidelities, even for high-dimensional qudits. “To get to the same fidelity as in standard tomography, we need less resources or less copies of the unknown state,” Rambach says.
Performing measurements with the power of light
Using photons as quantum systems enabled the team to perform measurements very rapidly, collecting hundreds of thousands of samples per second. However, since not all quantum systems are capable of quickly preparing many copies of the unknown state, the researchers also performed a separate low photon count experiment, measuring in a regime with high statistical noise. Although the absolute number of iterations required did increase in this noisier region, the trend of achieving continuously increasing fidelities with more iterations remained the same. This means that other quantum systems can take advantage of the same computational speedup.
As a member of the Australian Research Council Centre of Excellence for Engineering Quantum Systems, Rambach foresees many other research groups within the centre using self-guided tomography in all types of quantum architectures. “We are currently reaching out to experimentalists in other systems to see who is keen to pick up our method, to actually use it in their experiments,” he says.
Gamma ray detectors used in positron emission tomography (PET) scanners must combine high spatial, timing and energy resolution with excellent sensitivity. Current clinical PET scanners employ pixelated scintillation detectors with a spatial resolution limited by their pixel size. Another option is to use a monolithic crystal detector, read out by a photodetector array, which offers increased sensitivity and resolution. Already implemented in preclinical PET systems, such monolithic detectors may soon also appear in clinical scanners.
Monolithic PET detectors, however, bring their own challenges, such as a lengthy calibration setup and edge effects. Another key task when using a monolithic detector is to design an efficient and accurate gamma event positioning algorithm, with limited degradation in performance towards the edges of the crystal. To achieve this, researchers at Ghent University have used artificial neural networks to create a high-resolution gamma positioning algorithm. They describe their study in Physics in Medicine & Biology.
“We chose to investigate neural networks as they can be trained to directly infer the continuous interaction position from the measured light distribution, based on example data,” explains first author Milan Decuyper. “They can learn to optimally process events near the edges and, once trained, positioning events is fast and parallelizable.”
The Ghent University researchers (left to right): Milan Decuyper, Mariele Stockhoff, Stefaan Vandenberghe and Roel Van Holen.
Network optimization
PET scanners work by detecting the pair of 511 keV gamma rays produced when a positron emitted by a radiotracer annihilates with an electron. Forming a line-of-response between the pair enables localization of their source. However, some of the gamma rays undergo Compton interactions within the crystal before the final photoelectric interaction, making recovery of the first interaction position more difficult.
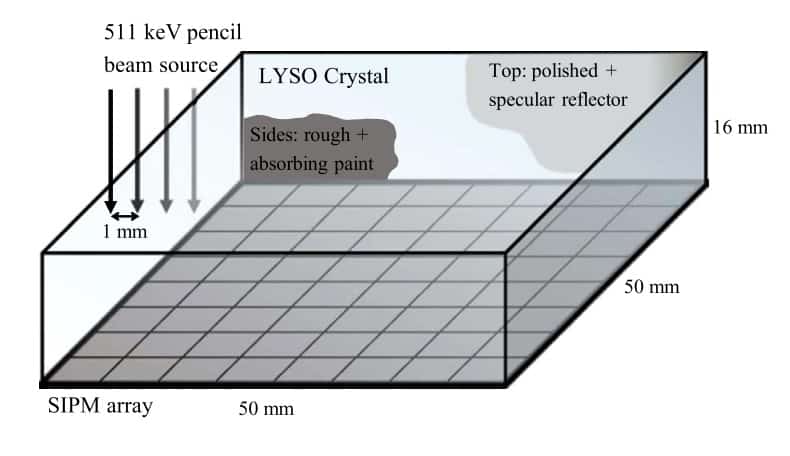
The simulated detector setup. (Courtesy: Phys. Med. Biol. 10.1088/1361-6560/abebfc)
Decuyper and colleagues trained a neural network to learn the mapping between the measured light distribution and the first (Compton or photoelectric) interaction position in a monolithic crystal. For their study, they simulated a 50×50×16 mm LYSO (Lu1.8Y0.2SiO5) crystal, irradiated with a 511 eV source and read out by an array of photodetectors.
The researchers simulated a training dataset that covered the detector in 1 mm steps, with 10,000 training events and 2000 evaluation events per position. In the simulation, around 60% of events were Compton scattered. They also created an independent “overfitting” dataset in the detector centre, using grid points offset by 0.5 mm from the training grid.
To assess performance as a function of network complexity, the team examined networks with two to five hidden layers and 64 to 1024 neurons in each layer. When evaluated using data from the same grid as the network was trained on, the most complex network gave the best performance. However, when evaluating intermediate positions that were not part of the training dataset, the researchers saw that performance degraded with more complex networks. They point out that this illustrates the potential pitfall of overfitting.
The team also assessed performance as a function of the amount of training data. The positioning error significantly reduced as training events per calibration position increased from 100 to 1000, and then levelled off. Optimal performance was achieved with a network containing three hidden layers of 256 neurons trained on 1000 events per position.
Over the entire detector, this optimal network achieved mean and median spatial resolutions (the 2D FWHM of the predicted position) of 0.50 and 0.46 mm, respectively. The distance between the ground-truth and the predicted position was 1.1 mm on average, with a median of 0.50 mm. In the central 30×30 mm region, the spatial resolution improved to 0.41 mm, with equivalent positioning accuracy.
Comparing the performance of the neural network with that of a nearest neighbour algorithm approach that the team developed previously demonstrated that 0.46 mm represents a 17% improvement in spatial resolution over nearest neighbour positioning.
Extension to three dimensions
Another benefit of monolithic detectors is that they offer intrinsic depth-of-interaction (DOI) information, which can improve the timing resolution. The team extended the neural network to output the estimated DOI (an additional z coordinate). This gave similar performance to the 2D positioning network, with almost no impact upon the spatial resolution. The mean and median 3D positioning errors were 1.53 and 0.77 mm, and the mean and median DOI errors were 0.87 and 0.39 mm, respectively.
Investigating the influence of Compton scatter revealed that it considerably reduced positioning accuracy, with the mean positioning error increasing from 0.49 for non-scattered events to 2.29 mm for Compton scattered events. Compton scatter also degraded the spatial resolution, with median values of 0.66 and 0.42 mm FWHM for scattered and non-scattered events, respectively.
While identifying and removing Compton events could improve image quality, it would also considerably decrease sensitivity. A better approach, the team suggests, may be to train neural networks to identify Compton scattered events and process them differently.
The researchers conclude that neural networks can perform 3D gamma ray positioning with very high spatial resolution, superior to previous approaches. They are now evaluating their experimental PET detector using the same configuration as in the simulation setup. “This allows us to see how our methods and results based on simulation data transfer to experimental data,” Decuyper tells Physics World.
The mass production of high-performance perovskite solar cells could soon become easier now that researchers in Taiwan and the US have discovered a simple alteration to the manufacturing process. The technique was developed by Leeyih Wang at National Taiwan University and colleagues, who showed that it boosts both the power conversion efficiency and operational lifetime of a perovskite mini-module. Their innovation could soon open new routes towards the large-scale manufacture of perovskite solar cells, making them a strong competitor to existing silicon-based cells.
Perovskite materials are widely seen as some of the most promising candidates for low-cost, large-area solar cells. Owing to their excellent optoelectronic properties, recent experiments have demonstrated conversion efficiencies as high as 22%, over areas of 0.5 cm2. So far, however, similar performances on larger scales have been hindered by the difficult manufacturing requirements of thin perovskite films.
Currently, the fabrication process usually involves dripping an antisolvent onto a perovskite precursor that has been spin-coated onto a substrate. Ideally, this technique can create films with uniform, high-quality crystal structures. However, the conditions of the process must be tightly controlled, and the antisolvent must be applied within a time window of just 9 s following the initial deposition. Otherwise, the resulting perovskite film could be rough and uneven – diminishing its performance as a solar cell. As films become larger, it becomes increasingly difficult to implement this process.
New antisolvent
To combat this issue, Wang’s team, which also included researchers at Los Alamos National Laboratory, introduced a technique that significantly broadened the post-deposition time window. They did this using sulfolane as an antisolvent, which enabled them to fabricate uniform, high-quality, and large-area perovskite films in their experiment. To investigate the molecular mechanisms responsible for this improvement, they studied the chemical reactions involved using a combination of X-ray diffraction and infrared spectroscopy.
They found that hydrogen bonding between sulfolane molecules and perovskite precursor ions slowed down the crystallization process significantly, thereby extending the time window for antisolvent addition to 90 s. This enabled compact, highly uniform crystal structures to form in far less stringent processing conditions. To demonstrate this improvement, Wang and colleagues fabricated a perovskite solar cell mini-module with an active area of 36.6 cm2.
Their device achieved a very respectable power conversion efficiency of over 16%, and retained around 90% of its initial performance after operating for 250 hours at 50 °C – the point at which it extracted the maximum possible amount of power. This high efficiency and long operational lifetime set the stage for large-scale perovskite solar cell production, in far more flexible manufacturing conditions. Wang’s team hope that the technology could soon become widely available commercially and may even become a viable competitor to silicon-based solar cells – boosting the outlook for renewable solar energy.
For solar cells, efficiency really matters. This crucial metric determines how much energy can be harvested from rooftops and solar farms, with commercial solar panels made of silicon typically achieving an efficiency of 20%. For satellites, meanwhile, the efficiency defines the size and weight of the solar panels needed to power the spacecraft, which directly affects manufacturing and launch costs.
To make a really efficient device, it is tempting to pick a material that absorbs all the Sun’s radiation – from the high-energy rays in the ultraviolet, through to the visible, and out to the really long wavelengths in the infrared. That approach might lead you to build a cell out of a material like mercury telluride, which converts nearly all of the Sun’s incoming photons into current-generating electrons. But there is an enormous price to pay: each photon absorbed by this material only produces a tiny amount of energy, which means that the power generated by the device would be pitiful.
Hitting the sweet spot
A better tactic is to pick a semiconductor with an absorption profile that optimizes the trade-off between the energy generated by each captured photon and the fraction of sunlight absorbed by the cell. A material at this sweet spot is gallium arsenide (GaAs). Also used in smartphones to amplify radio-frequency signals and create laser-light for facial recognition, GaAs has long been one of the go-to materials for engineering high-efficiency solar cells. These cells are not perfect, however – even after minimizing material defects that degrade performance, the best solar cells made from GaAs still struggle to reach efficiencies beyond 25%.
Further gains come from stacking different semiconductors on top of one another, and carefully selecting a combination that efficiently harvests the Sun’s output. This well-trodden path has seen solar-cell efficiencies climb over several decades, along with the number of light-absorbing layers. Both hit a new high last year when a team from the National Renewable Energy Laboratory (NREL) in Golden, Colorado, unveiled a device with a record-breaking efficiency of 47.1% – tantalizingly close to the 50% milestone (Nature Energy5 326). Until then, bragging rights had been held by structures with four absorbing layers, but the US researchers found that six is a “natural sweet spot”, according to team leader John Geisz.
Getting this far has not been easy, because it is far from trivial to create layered structures from different materials. High-efficiency solar cells are formed by epitaxy, a process in which material is grown on a crystalline substrate, one atomic layer at a time. Such epitaxial growth can produce the high-quality crystal structures needed for an efficient solar cell, but only if the atomic spacing of each material within the stack is very similar. This condition, known as lattice matching, restricts the palette of suitable materials: silicon cannot be used, for example, because it is not blessed with a family of alloys with similar atomic spacing.
Devices with multiple materials – referred to as multi-junction cells – have traditionally been based on GaAs, the record-breaking material for a single-junction device. A common architecture is a triple-junction cell comprising three compound semiconductors: a low-energy indium gallium arsenide (InGaAs) sub-cell, a medium-energy sub-cell of GaAs and a high-energy sub-cell of indium gallium phosphide (InGaP). In these multi-junction cells, current flows perpendicularly through all the absorbing layers, which are joined in series. With this electrical configuration, the thickness of every sub-cell must be chosen so that all generate exactly the same current – otherwise any excess flow of electrons would be wasted, reducing the overall efficiency.
Bending the rules
Key to the success of NREL’s device are three InGaAs sub-cells that excel at absorbing light in the infrared, which contains a significant proportion of the Sun’s radiation. Achieving strong absorption at these long wavelengths requires InGaAs compositions with a significantly different atomic spacing to that of the substrate. Additionally, their device has been designed with intermediate transparent layers made from InGaP or AlGaInAs to keep material imperfections in check. Grading the composition of these buffer layers enables a steady increase in lattice constant, thereby providing a strong foundation for local lattice-matched growth of sub-cells that are not riddled with strain-induced defects.
The NREL team, which has pioneered this approach, advocates the so-called “inverted variant” structure. With this architecture, the highest energy cell is grown first, followed by those of decreasing energy, so that the cells lattice-matched to the substrate precede the growth of graded layers. This approach improves the quality of the device, while the fabrication process also results in the removal of the substrate – a step that could trim costs by enabling the substrate to be reused.
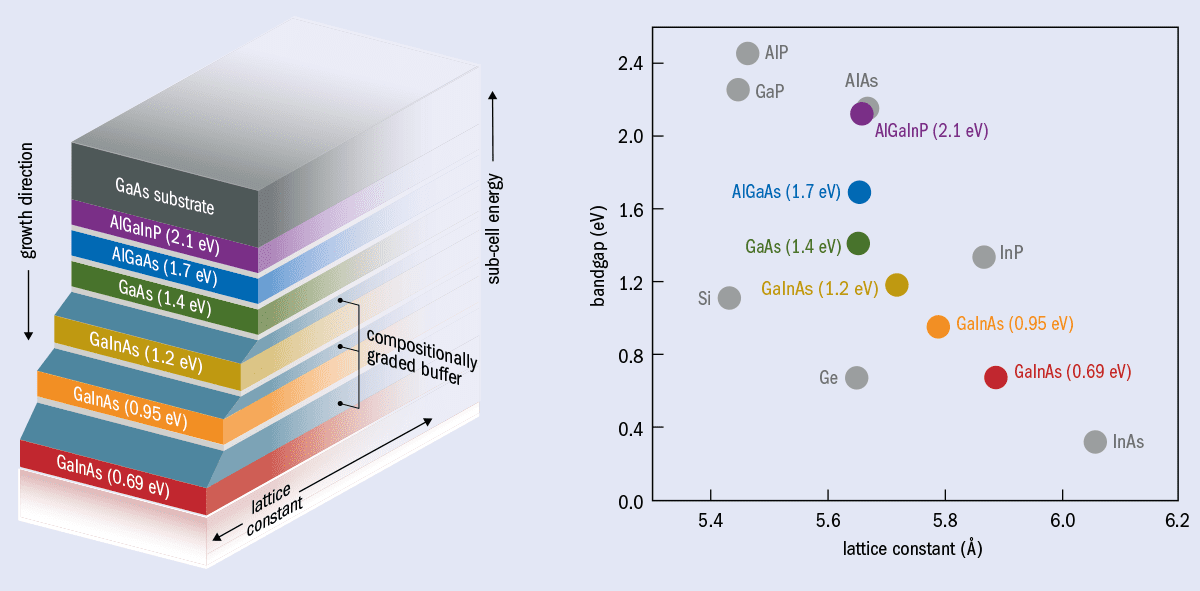
1 Record breaker The device produced by researchers at the National Renewable Energy Laboratory in Golden, Colorado, has six sub-cells that absorb solar radiation at different wavelengths (left). The sub-cells at the bottom of the device have low-energy bandgaps that absorb infrared radiation, but their lattice constant is significantly larger than those of the high-energy sub-cells and the GaAs substrate (right). Graded buffer layers smooth out the differences in lattice spacing and prevent the formation of strain-induced defects. (Courtesy: NREL)
One other technique that can further boost solar-cell efficiency is to focus sunlight on the cells, either with mirrors or lenses. The intensity of light on a solar cell is usually measured in “suns”, where one sun is roughly equivalent to 1 kW/m2. Concentrated sunlight increases the ratio of the current produced when the device is illuminated compared to when it is in the dark, thereby boosting the output voltage and increasing the efficiency. The gain is considerable: the NREL device achieves a maximum efficiency of just 39.2% when tweaked to optimize efficiency without any concentration, a long way short of the 47.1% record.
When Geisz and colleagues assessed how the performance of their six-junction cell varies with concentration, they found that peak efficiency occurs at 143 suns. Nevertheless, the device still produces a very impressive 44.9% efficiency at 1116 suns, which would generate a large amount of power from a very small device. As a comparison, a record-breaking cell operating at 500 suns could deliver the same power as a commercial solar panel from just one-thousandth of the chip area. At such high concentrations, however, steps must be taken to prevent the cell from overheating and diminishing performance.
Just over a decade ago, this approach to generating power from high-efficiency cells spawned a concentrating photovoltaic (CPV) industry, with a clutch of start-up firms producing systems that tracked the position of the Sun to maximize the energy that could be harvested from focusing sunlight on triple-junction cells. Unfortunately, this fledgling industry came up against the unforeseeable double whammy of a global financial crisis and a flooding of the market with incredibly cheap silicon panels produced by Chinese suppliers. The result was that so few CPV systems were deployed that even on a sunny day when all operate at their peak, their global output totals less than one-tenth of the power of a typical UK nuclear power station.
Extra-terrestrial encounters
Far greater commercial success for makers of multi-junction cells has come from powering satellites, most recently buoyed by the rollout of satellite broadband by companies such as OneWeb and Starlink. The key advantage here is that high-efficiency cells can drive down the costs of making and launching each satellite. As well as reducing the number of cells needed to power the spacecraft, higher efficiencies shrink both the size and weight of the solar panels that form the “wings” of the satellite. While launch costs have plummeted over the last few decades, satellite operators can still expect to pay almost $3000 per kilogram to get their spacecraft into orbit – and thousands of satellites are due to be deployed over the next few years.
For a solar cell in space, the crucial metric is the value at the end of its lifetime – after the device has been bombarded by radiation
However, for a solar cell in space, the crucial metric is not the initial efficiency but the value at the end of its intended lifetime after the device has been bombarded by radiation. Compound semiconductors hold up to this battering far better than those made from silicon. Early studies showed that the difference in efficiency of compound semiconductors rises with age from 25% to 40–60%, which ensured the dominance of triple-junction cells for space applications. Even so, the efficiencies of the best commercial cells for satellites remain limited to around 30–33%. This is partly because the solar spectrum beyond our atmosphere has a stronger contribution in the ultraviolet, where it is much harder to make an efficient cell, and partly because there are no concentrating optics to focus sunlight onto the cell.
To drive down the watts-per-kilogram of solar power in space, a US team working on a project known as MOSAIC (micro-scale optimized solar-cell arrays with integrated concentration) has been making a compelling case for CPV in space. The team points out that it should be relatively easy to orientate the solar panels on a satellite to maximize power generation with lenses in front of the cells shielding them from radiation. Concentrations must be limited to no more than around 100 suns, however, because cells in space cannot be cooled by convection, only by heat dissipation through radiation and conduction.
Concentrated power Focusing sunlight onto a high-efficiency cell can produce more energy from a single solar device. This approach has not been commercially successful for terrestrial power generation, but a slimmed-down version of the technology could have a future in space. (Courtesy: SolFocus)
For CPV to have a chance of succeeding in space, the large and heavy solar modules used in early terrestrial systems must be replaced with a significantly slimmed-down successor. Technology pioneered by project partner Semprius, a now defunct CPV system maker, excels in this regard. The firm developed a process that uses a rubber stamp to parallel-print vast arrays of tiny cells, each one subsequently capped by a small lens.
The best results have come from stacking a dual-junction GaAs-based cell on top of an InP-based triple-junction cell separated by a very thin dielectric polymer. Current cannot pass through this polymer film, so separate electrical connections are made to extract the current from each cell independently. While this doubles the number of electrical connections, it eliminates the need for current matching between the two devices. Lifting this restriction gives greater freedom to the design, potentially enabling this approach to challenge the efficiency of NREL’s record-breaking device under high concentrations. Operating at 92 suns under illumination which mimics that in space, the team’s latest device, still to be fully optimized, has an efficiency of 35.5%.
Towards 50%
The NREL researchers know what they need to do to break the 50% barrier. The goal they are chasing is to cut the resistance in their device by a factor of 10 to a value similar to that found in their three- and four-junction cousins. They are also well aware of the need to bring down the cost of producing such complex multi-junction cells.
Also chasing the 50% efficiency milestone is a team led by Mircea Guina from Tampere University of Technology in Finland. Guina and colleagues are pursuing lattice-matched designs with up to eight junctions, including as many as four from an exotic material system known as dilute nitrides – a combination of the traditional mix of indium, gallium, arsenic and antimonide, plus a few per cent of nitrogen.
Dilute nitrides are notoriously difficult to grow. Back in the 1990s, German electronics powerhouse Infineon developed lasers based on this material, but they were never a commercial success. More recently, Stanford University spin-off Solar Junction showcased the potential of this material in solar cells. Although the start-up went to the wall when CPV flopped, devices produced by the company grabbed the record for solar efficiency in 2011 and raised it again in 2012 with triple-junction designs. Guina and co-workers are well positioned to take their technology further. They have made progress in producing all four of the dilute nitride sub-cells needed to produce record-breaking devices, and their efforts are now focused on optimizing the high-energy junction. The team’s work has been delayed due to the COVID-19 pandemic, but Guina believes that the approach could break the 50% barrier, possibly raising the bar as high as 54%.
There is still a question of impetus, however. The lack of commercial interest in terrestrial CPV may well encourage Guina to change direction and focus on chasing the record for space cells with no concentration. Much of today’s multi-junction solar-cell research is not focusing on power generation here on Earth, so while that 50% milestone is tantalizingly close, it might not be broken anytime soon.
New research shows that the humble egg white could hold the answer to a long-standing mystery about the evolution of gels. In a paper published in Physical Review Letters, scientists at the University of Tübingen led by Frank Schreiber used ultrasmall angle X-ray scattering to show that cooked egg white is dynamic gel that continues to evolve long after solidifying. They attribute the unusual dynamics to rupturing of protein bonds and show that these events are highly correlated. This research has profound implications both for the food industry and the fundamental study of phase transitions.
Cheese, coagulated blood and cooked egg white are all common examples of gels. Though they behave as solids, these materials are mostly liquid; rigidity is imposed by a “skeleton” of solid particles that spans the material in a branched network. Egg whites, for example, start out as proteins swimming around in water, but heat forces them to unfurl and stick together, triggering gelation.
Gels exist out of equilibrium and so continue to evolve by relaxing into lower energy states long after the gelation transition. The group in Tübingen was motivated by a long-standing debate over whether the ageing of gels progresses continuously or via sudden intermittent rupturing of particle bonds. There was no research on the ageing of protein gels because of the challenge posed by studying structures without a single characteristic length scale; it is not clear whether the basic building block of a gel is the individual proteins or the long chains. In fact, the full dynamics can only be captured by studying the gel simultaneously at length scales of both the diameter of a few proteins and the length of the branches in the network (hundreds of nanometres to microns)
X-ray photon correlation spectroscopy (XPCS) is a technique that measures correlation between scattered photons. It is widely used to measure the dynamics of disordered materials but in its conventional configuration would only measure the motion of individual proteins. The researchers adapted XPCS for studying gel dynamics by combining it with ultrasmall-angle X-ray scattering, a state-of-the-art technique that probes up to large length scales.
Separating structure and dynamics
Schreiber and his colleagues performed XPCS on a sample of egg white as it was heated and observed the growth of a branched network structure. The structural evolution of the gel appeared at first to be incompatible with ageing as the complexity of the network and the average size of the branches changed very little with time.
However, far from being static, the gel exhibited intermittent motion. This was too fast to be diffusion and instead indicated the sudden rupturing of the protein–protein bonds. Intriguingly, relative to their size, long chains were more dynamic than single proteins, a behaviour that seems to be unique to this system.
Stress redistribution
These length-scale-dependent dynamics disappear over time, which the researchers believe is a clue as to how the gel can be dynamic without its overall structure changing. Because it is disordered, unusually large stresses become locked into certain regions of the gel. They propose that the rupturing of bonds in these regions redistributes the stresses, reducing spatial fluctuations in the gel without changing its average structure. Over time, as the gel becomes homogeneous, the length-scale-dependent dynamics disappear, and the gel evolves via a larger number of smaller rearrangements.
The most striking dynamical behaviour of the gel was that as well as evolving with time, the bond- rupturing events were not independent. Periodic variation in the relaxation time of the gel was observed, this has not been seen before and indicates that the rearrangement events are correlated. Whether this is a particular property of egg whites or a universal gelation behaviour being observed for the first time is not yet clear. It indicates that the gel can be split into substructures; a “fast” gel that mediates bond rupturing and a “slow” gel that preserves the original structure during ageing.
Most research on gel ageing uses either synthetic particles or simulations, but it seems that not for the first time, nature is a more intuitive scientist than we are. On the significance of the research, Schreiber says, “In the future, this will allow us to understand dynamics of different biological macromolecules in a broader range and more fundamentally.” By applying physical principles to these systems, this research could bridge the gap between thermodynamics and biology.
The errors that arise from the volatile nature of quantum technologies are a major roadblock on the path to practical quantum computing. We can imagine getting past this blockade by driving straight through it, using a car built to withstand the impact: this is quantum error correction. Alternatively, we might try to drive around the obstacle, bypassing the original problem entirely. To that end, researchers are investigating Majorana fermions – curious quantum objects that are their own antiparticles and are thought to be naturally resilient to quantum errors. So far, however, these quantum objects have proven difficult to create and control.
Researchers at the University of Maryland, US have now identified a more experimentally feasible way to generate Majorana fermions, potentially paving the way for Majorana-based quantum computation. In a paper published in Physical Review Letters, they show that a simple physical system can serve as a flexible platform for observing and manipulating these particles. The platform’s utility derives from its simplicity, says Ruixing Zhang, a postdoctoral researcher at Maryland and lead author of the study. “We don’t have to create additional structures. Nature gives us everything we need,” he says.
Majorana modes pose major challenges
Majorana fermions are not single particles like the electron or the photon. Instead, they are a template for a certain type of particle. After the Italian physicist Ettore Majorana predicted their existence in 1937, physicists hoped that some elementary particles might fit this mould, but subsequent experiments ruled this out for all known particles except the neutrino.
More recently, the Majorana fermion has taken on new life in the confines of ultracold quantum systems. In this context, Majorana fermions can manifest as collective oscillations of electrons. These electronic undulations are called quasiparticles because they behave in many ways like elementary particles, but emerge from the intricate interplay of many particles. Majorana fermions of this type live on the edges of their host materials and are the starting point for generating so-called Majorana zero modes (MZMs), which have zero energy and are further localized as point objects. The MZMs, in turn, can be used to build naturally error-resistant qubits.
Majorana modes are, however, notoriously elusive. In part, this is because it is hard to create the conditions required to generate them in an experimental setting. Many theoretical proposals have predicted MZMs should be present in quasi-2D materials, which consist of a small number of 2D layers stacked on top of each other. However, all previous proposals required heterostructures – that is, structures where the stacked layers have differing material composition and structure. Practically, these heterostructures are difficult if not downright impossible to grow.
To make matters worse, Majorana modes can only be observed indirectly. Like detectives trying to catch a culprit with only circumstantial evidence, physicists have a hard time ruling out alternative explanations for the phenomena they observe. This has led to high-profile premature claims of Majorana discovery, including Microsoft Quantum Lab’s recent retraction of a Nature paper in which they purported to observe MZMs in nanowires.
Study lead author Ruixing Zhang is a postdoctoral researcher at the University of Maryland’s Condensed Matter Theory Center and its Joint Quantum Institute. (Courtesy: Ruixing Zhang)
Ironing out problems
In their new work, Zhang and his coauthor show that Majorana modes should be present in a much simpler setting: thin films of an iron-based superconducting material. Like previous proposals, the system they study is quasi-2D, but crucially all layers are of the same kind. The iron-based thin films naturally accommodate Majorana fermions that are helical – left or right-handed – and move along the edges of the system in their preferred direction. This is due to a special “time-reversal” symmetry, wherein interchanging the left-moving and right-moving quasiparticles makes it look like time is propagating backwards in the system.
With these thin films, making MZMs from helical Majorana fermions is relatively simple. When a magnetic field is applied to the system, the Majorana modes shift from being spread out around the edges of the system to localizing in its corners. Rotating the magnetic field has the effect of transporting each Majorana mode from one corner to another. This magnetic knob can be used to “braid” the Majoranas, which is the cornerstone for logic gates – controlled operations required to perform computation – in topological quantum computers.
At its core, Zhang’s analysis has real-world applications in mind. The thin films he studies can be grown one layer at a time using a technique known as epitaxy, and all of the essential ingredients that are mixed together to produce helical Majorana modes have been previously realized and observed experimentally. Zhang’s work also shows that an electric field, which is easy to apply experimentally, can serve as a “topological switch” for controlling the emergent quasiparticles.
What’s more, the researchers also propose a new “smoking gun” for confirming the presence of MZMs based on this corner localization. Traditional techniques, which involve analyzing the material’s transport properties, are experimentally challenging and have trouble disqualifying alternative explanations. Zhang’s new method, which centers around measuring the particle density across the thin film, is easier to implement, and facilitates catching the slippery suspects.
The road ahead
The path to large-scale quantum computing is protracted and precarious, but Zhang believes his work shows that it might be more feasible than previously thought to build a quantum computer out of Majorana modes – something that could help overcome the significant issue of quantum errors. “The first step is establishing the possibilities,” he says. “Next, we need to create a blueprint.”


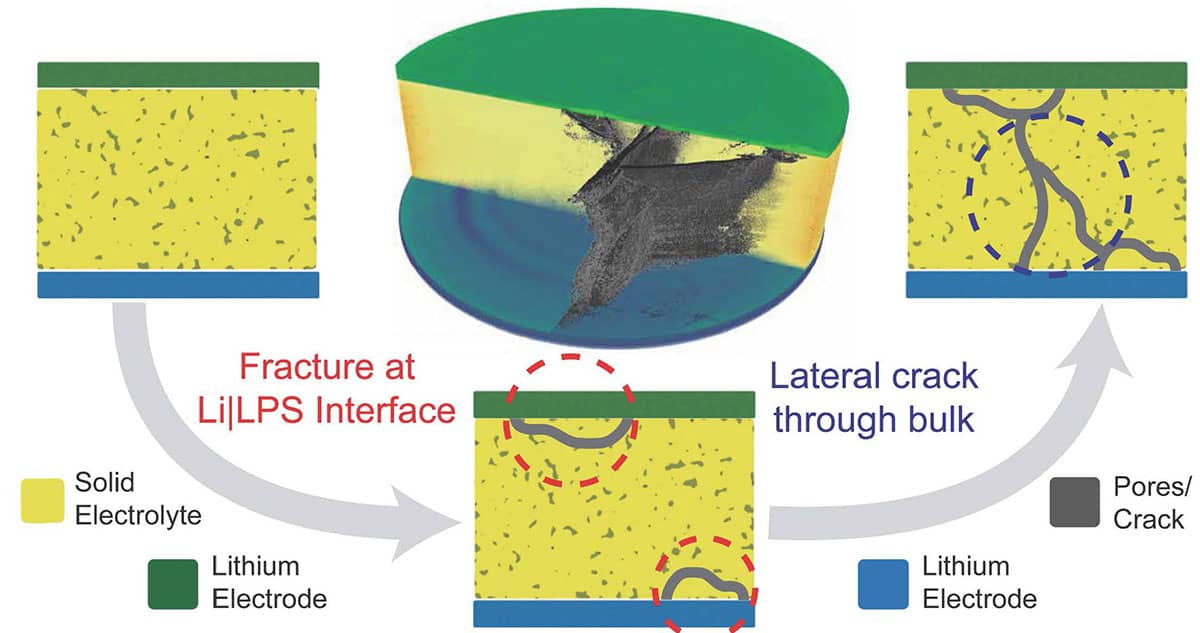 Transportation accounts for 23% of energy-related carbon dioxide emissions and electrification is a pathway toward ameliorating these growing challenges. All solid-state batteries could potentially address the safety and driving range requirements necessary for widespread adoption of electric vehicles. However, the power densities of all solid-state batteries are limited because of ineffective ion transport at solid–solid interfaces.
 Kelsey Hatzell is assistant professor of mechanical engineering, assistant professor of chemical and biomolecular engineering, and Flowers Family Dean’s Faculty fellow in engineering at Vanderbilt University. Her research focuses on printable materials and understanding electrochemistry at interfaces as well as solution-processed material synthesis of low-dimensional materials for energy storage and water desalination application. She earned her BS/BA in engineering/economics from Swarthmore College; MS in mechanical engineering from Pennsylvania State University, US; and PhD in material science and engineering at Drexel University, US. Hatzell has received research awards including the Sloan Fellowship in Chemistry (2020), POLiS Award for Excellence (2021), MRS Nelson “Buck” Robinson Science and Technology Award for Renewable Energy (2019), ECS Toyota Young Investigator Fellowship (2019), Oak Ridge Associated Universities (ORAU) Ralph E Powe Award (2017), and NSF CAREER Award (2018). She was also a Scialog research fellow in energy storage and negative emissions technologies. She joins the faculty of Princeton University School of Engineering and Applied Science and the Andlinger Center for Energy and the Environment (ACEE) in the fall.