Mercury emissions total 1.5 million tonnes over last 500 years

In the past 500 years, mining and other human activities have released nearly 1.5 million tonnes of mercury into the environment, according to researchers in the US.

In wide-ranging estimates of the amount of mercury released by humans in different regions of the world, the team found that most of the pollutant has not been sequestered naturally, but remains mobile.

“In no way do we just need to worry about how much we release today: what we’ve already put out there – even between [the years] 1500 and 1800 – is very large,” says David Streets of Argonne National Laboratory, US. “We need to think of ways to clean that up.”

Mercury, which is a liquid in its elemental form, has been used for centuries to aid gold and silver mining, as well as other industrial processes. It is toxic and can damage the nervous system, the kidneys and lungs. Historically, many gold and silver miners are believed to have suffered mercury poisoning. Where mercury is still used for extraction today – in small-scale mines in Africa and elsewhere – miners are still at risk.

But mercury is also mobile.  After experiencing chemical reactions, it can easily propagate through air and water; in air, it can travel for up to six months. One of the most dangerous pathways for mercury poisoning for humans is by eating large fish such as tuna, which concentrate the methylmercury they ingest from smaller fish and shellfish. Infamously, due to the release of methylmercury in industrial wastewater from a chemical factory of the Chisso Corporation from the 1930s to the 1960s, thousands of people who ate fish and shellfish in the region of Minamata, Japan, contracted severe mercury poisoning. In recent years, 110 countries signed up to the Minamata Convention to protect people and the environment from mercury emissions.

To estimate how much mercury has been released over time, Streets and colleagues from Argonne and other US institutions collected historical data on production for various industries in different parts of the world, then multiplied them by the emission rates of mercury for those industries.

Most mercury in the past half-millennium has been released in Europe, they found, totalling nearly 430 thousand tonnes, and in North America, to the tune of some 410 thousand tonnes. That said, since the 1970s emission has declined in these continents due to concerns over risks to health and environment.

South America, too, has been a big emitter, but with more than 60% of its emissions occurring before 1850. “We were perhaps a little surprised that pre-1850 emissions were as large as they turned out to be,” says Streets.

Streets and colleagues also found that – in contrast to South America – Africa, the Middle East and Oceania have been relative latecomers to mercury pollution, emitting most of their mercury since 1850. By 2010, the endpoint of the analysis, Asia was the greatest emitter.

The researchers believe the implementation of the Minamata Convention – an international treaty on mercury pollution adopted in 2013 – should emphasize reductions in small-scale mines and uses of mercury in products; the careful treatment and disposal of mercury-containing wastes; better control of air emissions from coal combustion; and the general modernization of industrial processes.

“These are the easiest and best ways to get mercury out of the environment and reduce human exposure,” says Streets.

Streets and colleagues reported their findings in Environmental Research Letters (ERL).
My favourite Nobel prize: Raman scattering is a universal fingerprint

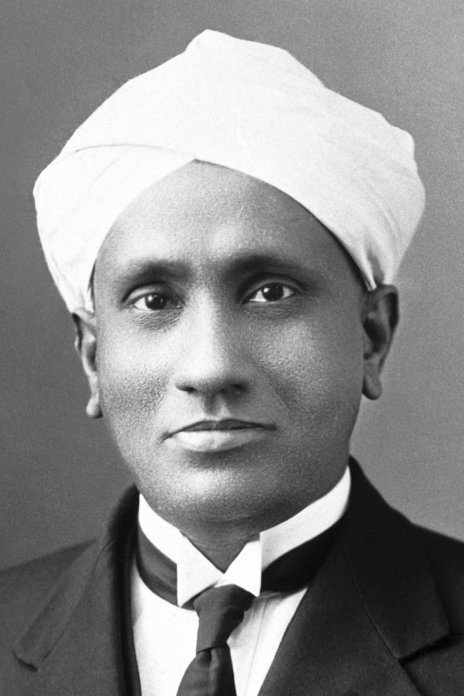
You don’t see objects just by shining a light on them – it’s the light they scatter that really tells the story. Chandrashekhara Venkata Raman dedicated his life to understanding how light scatters from objects, and in particular he discovered how scattered light can contain wavelengths that don’t feature in the light originally shone on them, and why. The spectrum of this “Raman scattering” contains so much information about a sample’s structure and composition it has been described as a characteristic “fingerprint”. Raman was awarded the 1930 Nobel Prize for Physics for discovering the effect, which has been widely used in sensing and identifying materials from drugs and pathogens to nanomaterials, and has also played a role in fundamental discovery including developing ideas in atomic physics.

At the time Raman made his discovery the additional wavelengths observed in scattered light seemed at odds with the quantum understanding of light emission from atoms. The wavelength of emitted light should correspond to the difference between energy levels occupied by the atom’s electrons, but these additional wavelengths in the electromagnetic spectrum did not relate to these electronic transitions and they changed with the wavelength of the incident light when different light sources were used. It turned out that the additional wavelength indicated other types of excitations – often vibrational modes, but also rotational energy and phonon modes – which are unique to specific materials and sensitive to the surrounding environment.

raman-12972-portrait-mini-2x

In fact Adolf Smekal had reported ideas on “inelastic scattering” in 1923, and Grigory Landsberg and Leonid Mandelstam reported observations of the effect crystals in Moscow in 1928 – the same year as Raman and his student K S Krishnan reported the effect. What Raman and Krishnan also showed, in addition to interpreting the effect, was that the phenomenon held for solids, liquids and gases. The universal nature of the Raman effect has made it indispensable for a vast array of fields.

I first came across the effect when I began a PhD studying field enhancements from plasmons that can make it easier to detect the otherwise rather timid Raman signal strengths. (Just one in 10 million incident photons will scatter in this way.) I spent three years modelling and simulating the electromagnetic field enhancements from different incident light sources on different nanostructures, largely geared towards finessing Raman signal detection. Carbon nanotubes were still quite a recent discovery and I remember excited discussions of how plasmons in nanoparticles or a nanoscale tip could help detect the signature Raman scattering from their radial breathing mode. It is hardly stretching the truth to say that studies motivated by the Raman effect showed me something I had not thought possible during my undergraduate degree – that electromagnetism could be fascinating.

Raman was the first Asian and first non-white to receive any of the Nobel Prizes in science, but if Raman thought this would lessen his chances of winning the award he nonetheless remained sufficiently confident that he booked his ticket from his homeland India to Stockholm before the 1930 award had even been announced. The significance of the discovery speaks for itself, and the ability to enhance Raman signals with field enhancements has unleashed the functionality of the effect, which has been instrumental in so many fields from guiding brain biopsies to tackling questions concerning nuclear spin in atomic physics. The shear breadth of topics and applications that have been propped up by understanding the Raman effect daily reaffirms its importance, and makes it my favourite Nobel Prize.

  • This was edited 1 October 2019 to include “in science” in the reference to “any of the Nobel Prizes”.

Oxford Instruments logo

Physics World‘s Nobel prize coverage is supported by Oxford Instruments Nanoscience, a leading supplier of research tools for the development of quantum technologies, advanced materials and nanoscale devices. Visit nanoscience.oxinst.com to find out more.

Software offers ‘sanity check’ for adapted plans in MR-guided radiotherapy

The recent introduction of MR-linacs into the clinic offers high-resolution target visualization during radiation treatment of cancer. Such systems are currently used to perform MR imaging of the patient on the treatment couch immediately prior to delivering each radiation fraction. Any changes in the patient’s anatomy or set-up position can be compensated for by adapting the original treatment plan to create a new plan-of-the-day.

So far, so great. But how can you check the accuracy and suitability of the adapted plan?

“The problem arises if you want to do patient-specific quality assurance. This is easy for a normal linac plan, but on the MR-linac, because you are adapting online, you can’t deliver the plan to an array without moving the patient off the couch,” explains Anthony Carr from The Christie, one of two UK sites that is now treating patients with Elekta’s Unity MR-linac.

The only option is to verify the plan after delivering treatment – and this makes people nervous, says Carr. Speaking at last week’s Medical Physics & Engineering Conference (MPEC) in Bristol, he described a potential solution to this problem: a fast automated “sanity check” for the new plan.

Carr is developing automated software that will quickly compare an online adapted plan against its reference plan using a set of specified metrics. The software also defines a tolerance range within which an adapted plan will count as acceptable. “If there are no gross differences between the plans, you can be confident to treat and perform the checks after,” he explains.

The software will compare a range of metrics, including: monitor units (MU) for each segment, each beam and the overall plan; the area of each segment; the MU-weighted sum-of-segment areas; and the shift in the centre-of-mass (COM) of the exposed part of the field-of-view of each segment. The resulting data then need to be displayed in a clear and concise manner, says Carr. He notes that a similar “sanity check” program is being developed at the Netherlands Cancer Institute.

To create the software, Carr used MR images from four patients and introduced realistic position shifts (of up to 0.5 cm). He then employed the Monaco treatment planning system to create plans adapted to the shifted position. New plans were created in four ways: by optimizing segment weight, and by optimizing segment weight and shape, for both adapt-to-position and adapt-to-shape optimization routines.

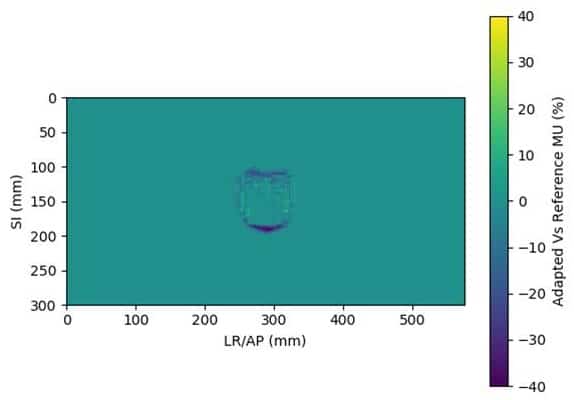
Treatment field heatmap

The software compares the original and adapted plans and outputs a chart showing whether each metric has passed (in green) or failed (in red). The system can also create a heatmap of the treatment field, generated by superposition of all segments in all beams, representing the difference in photon fluence between the original and adapted plans.

One question that Carr and his colleagues had to address is what level of tolerance should the software use? He set the provisional tolerances as 2σ above or below the mean value. “The tolerances can’t be too tight, or people may start to ignore them,” he points out. “Part of the problem was that I started writing the code before any patients had been treated, so we were concerned whether the tolerances we derived from these artificial shifts would be relevant in practice.”

Carr showed an example plan adapted to position using optimize weights. The COM data showed good agreement between the simulated shift and the software’s output, with a mean difference of just 0.01 mm in the superior–inferior (SI) direction, and 1.06 mm for anterior–posterior/left–right (AP/LR) shifts. In plans adapted using optimize weight and shape, the differences were slightly larger.

Next, Carr examined whether the 2σ tolerances are suitable for highlighting gross errors. To do this, he created plans from MR images with larger applied shifts (1.5 to 3 cm), again adapting to the new position by optimizing segment weights, and segment weights and shapes.

Examining four metrics – segment MU, beam MU, segment area and MU weighted sum-of-segment areas – revealed that the software flagged a far higher number of metrics in the plans with large shifts: approximately eight times as many for optimize weights and three times for optimize weights and shapes. “More were highlighted in red, which is a good indication that the software can pick up gross shifts,” says Carr.

In future work, Carr aims to extend the software to include plans adapted via segment reshaping using optimize weights or full fluence optimization. In addition, now that The Christie is treating patients with its MR-linac, he plans to analyse the results of real patient scans and adaptations, and use these data to create a set of tolerances.

Is parity violation a weak explanation for the homochirality of life?

Like the imbalance of matter and antimatter, the emergence of life based on molecules with a like chirality as opposed to their mirror opposites has long puzzled scientists. Chiral molecules, like your hands, cannot be superposed, but in the absence of some sort of chiral catalyst or source, the products of all chemical reactions will have roughly equal amounts of “left-handed” and “right-handed” molecules. So how come almost all the amino acids found in the proteins of living organisms are left-handed and all the sugars are right-handed? According to measurements and analysis recently reported in Nature Chemistry observations of the autocatalytic “Soai” reactions that had looked so promising won’t provide a definitive answer.

Electroweak parity violation and autocatalysis

Chirality is common among organic molecules because of carbon’s four outermost bonding electrons, which gears it towards tetrahedral molecular structures. The one-handedness of biomolecules is more of a mystery. One of the candidate theories hinges on the idea of “parity violation” in interactions of the “electroweak” force, which is one of the four fundamental interactions (alongside the electromagnetic, gravitational and strong forces), and governs radioactive decay of atoms into more stable isotopes.

For most interactions “parity symmetry” is conserved so if you flip the spatial coordinates it makes no fundamental difference to the interaction. However, the suggestion was that the electroweak force violated this parity symmetry so that there would be an energy difference – albeit potentially very small – between a chemical reaction producing one chiral molecule over its mirror image.  The  parity violation energy difference (PVED) hypothesis gained momentum when Chien-Shung Wu at Columbia University in the US alongside researchers at the Low Temperature Group of the US National Bureau of Standards, and later Richard Garwin, Leon Lederman and Marcel Weinrich, also at Columbia University, reported observations of this imparity in papers published in 1957.

PVED suggested how the product of a reaction might be biased towards one chirality over another but not the emergence of homochirality. However reports of an autocatalytic reaction by Kenso Soai and colleagues at the Science University of Tokyo in Japan in 1995 provided a possible mechanism for homochirality emerging from an initial imbalance. The “Soai reaction” provided a model for a chiral product that then catalysed the reaction to produce more molecules with the same chirality, so that an initial chirality imbalance would snowball.

The catch is that in the absence of some chiral source to tip the reaction into the chirality amplifying regime, the product over the whole system will still be equal parts of both chirality.  However Soai also worked out that if the reaction involved isotopically chiral molecules (chiral only by virtue of differences in chemical isotope in the molecule such as 12C versus 13C) then this would lead to the formation of two different complexes in the reaction pathway with slightly differing stability. This stability difference could provide the necessary chiral source to tip the balance. Intrigued, Donna Blackmond and her team at Scripps Research Institute in the US have been working on various aspects of the Soai reaction for nearly 20 years. Alongside Neil Hawbaker at Scripps Research Institute, she has been taking the imbalance down to very low magnitudes to look for the stability difference, and establish how big the stability difference needs to be.

Blackmond-1200

Testing the numbers

To quantify the stability or energy difference the researchers studied the Soai reaction. They combined an aldehyde and di-isopropyl zinc with an isotopically chiral alcohol as an initiator for the first reaction in the sequence. An emerging excess of one chirality of the molecule (also known as an enantiomer) over the other was taken as evidence of chiral symmetry breaking. As a control they also measured the outcome of experiments using an achiral alcohol initiator. From their experiments they concluded that an enantiomeric excess of between 0.1% and 1% in the isotopically chiral initiator was needed to tip the reaction into the chirality amplifying regime.

Next, they turned to theory to calculate the stability of complexes formed in the reaction from the parameters measured in their experiments. Calculating the stochastic outcome of the reaction from a large number of simulations indicated that the resulting enantiomeric excess required to break the chiral symmetry of the reaction was just 3.5 × 10⁻⁷. As Hawbaker and Blackmond put it in their report, “a direct experimental measurement of the threshold for symmetry breaking under our conditions would involve an absolute excess enantiomer concentration roughly equivalent to 20 mg of the autocatalyst in an Olympic-sized swimming pool.”

As for the calculated stability difference needed to give a bias towards one type of enantiomer that exceeds stochastic fluctuations, Blackmond and Hawbaker’s calculations give this a value of 0.0002%, and the energy required somewhere between 1.5 × 10⁻⁷ and 1.5 × 10⁻⁸ kJ mol−1 – five to seven orders of magnitude greater than the best estimates of what the energy difference from electroweak parity violation might be.

While models exist that allow chirality symmetry breaking to occur in autocatalytic reactions as a result of parity violation energy differences much smaller than the energy required, as Blackmond tells Physics World, “It certainly suggests that we would not be able to measure such an effect on such a reaction as the Soai reaction, in today’s chiral world.” These results add to other “inherent challenges” to the hypothesis, such as the absence of any known autocatalytic asymmetric reaction that could occur in the conditions of prebiotic Earth.

The result did not greatly surprise Blackmond. “My feeling is that we have not yet found a plausible phenomenon – either a prebiotically relevant autocatalytic reaction or some other chemical or physical process – through which PVED would be sufficiently “symmetry breaking” to allow the subsequent asymmetric amplification that must occur to reach significant levels of enantioenrichment,” she tells Physics World. Her own research will continue trying to bring aspects of chirality into research on prebiotic chemistry carried out in the groups at Scripps Research Institute and those of their collaborators.

Full details are available in Nature Chemistry.

Surfactant monolayers help make polymer crystals

A new technique dubbed surfactant-monolayer-assisted interfacial synthesis (SMAIS) can produce few-layer 2D polymer crystals on the surface of water. This is the first time that researchers have succeeded in making synthetic covalent organic 2D polymer sheets with crystalline domain sizes as large as a few microns. The materials are just a few layers thick and can easily be transferred onto a wide variety of substrates. They might thus be put to use in advanced applications such as membrane separation, electronics, optical devices and energy storage, to name but a few.

Polymers are a sequence of repeat units (monomers) linearly connected through covalent bonds – a definition first proposed by Hermann Staudinger back in the early 1920s. Researchers have been trying to go beyond this concept ever since and synthesize sheet-like polymers with long-range ordering along two orthogonal directions – that is, 2D polymers.

Despite extensive work, the problem with most of the 2D polymers made so far is that they contain crystal domains that are roughly a micron or less in size, which limits the applications in which they can be employed.

Surfactant monolayers as a soft guiding template

A team led by Ute Kaiser and Xinliang Feng of the TU Dresden and Zhikun Zheng at Sun Yat-Sen University, China, is saying that it has now succeeded in synthesizing 2D sheets of polyimide that are highly crystalline and have an average crystal domain size of roughly 3.5 microns.

The researchers made their materials on the surface of water by reacting amine and anhydride monomers together. They helped this reaction along using surfactant monolayers as a soft template to guide the supramolecular organization of the monomers and the subsequent 2D polymerization at the air-water interface. The SMAIS technique, as it has been dubbed, can produce 2D polymer films with a surface area of about 50 cmand a thickness that can be tuned between 2.6 to 30 nm.

Characterization techniques

Kaiser and colleagues characterized the molecular structure, grain boundaries and edge structures of their films using X-ray scattering and spherical-aberration-corrected high-resolution transmission electron microscopy (AC-HRTEM). They say that the crystalline polymers form thanks to the pre-organization of monomers at the water-surfactant interface. Depending on the nature of its polar head, the surfactant promotes the arrangement of the monomers, and then their polymerization, in either a horizontal or vertical direction with respect to the water surface. For example, a vertical arrangement is seen when the surfactant bears a carboxylic acid group, which anchors amine monomers through a condensation reaction.

The TU Dresden team, reporting its work in Nature Chemistry 10.1038/s41557-019-0327-5 and Nature Communications 10.1038/s41467-019-11921-3, further backed up its analyses with synchrotron grazing-incidence X-ray scattering (Stefan Mannsfeld‘s group did this part of the work) and density-functional tight-binding calculations (Thomas Heine’s team), which provide important insights into the atomic structures of the synthetic 2D polymers.

Dieter Schlüter of ETH Zurich, who was not involved in this work, says that the TEM images of the polymer films are “the most beautiful” he has seen so far and that the new work is a “milestone”.

“Unprecedented level of long-ranging order”

“Using a simple process, Kaiser and colleagues have managed to obtain few layer covalent films that exhibit an unprecedented level of long-ranging order,” he comments. “Since they can resolve grain boundaries by AC-HRTEM with great precision, they now have, in principle, the long-sought possibility of exploring the effect of reaction conditions on the long-rangedness of order in their sheets. This is an important step towards the rational synthesis of 2D polymers and, more generally, organic 2D materials.

“Since the monomers are commercially available, this makes it easier for other laboratories to perform research in this field and explore 2D polymer properties and applications. Indeed, this will also actually be an advantage for our own work in the future.”

Last year, Schlüter and his colleagues, together with co-workers in Benjamin King’s group at the University of Nevada Reno reported on monolayer 2D polymers with long-range order that can be made at the air-water interface. They also provided robust high-resolution atomic force microscope (HR-AFM) evidence for this long-range order. The sheets produced can easily be handled and are clearly polymers too (7×7 mmin surface area).

Schlüter’s team was unable to obtain HR-TEM images of their samples for the plain and simple reason that organic monolayers unfortunately burn away under the high energy of the electron beam employed in TEM. The new work by Kaiser’s group is thus an important advance in this respect, says Schlüter, even if the “price to pay” here is the fact that multilayers of 2D polymers rather than monolayers need to be used.

“I do believe that they have produced the largest crystalline domains in synthetic covalent organic sheets,” he says. “Our domains were about 0.5 microns in size on average.”

Space shed bags award, what to do with an infinity of electrons, the beauty of blackboards

Meet writer and theatre director Jon Spooner, who has bagged the Unique Shed of the Year 2019 award from the garden paint and stain supplier Cuprinol. His mobile shed is dubbed the Unlimited Space Agency (UNSA) and is on a mission round the UK “to inspire the next generation of scientists and space explorers through interactive storytelling”.

According to Spooner, UNSA normally looks like a garden shed. But when it “powers on” it unfolds to create a stage complete with integrated sound and lighting (see figure).

If you happen to be in London on 10-14 October you can catch Spooner’s show at New Scientist Live.

Spooner has also done audio interviews with scientists (including physicists Jen Gupta, Alexandra Amon and Jon Butterworth) that are available on his Space Shed podcasts.

Let’s say you had an infinite amount of one thing – electrons, helium or maybe neutrinos. Could you make that monoculture of stuff interact with itself to create an infinite amount of everything? An interesting question that physicist and author Chad Orzel addresses in his latest blog in Forbes. Orzel concludes the smaller the thing, the more difficult the task.

For those of us of a certain age, physics is wedded to blackboards filled with byzantine equations. Such visions are gone for good at many schools and universities, where interactive white boards now rule supreme. But some holdouts are still using blackboards, and the photographer Jessica Wynne has captured some of their scribblings in a book that will be published next year. Wynne focussed on mathematicians, but her photographs are sure to appeal to physicists. You can see a selection of her work in the New York Times with a commentary from the science writer Dennis Overbye.

My favourite Nobel prize: the blue LED that lights up the modern world

Of all the physics Nobel prizes awarded in the past 60 years, the one with the greatest impact on everyday life is undoubtedly the one shared by Isamu Akasaki, Hiroshi Amano and Shuji Nakamura in 2014. As the co-inventors of the blue light-emitting diode (LED), this Japanese-born trio set in motion a dramatic shift in how we see the world. You would have to go back to the 1956 prize – shared by transistor inventors John Bardeen, Walter Brattain and William Shockley – to find a Nobel-laureated discovery that sparked an equivalent transformation.

LEDs are amazingly efficient, requiring around 90% less energy than incandescent bulbs to produce the same amount of light. Although some of these energy savings are being cancelled out as it becomes financially feasible to illuminate once-dark areas, the LED’s efficiency is still a major step forward when you consider that 20-30% of the electricity consumed in industrial societies goes towards lighting. But the emergence of LED lighting as a mainstream commercial product would never have come about were it not for the work of Akasaki, Amano and Nakamura. By developing a blue LED to go with the red and green versions invented decades before, the 2014 laureates made it possible to create white-light LEDs – turning a niche technology into a ubiquitous one at a stroke.

Not that it was easy. Akasaki, Amano and Nakamura began their groundbreaking work in the 1980s, when Akasaki and Amano were researchers at Nagoya University and Nakamura was working at a small company called Nichia Chemicals. For years, it seemed their chosen material – a crystalline semiconductor called gallium nitride, or GaN – was not going to cooperate. Even getting the crystals to grow took effort. Then, in the early 1990s, first Akasaki and Amano, and then Nakamura, used a technique called metalorganic vapour phase epitaxy to deposit thin films of high-purity GaN onto substrates. After that, the next challenge was to introduce p-doping in order to produce the requisite p-n junction. Once this hurdle was surmounted, the first high-brightness blue LED followed.

By the mid-2000s, phosphor-coated bulbs that turned blue LED light into a somewhat “cold” white light were readily available in shops. Later, “warmer” versions have now superseded not only incandescent bulbs, but also halogen and compact fluorescent devices. As the Nobel Prize website observes, the 20th century was lit by incandescent bulbs; thanks to Akasaki, Amano and Nakamura; the 21st century is being lit by LED lamps. And how many other Nobel-prize-winning discoveries can you buy for less than a tenner at your local corner shop?

Oxford Instruments logo

Physics World‘s Nobel prize coverage is supported by Oxford Instruments Nanoscience, a leading supplier of research tools for the development of quantum technologies, advanced materials and nanoscale devices. Visit nanoscience.oxinst.com to find out more.

Extremes of global heat bring tipping points closer

Urgent action on climate change will be costly. But inaction could be four or five times more expensive, according to new climate accounting: extremes of global heat are on the increase.

Submarine heatwaves happen three times more often that they did in 1980. Ocean warming events can devastate coral reefs and trigger even more damage from more intense acidification and oxygen loss in the seas, with disastrous consequences for fishery and seafood.

The ecosystems on which all living things – including humans – depend are shifting away from the tropics at up to 40kms a year. Extremes of torrential rainfall, drought and tropical cyclones are becoming measurably more intense.

And all this has happened because global mean surface temperatures have risen in the last century by about 1 °C, thanks to ever more carbon dioxide in the atmosphere, a consequence of profligate use of fossil fuels to drive human expansion.

Forecasts suggest humans could tip the planet to a rise of 1.5 °C as early as 2030. This is the limit proposed by 195 nations in Paris in 2015 when they promised to keep global heating to “well below” 2 °C by the end of the century.

And now researchers once again warn in the journal Science that even the seemingly small gap between 1.5 °C and 2 °C could spell a colossal difference in long-term outcomes. Right now, the planet is on track to hit or surpass 3 °C by 2100. The case for drastic reductions in greenhouse gas emissions is now more compelling and urgent than ever.

“First, we have under-estimated the sensitivity of natural and human systems to climate change and the speed at which these things are happening. Second, we have under-appreciated the synergistic nature of climate threats – with outcomes tending to be worse than the sum of the parts,” said Ove Hoegh-Guldberg of the University of Queensland in Australia, who led the study.

“This is resulting in rapid and comprehensive climate impacts, with growing damage to people, ecosystems and livelihoods.”

Harder to forecast

And Daniela Jacob, who directs Germany’s Climate Service Centre, added: “We are already in new territory. The ‘novelty’ of the weather is making our ability to forecast and respond to weather-related phenomena very difficult.”

The two scientists were part of a much larger world-wide team of researchers who looked at the risks that arrive with rapid change: damage to forests, farms and wildlife; to coastal communities as sea levels rise and storms multiply.

Their message is clear. There would be huge benefits to containing average global temperature rise to no more than 1.5 °C above the long-term average for most of human history.

“This is not an academic issue, it is a matter of life and death for people everywhere.” said Michael Taylor, dean of science at the University of the West Indies in Jamaica.

Weak commitments

“That said, people from small island states and low-lying countries are in the immediate crosshairs of climate change. I am very concerned about the future for these people.”

So far, the commitments made by most nations are simply too feeble. That risks condemning many nations to chaos and harm, and, as usual, those most vulnerable would be the poorest.

“To avoid this, we must accelerate action and tighten emission reduction targets so that they fall in line with the Paris Agreement. As we show, this is much less costly than suffering the impacts of 2 °C or more of climate change,” said Hoegh-Guldberg.

“Tackling climate change is a tall order. However, there is no alternative from the perspective of human well-being − and too much at stake not to act urgently on this issue.”

US seeks to bar graduate students at private universities who get paid for work from unionizing

Graduate students at private universities who are paid for teaching and research will not be regarded as employees with the right to unionize under new plans set out by the US National Labor Relations Board (NLRB). The move reverses a 2016 decision by the NLRB that did allow paid graduate students to unionize. The board is now seeking public comments for 60 days after which it is required to review and address the comments and show it has taken them into account before adopting a final version of the rule.

The NLRB’s new plan, outlined on 20 September, will exempt from the board’s jurisdiction undergraduate and graduate students “who perform services for financial compensation in connection with their studies”. If accepted, the proposal would overturn an August 2016 decision that gave graduate students working as teaching or research assistants at Columbia University the status of employees with the right to join unions. That reversed a 2004 decision denying graduate students at Brown University employment and union rights – a ruling that, in turn, overturned a decision in 2000 to give students at New York University the right to unionize.

The new rule falsely asserts that grad workers – who grade papers, do research and teach classes that keep their universities running – are merely students

American Federation of Teachers

NLRB members cite four reasons for the proposed changes. One is that students generally help faculty members with teaching and research because the work is vital to their education. The NLRB also notes that students tend to spend “a limited amount of time” carrying out their paid work and that they receive funding whether or not they perform the extra duties — making the payments resemble financial aid rather than wages. The final point made by the NLRB is that students and their faculty advisers collaborate at an individualized level — an approach that does not lend itself to collective bargaining.

Todd Lyon, an attorney at the employment law firm Fisher Phillips, says that if the regulation is adopted it will have “a dramatic impact” for universities and private colleges. “No longer would student-workers have the right to form unions and collectively bargain with their schools,” he says.

Essential work

University administrations, which have resisted the unionization since 2016, have welcomed the decision. “Graduate students are students, first and foremost,” notes Daniel Diermeier, provost of the University of Chicago, which has refused to recognize its graduate students’ union. “A collective bargaining agreement would likely create an environment of standardization without room for differentiation, changing the nature and scope of the relationships of graduate students to their advisors, other faculty, and degree programs.”

Graduate student organizations, however, counter that their paid work is essential for their departments’ operation. Indeed, a few organizations have carried out walkouts and hunger strikes, while the Harvard University graduate students’ union is currently threatening to call a strike over issues of pay, benefits, and protection from discrimination.

“The new rule falsely asserts that grad workers – who grade papers, do research and teach classes that keep their universities running – are merely students,” the American Federation of Teachers, which is affiliated with several university graduate student organizations, states. “It would permit universities to profit from grads’ work on the one hand, while claiming they aren’t even workers on the other.”

Novel PET method visualizes protein tangles after traumatic brain injury

© AuntMinnieEurope.com

A research team from the UK and Sweden has used dynamic flortaucipir-PET imaging to show that single moderate-to-severe traumatic brain injury (TBI) can trigger signs of accumulation of neurodegenerative tau protein and lead to cognitive decline.

The researchers found significant tau build-up in a brain region associated with object recognition, and they observed a correlation between the increased deposits that reduced cognitive abilities among patients with a more severe TBI almost 20 years after their injury (Sci. Transl Med. 10.1126/scitranslmed.aaw1993).

“The ability to detect tau pathology in vivo after TBI has major potential implications for diagnosis and prognostication of clinical outcomes after TBI,” wrote the study authors, led by Nikos Gorgoraptis, from the department of brain sciences at Imperial College London in the UK. “It is also likely to assist in patient selection and stratification for future treatment trials targeting tau.”

Flortaucipir (Avid Radiopharmaceuticals) has recently shown promise in binding to tau neurofibrillary tangles in postmortem brain tissue of Alzheimer’s patients. It has also been shown to build up in brain regions associated with chronic traumatic encephalopathy (CTE) among former professional football players who experience multiple head traumas.

Tau deposition also is known to occur after one TBI, with “abundant and widely distributed neurofibrillary tangles [having] been found postmortem in about one-third of patients with TBI,” Gorgoraptis and colleagues noted.

PET scans

What remains unexplored is flortaucipir-PET’s role in quantifying tau accumulation many years after a single TBI, and how much that injury might affect a patient’s health?

To answer the question, the researchers looked at 21 patients (median age, 49 years; range, 29–72 years) with one moderate-to-severe TBI. Examinations of their injuries, primarily from traffic accidents (86%), occurred at a median age of 32 years (range, 18–51 years). For comparison purposes, 11 age- and demographically matched healthy controls were included in the study.

All participants underwent dynamic PET imaging for 90 minutes with an average intravenous bolus (250 MBq) of flortaucipir, as well as structural 3-tesla diffusion-tensor MR imaging (DTI-MRI) to assess white-matter integrity through fractional anisotropy.

Additional assessments included the Glasgow Outcome Scale-Extended (GOS-E) index, which measures brain function after an injury on a scale of 1 (brain dead) to 8 (good recovery), and a Mini-Mental State Examination (MMSE). An MMSE score of less than 12 is considered severe dementia, while a score greater than 24 is normal.

The researchers then divided TBI patients into two groups: a “disabled” subgroup of subjects with a GOS-E index of 6 or less and a “good recovery” subgroup with an index greater than 6. Longitudinal data was available for 15 TBI patients beginning at a mean of 17 years before the current clinical assessments.

Flortaucipir-PET images showed significantly greater tracer binding to tau deposits in the right lateral occipital cortex (p < 0.05) of TBI patients, compared with the healthy controls. In addition, white-matter integrity, as measured by fractional anisotropy, was significantly reduced in TBI patients (p = 0.04), compared with healthy controls.

The researchers also found evidence of a cognitive decline in MMSE scores (average, -1.3; -0.073 MMSE points per year) in the disabled TBI subgroup, compared with the good outcome TBI subgroup, which actually improved its collective MMSE scores (average, 1; 0.058 MMSE points per year), creating a statistically significant difference between the two subgroups (p = 0.041).

Given flortaucipir-PET’s ability to detect tau in patients after a single TBI, Gorgoraptis and colleagues suggested the technique could help in the design of future trials of tau-targeting therapies.

  • This article was originally published on AuntMinnieEurope.com ©2019 by AuntMinnieEurope.com. Any copying, republication or redistribution of AuntMinnieEurope.com content is expressly prohibited without the prior written consent of AuntMinnieEurope.com.
Copyright © 2026 by IOP Publishing Ltd and individual contributors