Complex tooth development is explained by simple diffusion-limited growth

The tooth is the most mineralized tissue in the mammalian body and holds information about the creature it belongs to. One can identify the taxonomy, life history and species simply by examining enamel. However, the origin of enamel thickness differences and how this comes about between species and within populations is still unknown. Now, researchers led by Jukka Jernvall in Finland have developed a mathematical model that simulates enamel secretion from underlying dentine. This model allowed the researchers to reproduce mammalian enamel structures as well as explaining the difference in enamel morphology between species.

Tooth enamel grows from an underlying tissue known as dentine during mammalian development. The interface between these two tissues, the enamel-dentine junction (EDJ), reflects the final shape of our enamel crowns, however, it is not a simple geometric extrapolation of this surface. Hence, the researchers developed a growth model for enamel from the EDJ that assumes enamel growth requires a net influx of a diffusing nutrient substance. By modifying the nutrient concentration, the minimum amount of nutrients for growth and the stiffness of the advancing growth front, the researchers were able to predict the morphology of final enamel structures and compare them to micro-CT scans of tooth samples.
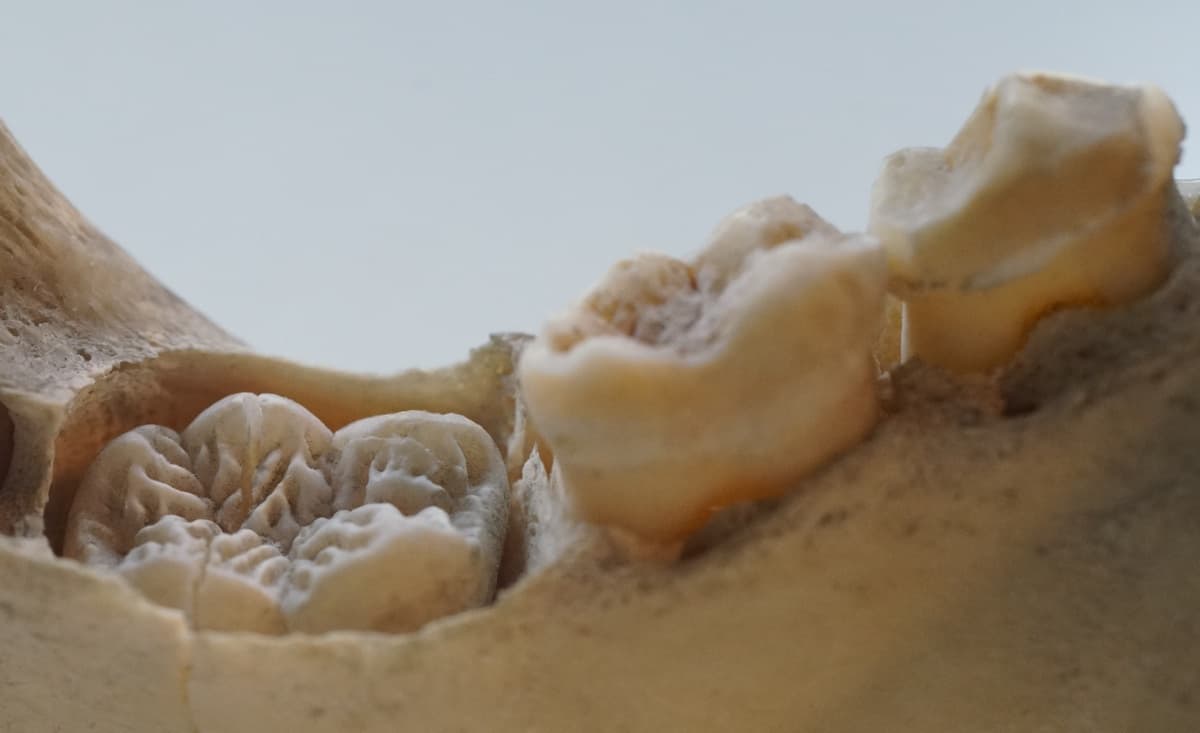
orangutan teeth

Impressively, the researchers were able to predict the deep narrow furrows present in pig molar enamel, which a simple geometric extrapolation from the EDJ could not. The diffusive nature of enamel growth means that small changes in the EDJ shape correspond to large differences in enamel morphology. Furthermore, the model mimics the incremental lines of enamel growth in pig molars during development, comparable to growth rings in trees. Using tomographic image data from the particle accelerator at the European Synchrotron Radiation Facility, they showed that the model not only reproduces the correct final structure but also the growth mode of the enamel matrix.

Species differentiation by diffusion

Following on from the pig molars, the researchers studied primate molars (including humans). By modifying the orientation of their diffusion-limited model, the researchers could reproduce human enamel morphology with characteristic ripples and larger crowns. Comparing human and orangutan molars, the researchers were able to reproduce the more complex enamel structure of the orangutan using the softer human EDJ simply by modifying the amount of nutrient available. They could also switch the enamels from human-like to orangutan-like for EDJs from either species by modifying the limits of diffusion for the enamel growth.

This model highlights the necessity of diffusion-mediated matrix deposition for complex enamel development and shows how even simple mechanisms have allowed biology to flourish into complexity. Furthermore, this model allows researchers to study the growth of other diffusion-limited tissues and increases our understanding of enamel matrix formation.

Full details of the research are reported in PLoS Computational Biology
Polar bears inspire insulating aerogel

Taking inspiration from the microstructure of polar bear hairs, which are hollow and waterproof, researchers have made a new, super-elastic lightweight carbon tube aerogel that is an excellent thermal insulator. The material could find use in architecture and aerospace applications – especially those employed in extreme environments.

Unlike human hair or the hair of other mammals, polar bear hairs are hollow and contain a cavity running through their centre. The shapes and spacings of these cavities give polar bears their characteristic white coats but they are also responsible for their exceptional heat-holding capacity, water resistance, elasticity and light weight.

An aerogel block

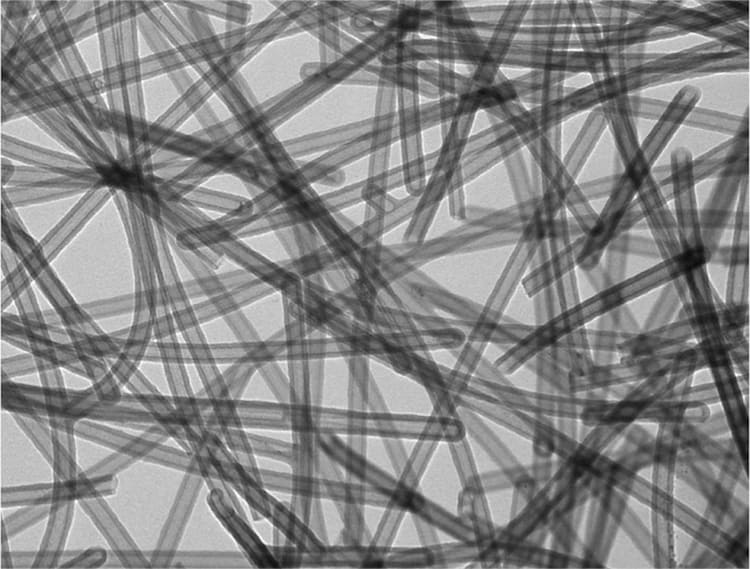
To mimic this structure, a team led by Shu-Hong Yu, Jianwei Liu and Yong Ni of the University of Science and Technology of China (USTC), fabricated hollowed-out carbon tubes and wound these into an aerogel block.

The researchers began by making a cable hydrogel from tellurium (Te) nanowires as a template coated with a carbon shell. They then made a carbon tube aerogel (CTA) from this hydrogel by super-critically drying it and then calcinating it in an inert atmosphere (of argon) at 900°C for three hours to remove the Te nanowires.

hollow bioinspired carbon tube aerogel.

“Thanks to its unique microstructure, the CTA boasts excellent thermal insulation properties and is super-elastic,” explains Yu. Indeed, it has rebounding speed of 1434 mm/s, which is the fastest of all traditional elastic materials as measured using a standard test involving a falling steel ball. This makes it even more elastic than polar bear hair itself.

Its excellent thermal conductivity, which is lower than that of dry air, at just 23 mW/m/K comes from the hollow structure of the carbon tubes. This is because their inner diameter (of 35 nm) is smaller than the mean free path of air (75 nm). The thermal conductivity of the material remains intact even after being stored for 120 days at 56% relative humidity at room temperature in air

Robust mechanical structure

The CTA is also lightweight with a density of 8 kg/m3, which is lighter than most reported thermally insulating materials and is non-wettable at a contact angle of 146°, adds Yu. And remarkably, it maintains its mechanical structure even after more than one million compress-release cycles at 30% strain and 10 000 cycles at 90% strain.

The researchers, reporting their work in Chem 10.1016/j.chempr.2019.04.025, expect the material to find applications in the aerospace industry, especially in extreme environments. Before such applications see the light of day, however, they will need to scale up its manufacture to industrial scales, they say.

“The diameter of our CTA is 4 cm and its height around 2 cm,” explains Yu. “While it is difficult to obtain larger CTAs at the moment because of the size limitations of the laboratory equipment we employed, we hope to solve this problem by collaborating with industrial partners,” he tells Physics World.

Nanocrystals give dragonfish their transparent teeth

In the darkness of the ocean’s midnight zone the deep-sea dragonfish, glows with bioluminescence to lure prey before striking with its transparent, sabre-like teeth. The transparency makes the teeth and wide-open mouth of this ferocious predator invisible to prey as it hunts and now a team of oceanographers and material scientists have discovered that this invisibility is a result of a unique nanoscale structure. The team hopes that their discovery will inspire the development of super-tough, but transparent materials.

The deep-sea dragonfish has a dark, eel-like body and a disproportionately large head and mouth filled with immense, sharp and transparent teeth. Indeed, the teeth can be so large that they stick out of the mouth when it is closed. While the fish are small – about the length of a pencil – they are apex predators in the aphotic zone of the ocean, where they live at depths of at least 1000 m. The fish attract and illuminate prey in the darkness using a bioluminescent barbel that hangs under their chin. A mechanism known as loosejaw allows the deep-sea dragonfish to eat fish that are up to half their own size.

Marc Meyer, an expert in bioinspired materials at the University of California, San Diego says that the transparent teeth have probably evolved to assist with hunting. “We propose that they are transparent, so the dragonfish can conceal the teeth and just keep their mouth open with the little light source,” he told Physics World. “Then the prey comes and bang it is trapped in this huge mouth. If the prey were to see the teeth, they would shy away.”

Unique nanoscale structure

Intrigued by the transparent nature of the teeth, Meyers and colleagues in San Diego and the Leibniz Institute for New Materials in Germany, examined deep-sea dragonfish collected from the San Diego Trough, a 1000 m deep ocean canyon off the Californian coast. When they looked at the teeth with scanning electron and X-ray microscopes they discovered that they have a unique nanoscale structure that reduces light scattering.

Like most teeth, the teeth of deep-sea dragonfish consist of an outer enamel-like layer over an inner dentin layer. The dentin layer, however, lacks the typical microscale tubules of other teeth. Instead, the team’s analysis revealed that it is comprised of an interwoven pattern of much smaller nanorods, which are around 5 nm in diameter. The enamel-layer also features a nanoscale structure, consisting of 20 nm crystals in an amorphous matrix.

The nanostructures are smaller than the wavelength of visible light and Meyer says that this allows them to reduce Rayleigh scattering from the teeth. This scattering is a well-known phenomenon that depends on particle-size: the smaller the particles the less they scatter light. “The resulting effect is that the very small particles, the nanocrystals, scatter the light very little and you end up not having any light that is reflected or scattered. Most of the light is transmitted, especially if the tooth is in the water,” Meyers explains.

Bioluminescent allure

While there is little sunlight in the aphotic zone, many denizens of the deep like the dragonfish are bioluminescent. “We think it is the light from their lure, it is the light that they generate that they are transmitting [through their teeth],” Meyers explains.

The nanoscale structure also makes the teeth very strong. While the mechanical properties of the enamel-like layer are similar, the researchers found that the dentin is much harder and stiffer than that of a piranha or great white shark. While the dentin layer of the great white shark and piranha have hardnesses of 0.2 GPa and 0.3 GPa, respectively, the deep-sea dragonfish’s dentin was found to have an average hardness of 1.2 GPa.

The team now hope to use the knowledge gained from the teeth to create glass-like ceramics, which could be used for applications such as ultra-strong windows. “We are always looking for bio-inspired structures, but it is a long road,” Meyers says.

The work is described in Matter.

Ultrasound elastography is a quick and non-invasive way to spot kidney failure

Ultrasound elastography can be used to diagnose kidney disease, providing a more reliable estimate of impairment than methods based on blood tests or kidney dimensions. Sook Sam Leong and colleagues at the University of Malaya in Kuala Lumpur measured Young’s modulus derived from shear wave elastography in the kidneys of patients undergoing accurate but expensive radiotracer-based tests, and found that they correlated negatively with renal function. The technique also indicated which kidney was dominant — an important determination for kidney donors undergoing transplant surgery (Ultrasound Med. Biol. 10.1016/j.ultrasmedbio.2019.01.024).

Chronic kidney disease (CKD) is defined as a persistently low glomerular filtration rate (GFR) — the rate at which blood plasma is filtered by the kidneys. Combined GFR for both kidneys can be assessed by injecting into the patient a water-soluble salt labelled with radioactive chromium-51 (51Cr-EDTA), and measuring the level of radioactivity in a blood sample drawn a few hours later.

Another radiotracer also delivered intravenously — technetium-99m-labelled dimercaptosuccinic acid (99mTc-DMSA) — is used to indicate the relative function of each individual kidney. In this technique, a GFR difference between the two organs is revealed by images captured using a gamma camera several hours after the radiotracer is administered.

“Currently, these two tests are the gold standard diagnostic procedures in assessing renal function,” says Kwan Hoong Ng, who led the research team. Unfortunately, not all clinics have access to nuclear medicine, and even where the techniques are available, they cannot always be used. The problem, says Ng, is that “they are time-consuming, they involve radiation exposure and, most importantly, they are expensive.”

A cheaper and quicker way of estimating GFR is to measure more accessible proxies, such as the level of muscle breakdown products in the blood, ultrasound echogenicity of the kidney as a whole, and even the organs’ lengths and volumes. None of these approaches are especially accurate, however, and all of them have been shown to be potentially insensitive to some indicators of serious renal disease.

Seeking a diagnostic technique that is simultaneously sensitive, affordable and convenient, Leong and colleagues found an alternative proxy in the changing tissue properties that accompany decreasing kidney function. Biopsies have shown that, as renal disease progresses, deposition of fibrous scar tissue in the kidneys leads to stiffening. Previous studies appeared to find that this stiffening was reflected in increased kidney shear wave velocity, but these mechanical changes were compared to estimates of GFR made using possibly unreliable means, rather than the radiotracer-based gold standard.

To address this uncertainty, the researchers used ultrasound to measure Young’s modulus and shear wave velocity within a sub-volume of the kidneys of 57 patients who also underwent 51Cr-EDTA-based GFR measurement and 99mTc-DMSA scintigraphy-based measurement of relative kidney function.

The results confirmed that shear wave elastography-based measurements of Young’s modulus and shear wave velocity can be used as a quick and easy diagnostic tool for kidney disease, and that they can identify an imbalance in function between the two kidneys in a given patient. The link between tissue stiffness and disease is still not completely clear-cut, however, as some research has suggested the opposite relationship, with tissue stiffness correlated positively with GFR.

“Two studies suggested that kidney stiffness increases with kidney function due to increased blood flow,” says Ng. “The correlation was only made between stiffness and perfusion without histological parameters, so future works need to be done to include both the histological evaluation and blood perfusion.”

Although the results suggest that shear wave elastography could replace other proxy-based methods of estimating GFR — and perhaps even radiotracer-based procedures — the researchers caution that the technique is not yet ready for the clinic. “We are the first and the only centre exploring this method, so more research on this area should be conducted by other centres to confirm the results,” says Ng.

Patently obvious: why it pays to get intellectual property right

Segway

Two recent events have got me thinking again about patents and intellectual property (IP). The first was World Intellectual Property Day, which took place on 26 April. Held annually since 2000, it urges people to consider how IP “contributes to the flourishing of music and the arts and to driving the technological innovation that helps shape our world”. The other event was the International Day of Light on 16 May, which celebrates the huge impact that light, optics and photonics have had on our lives.

That day was chosen because it was on 16 May 1960 that the US engineer and physicist Ted Maiman successfully operated a laser for the first time. But as I mentioned last year, Maiman was not the only person with a reasonable claim to have “invented” the laser. The other was Gordon Gould, who didn’t patent his idea, incorrectly believing that he needed to demonstrate a working device first. As a result, Gould had to endure a tortuous 30-year legal battle before he was awarded a string of laser-related patents and millions of dollars in back royalties.

That’s the point when it comes to commercializing technology: inventors should make sure they get sound patent advice. Indeed, given the importance of IP, the Business Innovation and Growth group of the Institute of Physics is holding a series of “business accelerator” breakfast briefings on the topic this year, the first being on 28 June. But in a world with so many tools available to “reverse engineer” products and technology, are patents and trademark protection really your best defence against others making money from your idea?

Move on up

To get an idea of what’s at stake, consider Segways – those self-balancing, two-wheeled scooters that were launched by the US firm Segway in 2001. These “personal transit devices” would revolutionize human transportation, the company said, transforming how cities are laid out and how people get around them. Segway reckoned it would sell 10,000 units a week by the end of 2002 – that’s half a million a year. Indeed, one venture capitalist – John Doerr – even predicted the firm would reach $1bn in sales faster than any other company in history. The Segway, he said, could be bigger than the Internet.

Segway reckoned it would sell 10,000 units a week

Those were bold claims and naturally other firms took an interest too. Before long, Segway was up against China’s Ninebot with similar products. As the years went by, Ninebot grew – expanding first in China and then globally. Indeed, its success prompted Segway to file various patent-infringement suits against Ninebot. But as legal processes can drag on for years and cost lots of money, both companies continued developing their own products. In 2015, however, Ninebot bought Segway and rebranded itself as…Segway.

Now, a cynic might say that’s a perfectly good business model for a company in a country with notoriously weak IP laws (China). Copy a company’s product, make money from selling the copy, and then buy the original business and its IP. Look a little deeper, though, and it seems to me that Segway illustrates the fact that not all companies with great potential end up being commercially successful. Segway didn’t get its product quite right but was bought up, probably because it had, wisely, taken out good patents.

To see why, let’s go back to 2001 when Segways were launched. They were a cool concept and a sensation with the public. Unfortunately, they cost $5000, which put them totally out of reach for most people. In fact, you could have bought a great second-hand car for that price. Over the next six years, Segway ended up selling just 30,000 units, well shy of the original estimates. In 2006 the firm even had to recall all 23,500 units sold to date as a software bug sometimes made the wheels go into reverse, throwing the rider off. Indeed, it had already done a recall in 2002 for a similar issue. There was further bad news in 2010 when the British businessman who bought Segway less than a year previously, died after riding an off-road version of one of them off a cliff and plunged into a river near his Yorkshire estate.

Ninebot, in contrast, made more affordable road versions of the product, which sold in huge numbers. It got the price point and the application for the product right. Other companies did so too. A couple of years ago I bought a Chinese-made Inmotion V3 twin wheeler, which cost just £500, had better features and was light enough for me to take on the train as part of my commute. I still use it today and it’s great fun too.

Right way up

If the creation of the Segway has taught us one thing, it’s that it’s not always immediately obvious what inventions can do for us. The laser, you may recall, was deemed to be a “technology looking for an application”. Working out the best commercial opportunities requires good timing, a degree of luck and plenty of vision – especially early on. Make the wrong predictions and hindsight can make you look extremely foolish. Get things right, however, and the rewards are clear.

What the stories of the Segway and the laser tell us is that finding the right application is key to business success. New technology will win out only if it brings the right benefits to customers. But making the correct call and knowing the right answer aren’t always immediately obvious at the outset. That’s why it’s always wise and prudent for technology entrepreneurs to get good patent coverage if they want to reap the rewards from all their hard work.

Compound heat waves have double impact

Be ready for climate hazard in a new form – the compound heat waves that hit you, leave you and come back again.

As the world warms, say US scientists, the risk of economically devastating, physically debilitating and potentially lethal extremes of heat will multiply, and in unexpected ways.

Researchers picture a world in which the most vulnerable – those already ill or elderly, housed in substandard buildings in crowded cities – are laid low and gasping by several days of extreme heat. Even if the temperatures drop a little, the buildings in which they live will still “store” heat to intolerable levels.

And then, unexpectedly, the extremes of heat return. Hospitals could be overwhelmed. Electric grids might experience overload. Harvests could wither. And the weakest could dehydrate and die.

“Averaged over time, heat waves are the most deadly type of disaster in the US, in addition to causing many emergency room visits, lost working hours and lower agricultural yields,” said Jane Baldwin of Princeton University in the US.

“However, if you look at the deadliest heat waves in Europe and the US, many have more unusual temporal structures with temperature jumping above and below extremely hot levels multiple times.”

Climate scientists have repeatedly warned that as the planet warms overall, the number of places where potentially deadly heat waves will hit will inevitably rise.

If humans go on burning fossil fuels at ever-increasing levels, then heat waves usually experienced once a century could return every few years, to become the “new normal.”

By 2100 most people on the planet could be at risk some of the time as heat extremes become more severe, and more frequent.

In some parts of the world, the combination of high humidity and high temperature really could kill after a few hours, and new research has started to assess the probability of potential famine, simply because devastating extremes of heat could endanger crop yields on two continents in the same year.

Gauging probabilities

Heat extremes can kill – the 2010 heat wave in Russia is estimated to have caused around 56,000 extra deaths – and US scientists recently counted 27 ways that sweltering heat can claim lives and devastate families.

The Princeton study, in the journal Earth’s Future, is a preliminary look simply at the probabilities of back-to-back heatwaves. Policy-makers, city authorities and medical chiefs need to know what new hazards global heating can bring, and the study is, the scientists say, just a first step.

But it identifies the precise problems that come with severe temperatures, especially for the already vulnerable, even in the world’s richest cities, such as New York.

“Surveys of low income housing in places such as Harlem have found that after a heat wave has ended, temperatures indoors can remain elevated for a number of days,” Baldwin said. A swift return of the big heat could multiply the stresses.

And her co-author Michael Oppenheimer said: “We want to know how the effects of compound heat waves will differ from – and amplify – the already severe consequences for human health, infrastructure stability and crop yield that we see from single event heat waves.”

Three earthquake laws are reproduced in the lab

A new lab-based experiment that accurately reproduces three universal laws that govern the dynamics of earthquakes has been created by Osvanny Ramos and colleagues at the University of Lyon in France.  The team monitored the dynamics of thousands of discs, trapped between two concentric cylinders. Their work could provide valuable insights to scientists attempting to explore the complex mathematical behaviours of seismic events.

Seismologists often study the properties of earthquakes by recreating them on small scales in the lab. So far, this has largely involved compressing rocks or collections of grains, until cracking or slipping occurs. To an extent, these approaches can mimic the fracturing and stick-slip behaviours typical of seismic events. However, such experiments have yet to recreate three statistical laws that are obeyed by all earthquakes observed on Earth.

The first is the Gutenberg-Richter law, which describes a logarithmic relationship between the magnitude of earthquakes, and the number of them that occur over a given time. The Omori law relates the number of foreshocks and aftershocks to the magnitude of an earthquake. The third law describes how the time gap between two earthquakes is strongly correlated to the magnitudes of the earthquakes.

Stressed discs

The latest experiment focussed on a single layer of 3500 small discs (about 7 mm diameter) that were trapped in the narrow space between two concentric, vertical cylinders. The top of the discs was then weighed down by a heavy ring, while at the bottom, a spinning plate completed one full rotation every 18 hours. As they were subjected to increasing shear stress, the optical properties of the discs change. This allowed the team to use an array of cameras to image the forces between discs. In addition, the energy and seismic waves propagating through the discs were tracked by torque sensors and acoustic detectors attached to the top ring.

The cameras revealed a continuously changing network of chain-like forces as the discs shifted relative to each other; continually redistributing stress throughout the system. Over 24::h, the sensors revealed that the torque of the overall system dropped suddenly around 2000 times, while acoustic waves were emitted almost two million times. These observations were consistent with the Gutenberg-Richter law, the Omori law, and the inter-event times as quantified by seismologists.

Having successfully recreated these three statistical laws in the lab, Ramos and colleagues now hope to further modify their setup to explore the dynamics underlying real earthquakes in more detail. By fine-tuning the pressure exerted by the heavy ring, as well as the rotation speed of the bottom plate, they could soon pin down the precise dynamics which govern seismic events. In the future, such insights could help seismologists to identify precursors to large-scale earthquakes from seismic data.

The experiment is described in Physical Review Letters.

Emerging photovoltaic technology efficiencies line up

What was the motivation behind publishing this table of efficiencies?

Ten years ago the search for new materials that can bring additional advantages with respect to those we already have, started to gain momentum. These materials might be used on flexible or transparent substrates or are formed exclusively from elements that are very abundant or very cheap. So many groups started to work on these materials.

The situation right now is that we have many emerging materials that are not summarized very well anywhere. There is a paper – very similar to ours – tabling the progress in conversion efficiency in very well established technologies. That table is published every six months [since 1993] in Progress in Photovoltaics by Wiley, however it is limited to technologies at the industrial stage. Our idea was to put together all these emerging technologies that are not considered in the other papers, so that the community can follow all these sometimes very complex and diverse materials and identify the most promising ones.

I had been thinking of doing something like this for two to three years – in part it was out of frustration. We work with new materials, so we try to be at the forefront and stay very up to date on the materials that are most relevant in the future, but it is very frustrating to get this information because it takes such a lot of time. We are researchers and have to dedicate our time to research projects – justifying projects, applying for projects and supervising theses – and to have this simplification in our lives should be very useful.

For this first edition we are seven authors – two from north America, two from Europe and two from Asia and we asked Aron Walsh to give a review of modelling these materials.

What led you to include the review?

This is the difference between our efficiency table and the table for photovoltaics already published every six months. Because it is a very dynamic field with new efficiencies and new materials every month or so, to have a section in the paper that contemplates what we consider to be very relevant at the time of publishing is very useful for readers. So it is a short section – not enough to be a topical review in itself, but a highlight of the year for emerging technologies.

This time we decided to include a section overviewing modelling. Because these materials are very new, modelling is very important to understand the properties. There are a lot of things to work on and we are waiting for theoreticians to give us input as to what might be useful or interesting to do in the lab. The idea is to publish a new edition each year and in the next edition to invite other scientists who will review topics that are very new and emerging in photovoltaics.

How did you decide on the scope?

We decided to limit these efficiency tables to inorganic materials because the technologies for these materials are normally quite similar and easier to compare. The organic compounds or hybrid compounds are also of course beautiful, very relevant and very important but they use different device structures, different contacting layers, and different configurations. Even the physics behind all the devices can be quite different. So it is more difficult to cross link all these materials. As a result, we focus our attention on the inorganic compounds.

Even in inorganic materials we have a lot of materials to analyse – but on the organic side there are probably even more. In the future it may interesting for the journal to produce something similar for organic or hybrid materials [but with specialists in those materials].

I have always worked with inorganic materials. I did my PhD thesis in a material that is quite relevant to energy applications – CdTe. Back then I was working on it for a different application – nuclear energy – but I had interactions with other groups who were working on it for solar energy, and this really caught my attention. So when I finished my PhD thesis, and my interest in renewable energy increased, I found a post doc position in this field in France. There I developed all my knowledge in thin film semiconductors for photovoltaic applications. I have now been working on this class of materials for energy applications for 14 years.

What led you to limit the table to devices with certified efficiencies and a minimum area?

Certification is very important and very common for materials at commercial stage, but not for emerging materials. So the first message we wanted to give to the scientific community is that it is very relevant to certify our devices even if the efficiency is not as high as we want or is in the range of 5–10%. It is very important to certify because it gives an extra level of confidence for other researchers.

In terms of area we try to use an area that is representative of other devices. Sometimes you can’t measure the area because it is quite difficult to exactly define it for certain architectures. However in solar cells with very small areas you can have some collection from solar cells that are close by. If your solar cell is big enough this is negligible but when you reduce the size a lot it is hard to distinguish whether all the current you are obtaining is from your solar cell or if you have an important contribution from the neighbouring solar cells, so you can get mistakes.

There are also what we call “notable exceptions” [devices in the table that do not meet the efficiency and area criteria]. These are the result of brainstorming among the authors. We based them on what parameters we can really be sure about and trust, and parameters with limited error, as this can be very big, more than 10% for example. So it was based on our experience and consultation with people with more expertise than us in metrics for photovoltaics modules.

You plan to publish new tables each year – sounds like a lot of work.

It was a lot of work for six people over several months to do the first table – and we are very familiar with these materials. This year is the first and we have developed a methodology. In principle we expect it to be easier in future years. Each author has a particular group of materials and each of us is following materials that are quite related to what we are doing in the lab, so we are used to staying up to date on developments in them.

What might future editions feature?

We work in a democracy and will decide altogether what to include and what the highlight of emerging technologies should be. But I will propose either the full inorganic perovskite compounds or low dimensional,  1 or 2D compounds. They are emerging fast with very nice progress and very nice results.

The full table can be found in Journal of Physics: Energy

Perovskites a single crystal unit thick stand free

Perovskites may be the next material to get the full 2D makeover, according to studies by a team of researchers at Nanjing University in China and the University of Nebraska-Lincoln and University of California, Irvine, in the US. While previous work by other researchers had suggested that the crystalline lattice of free-standing perovskites would collapse in films less than five crystal lattice units thick, the researchers led by Peng Wang, Yuefeng Nie and Xiaoqing Pan have now fabricated perovskite in free-standing single unit cell layers.

Regular readers of Physics World  will already be familiar with perovskites, particularly in our coverage of optoelectronic devices such as solar cells and LEDs, as efficiencies of devices using these materials have skyrocketed in recent years. They are a class of materials with the formula ABX3, where A and B are metals and X is usually oxygen, and they exist in a number of crystal structures including rhombohedral-like, tetragonal-like, orthorhombic, monoclinic and triclinic phases.

Perovskite studies have already identified a number of attractive properties including high-temperature superconductivity, colossal magnetoresistance, Mott metal–insulator transitions and multiferroicity, and interest in the possibility of identifying new behaviour in 2D forms of the materials has been high. However recent studies by researchers had suggested a practical limit as to how thin films of perovskite could be.

Delicate but stable

To isolate thin perovskite layers Wang, Nie and Pan followed the same procedure that had recently proved successful in other experiments that Harold Y. Hwang at Stanford University in the US had led. They grew the perovskite on a sacrificial layer of water-soluble Sr3Al2O6 (SAO) and then dissolved the SAO to leave a free-standing perovskite that could then be transferred to a whole range of other substrates, including silicon and holey carbon.

When the team led by Wang, Nie and Pan characterized their free-standing films using TEM using selected-area electron diffraction (SAED) and plan-view and cross-sectional high-angle annular dark-field (HAADF) imaging with atomic resolution they were able to confirm single-crystal phases, even in films just a single crystal unit thick. What they also noticed was that the films were very easily damaged by electron beams, so much so that HAADF measurements on the single layer samples were not possible. However other measurements that did not damage the samples were sufficient for them to draw their conclusions.

The researchers produced free-standing films of both SrTiO3 (STO) a non-polar oxide, and BiFeO3, which has a large ferroelectric polarization pointing through the cells of its rhombohedral lattice in the bulk. In their ultrathin films of STO they observed ripples similar to those seen in graphene, highlighting that while perovskites are brittle in the bulk there may be scope for electronic applications exploiting flexible mechanical properties. Their measurements of BFO films revealed a phase transition from a rhombohedral-like phase as they were grown to a tetragonal-like phase when isolated.

 “As useful as graphene”

The isolation of other 2D materials – such as graphene and transition metal dichalcogenides – has revealed a wealth of physics and technological potential that is not apparent from the behaviour of these materials in the bulk. The properties of these 2D materials are largely a result of the s and p orbital electron interactions. In contrast many of the properties that have attracted interest in perovskites so far arise on account of their strongly interacting d orbital electrons, so there are high hopes that isolating 2D perovskites will unearth material behaviour that has not been observed before.

“We anticipate that 2D perovskite oxides could become as useful as graphene in the discovery of unconventional 2D correlated quantum phases,” conclude Wang, Nie and Pan in their report. They highlight the superconducting properties from twists in bilayer graphene that launched a series of studies into heterostructure twistronics and add that the behaviour of misaligned perovskite sheets remains to be explored. “The ability to transfer any crystalline free-standing perovskite films onto silicon or other semiconducting wafers is likely to enable the direct incorporation of strongly correlated properties in conventional semiconductors, paving the way for a new generation of multifunctional electronic devices.”

Full details are reported in Nature.

Girls shut-out of design and technology, hyphens deter paper citations, moonlight over Normandy on D-Day

The mail in Spalding must be very slow because this week a parent in the English market town received a letter from the 1970s. She was told that her nine-year-old daughter and her classmates were doing a special morning of classes. The girls will be doing cooking and drama, while the boys will be doing design and technology.

Only this letter was not from the 1970s, it was written yesterday.

You can see the letter and the reaction on Twitter above. A bit of context: the children are in primary school and are visiting two secondary schools. Spalding High is an all-girls school while Spalding Grammar is an all-boys school. That is still no excuse for gender stereotyping in terms of what the children are doing.

Does adding a simple hyphen in a research-paper’s title affect how many citations it receives? Researchers at the universities of Hong Kong and Wollongong, claim that it does, regardless of the quality of the article. They found the mean number of citations for a physics paper with no hyphen is 110, but that figure drops to around 80 for papers that contain four hyphens. Intriguingly, paper titles with five or more hyphens, however, do slightly better, garnering just over 90 citations, on average.

“Our results question the common belief that citation counts are a reliable measure of the contributions and significance of papers,” says T H Tse from Hong Kong. “In fact, they can be distorted simply by the presence of hyphens in article titles, which has no bearing on the quality of research.”

Did the D-Day troops who landed on Normandy beaches 75 years ago rely on a late-rising Moon to surprise their foes? That has been a claim for many years, but now astronomers and historians have teamed-up to debunk it. You can read more in this Cosmos article: “Moonlight and stealth: how an author’s error created a myth about a WWII invasion”.

Copyright © 2026 by IOP Publishing Ltd and individual contributors