Researchers solve magic angle mystery

Exactly a year ago, researchers at MIT reported on observing superconductivity in twisted bilayer graphene – a new experimental platform engineered on two misaligned graphene layers – at “magic angles” near 1.1°. The origin of these angles was a mystery, however. A team at Harvard University has now shown that they appear to be fundamentally connected to quantum Hall wave functions.

Graphene is a flat crystal of carbon just one atom thick. When two such sheets are placed on top of each other with a small angle misalignment, they form a Moiré pattern. More surprisingly still, at the twist angle of 1.1°, the material becomes a superconductor (that is, it can carry currents with no losses) at 1.7 K. This effect disappears at slightly larger or smaller angle twists.

This result, obtained by Pablo Jarillo-Herrero and colleagues at the Massachusetts Institute of Technology (MIT), kick-started a flurry of activity in the field of “twistronics”, which is a fundamentally new approach to device engineering. Here, the weak coupling between different layers of 2D materials, like graphene, can be used to manipulate the electronic properties of these materials in ways that are not possible with more conventional structures – by varying the angle between the layers. After this discovery, researchers also reported on superconductivity and correlated (Mott) insulation in other similar systems – such as Moiré superlattices of three graphene layers on 2D boron nitride or twisted four layers of graphene.

Moiré superlattices

“The main idea in twistronics is to play with different crystal cell sizes and symmetries by introducing Moiré patterns,” explains Alex Jura Kruchkov, who led the present research effort. “Recently, for example, it was shown that the Moiré patterns in graphene sheets twisted to 30° form a 12-fold-symmetric quasicrystal – a type of atomic ordering ‘forbidden’ in old-school crystallography.”

The crystal structure of a single layer of graphene can be described as a simple repetition of carbon atoms, which is known as its unit cell. In a Moiré superlattice of two graphene layers stacked on top of each other, this unit cell expands to a huge extent, as if the 2D crystal was artificially “stretched” a hundred times in all directions. This stretching dramatically changes materials interactions and properties, and simply varying the angle between 2D material layers changes its electronic band structure. At small twists, the Moiré graphene superlattices can even be switched from fully insulating to superconducting, as Jarillo-Herrero’s team discovered.

Flat bands are key

Researchers first introduced the concept of magic angles back in 2011 when studying the electronic structure of small-angle twisted bilayer graphene and reported on gapless band flattening at these angles. Since flat band engineering is very challenging, they were happy to simply observe this effect – which was considered as being a lucky feat of material engineering.

“The emergence of flat bands in electronic band structures is an intriguing phenomenon in itself. In a simple, non-interacting, description, the flat band state means that an electron is dispersionless – that is, it does not matter how much energy you can pump into it, it will not move. Correlated electron behaviour appears when we add interactions, however.

There are only a few systems with flat bands – and scientists are looking for more because these bands promote exotic topological phenomena together with strongly-correlated states of matter. “Currently, the nature of superconductivity in twisted bilayer graphene is still being debated, but it is clear that the flat bands emerging at the magic angles play the fateful role,” says Kruchkov

One of the best-known examples of flat bands are the so-called Landau Levels in the quantum Hall effect, he explains. Introduced by Lev Landau at the beginning of the 20th century, the flat bands of electrons in an applied magnetic field were essential in explaining the integer quantum Hall effect, which is a topological phenomenon in flat (2D) systems in which the transverse (Hall) conductance is fundamentally quantized in units of e2/h (e being electric charge and h the Planck constant).

In their work, Kruchkov and colleagues showed that it is possible to create perfectly flat bands in twisted bilayer graphene. “Under this condition, the electron wave functions map exactly to the lowest Landau level in the quantum Hall effect (‘on the torus’),” explains Kruchkov. “In other words, it is as if the magic-angle Moiré patterns create artificial magnetic fields that the electrons ‘sense’.”

“Not just a matter of engineering material properties”

“At small twists the Moiré patterns are huge, so electrons effectively ‘forget’ about the underlying (small) graphene lattice and travel under effect of the larger and ‘calmer’ Moiré lattice,” he tells Physics World. “This is called the continuum model and it can be parametrized by the values of microscopic interactions at different atomic stackings in the bilayer. If there is no twist in the graphene bilayer, it prefers the energetically more favourable Bernal (AB) stacking. What happens under twists is that the Moiré pattern introduces both AB-stacked and AA-stacked regions.”

Since they are energetically preferable at smaller twists, regions of AB stacking dominate and regions of AA stacking shrink, he explains. This dramatically suppresses the value of AA interactions compared to AB ones. In their discovery, the Harvard researchers show that if the AA interactions are fully “switched off”, the electron bands become perfectly flat exactly at the magic angles – reminding us of a perfectly flat Landau level.

“The emergence of these flat bands is thus not just a matter of engineering material properties – as previously thought – but is related to the flatness of the lowest Landau level and has deep hidden connections to quantum Hall wave functions on the torus,” says Kruchkov.

“Finding such a surprising link between two seemingly different subfields of physics is unusual. At the heart of our work is a fundamental model with perfectly flat bands that induce robust periodicity in the magic angles. In fact, if parametrized as α =(material constant)/(twist angle),the magic angles in our model follow a remarkable sequence with the robust asymptotic periodicity Δα= 3/2, something that has never been reported on before.”

The Harvard physicists also show that the principal magic angle can be very precisely calculated and that its value is the same as that reported in experiments. They believe that exotic magic-angle phenomena could occur in other van der Waals layered devices, and they are now actively investigating these systems.

Full details of the research are reported in Physical Review Letters.
Einstein’s general theory of relativity passes a supermassive test

A key aspect of Einstein’s general theory of relativity (GR) has been tested using the strongest gravitational field so far.  The measurement was made by observing changes in optical absorption lines of a star orbiting close to Sagittarius A* – the supermassive black hole at the centre of the Milky Way.

The work was done by physicists working on the GRAVITY Collaboration, which uses the Very Large Telescope at the European Southern Observatory in Chile.

Since it was first proposed in 1915, GR has stood firm against every experimental challenge that physicists have come up with. Many of these tests have focused on an important tenet of GR called the Einstein equivalence principle (EEP). Detecting a breakdown of the EEP could point towards new physics beyond GR and could provide important clues about how to develop a quantum theory of gravity.

Different systems

One key element of the EEP is local position invariance (LPI), which says that local nongravitational measurements on a system must be the same, no matter where they are measured in space-time. LPI has been tested by comparing the properties of two different systems as they both experience the same change in gravitational potential. If LPI holds, then the change in gravity should affect both systems in the same way. If LPI is violated, however, gravity would affect the systems differently and this could be detected.

One such test compared the timekeeping of two different types of atomic clock as the gravitational pull of the Sun changes throughout the year – a result of Earth’s elliptical orbit. Another test involved looking at the colours of the light emitted from iron and nickel ions in white-dwarf stars and comparing it to the light emitted from the same ions on Earth – where gravity is much weaker. In both cases, the two systems changed in the same way and no violation of LPI has so-far been detected in these and other experiments.

This latest research by the GRAVITY Collaboration uses observations of the absorption spectra of hydrogen and helium atoms in a star called S2, which closely orbits Sagittarius A*. The supermassive black hole has a mass of more than 4 million times that of the Sun and S2 has a highly eccentric orbit. This means that S2 experiences a huge change in gravitational potential during its journey around Sagittarius A*.

Close encounter

The GRAVITY team measured the hydrogen and helium absorption lines from S2 over three years as it made its closest approach to Sagittarius A* in May 2018. Within the measurement’s margin of error, the positions of the hydrogen and helium absorption lines shifted according to the predictions of GR with no evidence for LPI violation.

The GRAVITY team says that their measurements were made in a gravitational field 1 million times stronger than that available on Earth and 10 times stronger than the white-dwarf observations. However, they expect this record to fall once the Extremely Large Telescope begins operation in Chile in 2024. This telescope should be able to study stars even closer to Sagittarius A* than S2, which would be subject to even larger fluctuations in gravitational potential.

The study is described in Physical Review Letters.

Point-of-care PET scanner offers interactive imaging

PET detectors and sampling pattern

Molecular imaging technologies such as PET are employed for in vivo diagnosis, evaluating disease progression and guiding therapeutic interventions. PET also offers potential for imaging of novel theranostic ligands currently under development for personalized treatments. Standard whole-body PET systems, however, require installation in a large, dedicated scanning room and may not be the most cost-effective way to support translation of novel PET ligands. Furthermore, it’s not always feasible to transfer a patient to the scanner.

What’s needed is a mobile and versatile PET scanner that can be brought to the patient for imaging at the bedside or in a treatment room. A team from Washington University in St Louis is developing just such a device: a point-of-care (POC) PET scanner for 3D tomographic molecular imaging. The compact POC-PET will use fast image reconstruction to give live feedback to the operator, enabling interactive scanning to optimize image quality (Med. Phys. 10.1002/mp.13397).

Yuan‐Chuan Tai

“The POC-PET may be used to provide near-real-time feedback in order to understand and optimize the delivery of the new theranostic ligands in their development phase,” says senior author Yuan‐Chuan Tai. “It may also be used to validate the delivery, or customize the dosing, of theranostic ligands to tailor the treatment protocol and support individualized medicine.”

Prototype device

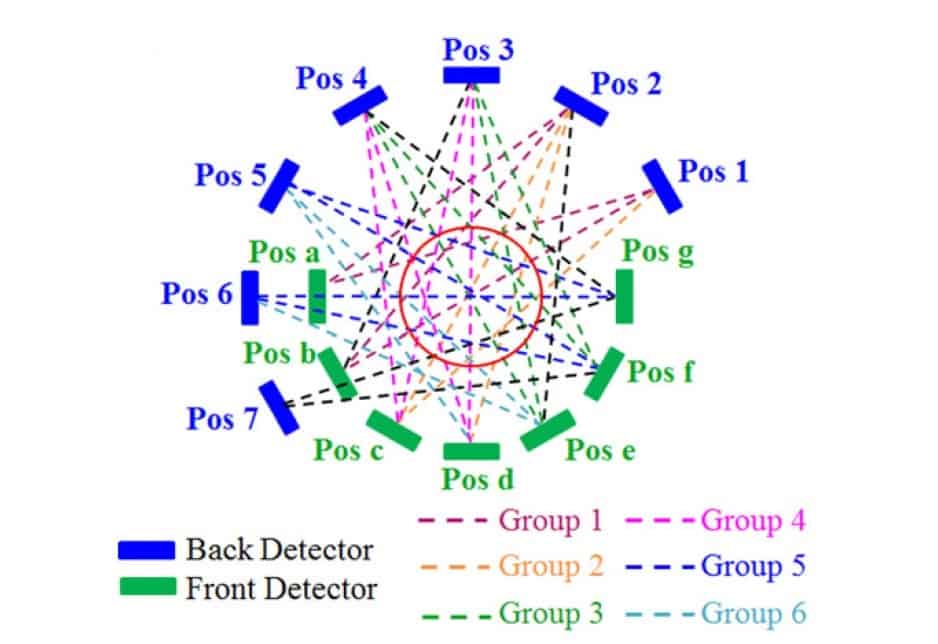
Tai and colleagues constructed a proof-of-concept prototype POC-PET using two planar PET detectors, each comprising a 48×48 LYSO crystal array coupled to a photomultiplier tube. One detector is attached to a rotation stage and the second is mounted on a six degrees-of-freedom robotic arm, enabling collection of coincidence events from multiple angles around the target.

The researchers employed a fast 3D image reconstruction engine — implemented on multiple graphics processing units (GPUs) — to read in the coincidence events and detector geometry, and perform list-mode reconstruction using a simplified system matrix. The system matrix is computed on-the-fly, based on the changing detector position. As data are continuously collected and reconstructed, the system displays updated images in near real-time.

To characterize the prototype, the researchers first imaged a plane source between the detectors. Flood images showed that only the central 38×38 crystals in each array could be clearly resolved and used for subsequent imaging experiments. The PET detectors exhibited a coincidence resolving time (CRT) of about 740 ps FWHM for central crystals.

Next, they used the POC-PET to image a cylindrical phantom containing nine tumour spheres (with diameters of 3.6–11.4 mm) filled with 64Cu solution. They moved the two detectors to seven different locations and collected coincidence events from 27 sampling angles.

List-mode events reconstructed without TOF information contained visible artefacts, plus a hot spot outside of the phantom. In contrast, images reconstructed with TOF information had significantly reduced artefacts. The GPU-based image reconstruction took approximately 48 s for 10 iterations.

Phantom imaging

Monte Carlo studies

Tai and colleagues also conducted Monte Carlo simulations of the POC-PET prototype, modelling the same set-up as in the experiment. Again, images reconstructed without TOF data exhibited more artefacts than those employing TOF information. Detectors with the fastest timing performance (coincidence resolving time (CRT) of 300 and 100 ps) produced the best image quality, with the smallest lesions (3.6 and 5 mm) only clearly visualized with a CRT of 100 ps.

To evaluate the proposed interactive scanning, the researchers divided the simulated list-mode data into six groups and reconstructed six images by adding one data set at a time, with or without TOF information (using a CRT of 300 ps). Four or five groups of data were sufficient to achieve a useful image, and reconstructions using TOF data showed fewer artefacts. The reconstruction time was approximately 65 s for ten iterations.

Tai notes that detectors with sub-300 ps CRT are now commercially available, and are becoming an industry standard for clinical PET. “It is not easy to achieve 100 ps CRT, yet,” he says. “However, our simulation suggests that 300 ps CRT will be sufficient to build a useful POC-PET system.”

Finally, the team simulated a body-sized torso phantom (containing 4–11 mm diameter tumours) imaged by a larger POC-PET system. The scanner included a front panel with 4×6 PET detector modules, each having 32×32 LYSO crystals, and a back panel with 3×8 PET detector modules, each made of 16×16 LYSO crystals.

The researchers imaged the phantom from four angles, reconstructing list-mode events from one sampling angle then adding an additional angle until all events were included. Image reconstruction took 55 s for a single angle and 108 s when using all of the data. They note that even with just three sampling angles, most tumours were resolved. Using four sampling angles clearly identified all tumours. These results suggest that a high-sensitivity POC-PET system could interactively image a body-size object in less than 7 min.

The researchers are now seeking funding to develop a product prototype. “We envision that a clinical POC-PET scanner may contain a panel that can be mounted behind a chair (or bed) and a manoeuvrable detector panel,” Tai tells Physics World. “It is significantly smaller than a standard body-sized PET scanner design and offers great potentials for future molecular imaging applications.”

Planets could be formed by interstellar objects like ’Oumuamua

Interstellar objects like the recently-discovered ’Oumuamua  could act as the seeds from which planets grow around young stars. That is the conclusion of Susanne Pfalzner of the Jülich Supercomputing Centre in Germany, and Michele Bannister of Queen’s University Belfast – who have modelled how these exotic objects could give the planet-formation process a jump start.

Theories of planet formation describe how dust in discs around nascent stars accretes into ever larger clumps, eventually merging to become protoplanets. These models suggest that this process will take many millions of years and they do not provide clear reasons why collisions between clumps do not bring the process to a halt well before protoplanets form. As a result, these theories are at odds with observations of giant planets around stars that are just a million years old – leaving astronomers asking how did these planets grow so fast?

Pfalzner and Bannister’s answer is that various barriers to speedy planet growth could be bypassed if planet-forming discs were seeded by ’Oumuamua-sized objects. Their idea seems reasonable because such objects should be extremely common. Based upon the presence of ’Oumuamua in the solar system, and the constraints placed upon the number of similar objects by limited sky surveys, scientists estimate that there could be as many as 1015 – a thousand trillion – ’Oumuamua-sized objects in every cubic parsec of space (one parsec is 3.26 light-years). Since the molecular clouds from which stars and planets form are many light years across, they should therefore be teeming with ’Oumuamua-like objects.

Cosmic dandelions

Astronomers believe that interstellar objects can be created in several different ways. They could be left-over building blocks of planets shed early in a planetary system’s life, for example. Or they could be bodies on the edge of planetary systems that disperse when their host stars die. Bannister likens them to dandelion seeds, drifting away to give birth to new planets elsewhere.

“We know that as planetary systems form and evolve, they scatter trillions upon trillions of objects into the galaxy, so this is very much just a feedback effect,” she tells Physics World.

Many of the ’Oumuamua-type objects within the molecular clouds will be consumed when they fall into young stars. However, tens of millions of objects should survive, embedded within the planet-forming discs. Their gravity would draw dust and smaller pebble-sized clumps onto them, allowing them to grow. “This would speed things up considerably,” says Pfalzner, creating fully-formed planets that are just a million years old.

Revolutionary thinking

The new model, if correct, could revolutionize our thinking about how planets, including those in the solar system, formed.

“I think their hypothesis is plausible,” says Jane Greaves, a planet-formation expert at the University of Cardiff. She points out that it avoids one of the main sticking points of planet formation, in that as small clumps of dust collide at high speed they tend to fragment rather than merge, but when these small particles hit a much larger body, they embed themselves into the target, allowing it to gradually grow in mass.

“The ’Oumuamua seeds would provide a very useful source of these targets,” she says, although she cautions that the subsequent collisions between the ’Oumuamua-sized bodies to build even larger planetesimals require further study.

A paper describing the process has been accepted for publication in The Astrophysical Journal Letters. It raises the intriguing notion that planet formation may not have been as efficient in the past. The first planets in the universe would not have had ’Oumuamua-like seeds available, and so they may have formed slowly. As more planetary systems formed, and their stars died, more objects like ’Oumuamua would be drifting into interstellar space, increasing the chances that they could become seeds for new planets. “Space is filling up with this stuff over time,” says Pfalzner.

“Planet formation was potentially a little bit less efficient in the past,” says Bannister. However, she describes how future work, involving building numerical simulations to show how this planet-forming efficiency grows over time, will “be fun to work through, building a galaxy-wide model incorporating interstellar objects, their velocity distributions, their density and planetary formation efficiency as a result”.

Can crude analysis alone determine prospects for energy materials?

Unprecedented economic growth (2000–2008)

In August 2006 the price of crude oil peaked at just over $76/barrel having risen steadily through the early part of the decade. At the same time, global financial markets had bounced back from the dot-com crash of 2000 and despite the relatively high oil price, at least three all-business class airlines operated daily scheduled flights from London to New York. For business, these were the good times.

They were also good times for alternative energy because companies based in fossil fuels were reinvesting a significant proportion of revenues from core business, back into research and development (R&D). In the early part of the decade, the oil majors had investment portfolios that included solar, wind, hydrogen and biofuels. BP and Shell in particular developed successful photovoltaics (PV) businesses, manufacturing modules based on crystalline Si and thin film CuInSe2 respectively. Although by the mid-2000s, the cost of electricity from solar PV was still prohibitively high, prompting both BP and Shell to exit solar PV, they continued to focus investments in renewables including wind and – a sector naturally aligned to hydrocarbon supply chains – biofuels.

There is perhaps no better illustration of this period of exceptional economic growth than the march of the price of crude to an all-time high of just over $145/barrel in July 2008, at which point the global economy crashed spectacularly and crude dropped to under $50/barrel in just six months. As the ramifications of the global financial crisis (GFC) emerged, the oil price reflected investor uncertainty towards the end of the decade. With such uncertainty, the oil majors divested significantly to focus on core, large-scale oil and gas projects. This included in 2010, Shell’s exit from the London Array wind farm, which at the time was the world’s biggest wind project. The future for renewable energy seemed bleak.

Step forward renewables: A UK case study (2008–2018)

In the UK, government policy in response to the GFC was a reduction in public spending. Yet while other sectors suffered from funding cuts, the government continued to deliver on a commitment to introduce a financial incentive scheme for renewable energy technologies known as feed-in tariffs (FiTs). These had been successful in other countries such as Germany, and provided a key mechanism to achieve linked sustainability targets to curb CO2 emissions mandated by the government and the European Union. Informed by PV system performance research at Northumbria University, the FiT set for domestic PV installations offered an attractive return on investment for consumers of 10‑20% over the course of 25 years depending on installation costs. This was in stark contrast to savings rates on the high street that, after factoring in inflation, offered a negative return on investment. The cost of the FiT scheme was in fact borne by energy suppliers, which in turn passed this on to consumers. As a result, under strong political pressure to reduce the cost of energy bills, the UK government acted swiftly to ensure this window of opportunity lasted only 18 months by halving the FiT rate in December 2011.

Nevertheless, the overall result of the FiT scheme was to increase the installed capacity of domestic PV installations in the UK by two orders of magnitude in just over two years from its introduction. In other words, an increase of ~350,000 systems mostly on the roofs of houses. This remarkable growth in domestic PV installations in the UK is only one part of a solar story in the UK, which resulted in PV contributing a quarter of the total electricity supply on a sunny day in May 2017. Growth in ground-mounted solar farms in the 5–25 MW range kicked in early in 2013, slightly later than domestic systems most likely as a result of the longer incubation times associated with more complex planning and grid connection issues. Ultimately, these projects became increasingly attractive large-scale investments due to falling PV module prices. By 2018 they added approximately 4 GW of supply, which is around a third of today’s overall PV capacity of  around 12 GW.

For wind energy the story is just as compelling when one considers that in the UK alone, 29.3% of electricity generation came from renewable energy fuel sources in 2017, and exactly half of this generation was from wind turbines. This demonstrated strong growth from 2010 when wind energy contributed approximately 2.5% of electricity supply, and provided a key contribution to energy security while meeting emissions targets. Similar to solar PV, the main driver of this growth was also the introduction of financial incentive schemes. Notably, although wind energy essentially remains subsidized in this market, solar PV is moving rapidly towards being subsidy-free while, crucially, remaining competitive.

The bigger picture (present)

In contrast to the PV electricity share in the UK, globally this figure stands at just 1.7%, indicating plenty of untapped market potential. History tells us that this figure is strongly sensitive to local subsidies which for example, appear to have worked well in Germany and the UK but not in Spain where an over-generous incentive scheme ultimately resulted in a solar tax. In that case, those who installed renewable energy technologies were ironically penalized because the incentive scheme rapidly became unaffordable.

The Spanish case aside, the biggest story in solar today is that the levelized cost of electricity (LCOE) from PV is now competitive with fossil-fuel based sources. The driver behind this trend is Chinese PV manufacturers, who continue to sell modules at barely more than the cost of raw materials despite European and US anti-dumping policies. Some of these companies have posted very recent profit warnings that, if reproduced across the sector, will result in price stabilization or even rises. However for now a notable consequence of the drop in the LCOE from PV, alongside the Paris Agreement of 2016, is the market re-entry of both BP and Shell with recent investments in solar farms, including BP’s Lightsource and Shell’s Silicon Ranch.

New technologies and sustainability challenges (2018–2030)

So what do the past 18 years tell researchers working on advanced materials for energy? First and foremost, we need to be realistic and accept that for large-scale power generation, cost is fundamental. In 2018, the PV market was 95% crystalline silicon. This is sustained by the growth of large-scale solar farms, which have continued to drive down PV module prices through economies of scale to the extent that they may be considered almost a commodity product.

Despite their success so far, these PV modules are not necessarily suitable for new applications enabled by massive proliferation in distributed and interconnected devices because of scale limitations and the reliance on conventional, less versatile semiconductor wafer processing fabrication. Tesla had some success in achieving miniaturization with their Tesla solar roof tiles, which look like regular tiles but operate as solar cells. However although they created a lot of excitement on their release in 2016, they are seemingly not cheap or quick to install, and so far uptake has been limited. That said if efforts to overcome issues of scale and fabrication are successful, in sectors such as transport and healthcare PV modules could offer benefits beyond basic power generation. For example, they could provide complementary or back-up power sources that reduce range anxiety for electronic vehicle users, facilitate ultra-long flight for low-orbit Earth observation, power small-scale portable devices and generally provide a safety net for devices primarily fuelled by other means. The combination of offering new benefits at a smaller, more distributed scale, would mean that PV doesn’t have to compete with fossil fuels on a purely $/kWh basis. PV technologies with new properties and functionalities such as thin film and perovskite, which can be synthesized in solution on flexible substrates, could then compete more effectively.

Analysis…reveals a relative insensitivity to the oil price but a sensitivity to subsidization

An additional factor in recent PV competitiveness is appropriate integration with battery storage. For example, the recent installation of a 10 MW solar farm in Bedfordshire UK without subsidy was enabled by the installation of a 6 MW battery. There can be no doubt that the development of lithium batteries is enabling new applications such as electric aerotaxis (where correct PV-battery systems integration is vital) but there is an important distinction from PV materials: lithium is approximately 10,000 times less Earth-abundant than silicon. Comparison with indium suggests that although Earth-abundance will be important for cost, it may not be prohibitive. Indium has been commercialized successfully in high-value products such as indium tin oxide displays, despite being 100 times scarcer than lithium. Toxicity is potentially a larger barrier to commercialization and has been identified as a strategic issue for sustainable innovation by the European Commission.

Most commercial solar PV modules are certified to the International Electrotechnical Commission’s requirement of ≤0.8% degradation per year for 25 years, which defines a natural timescale for replacement. This means that new, high-efficiency PV technologies based on materials innovations for example in nanotechnology, must be proven with a distinct value proposition as early as 2030 in mature markets where widespread replacement may occur within a relatively limited period. However with materials sustainability also now a key driver, researchers must add the lifecycle of an energy material to performance criteria. Replacement of PV modules also presents specific recycling challenges and while the aluminium frames have clear and accessible value, encapsulated high-value elements such as silver-coated tabbing wires are technically more challenging and energy intensive to recover. Nevertheless, this is an area that offers opportunities for innovation and is not unique to a particular PV cell technology. Similar to PV modules, a typical wind turbine can be expected to be in operation for 20–25 years, and replacement in a sector that has seen enormous recent expansion will generate significant quantities of materials excess. Again, some components (masts, nacelles) will be compatible with existing recycling supply chains but turbine blades, which are glass or carbon fibre composites, are not. New and economic separation processes and approaches that target the interface between materials will be increasingly valuable.

Analysis of the past 18 years in renewable and sustainable energy reveals a relative insensitivity to the oil price but a sensitivity to subsidization. Too little incentive makes it difficult to achieve critical mass, while too much incentive defeats the objective. However, by the time effective subsidies are introduced, technologies are a long way from the laboratory. Electric vehicles are an example application where critical mass has not yet been achieved (although global leader Norway is the exception with approximately 39.2% market penetration) but although subsidy levels may vary from country to country they will universally apply to technology that is lithium based. This is challenging for energy materials researchers particularly in the context of funding objectives that are increasingly linked to economic prosperity.

In the near term, the materials innovations that have the greatest chance of success are those that play to new and niche markets in generation and storage, together with those that enable energy efficiency and recovery of high-value materials through viable recycling. In the long term, certain constraints will become more relaxed because the provision of new benefits, such as autonomous battery recharging, will provide a competitive advantage for PV technologies that are currently too expensive or have too short a shelf-life to compete with silicon. Ultimately, those who can convert energy cost competitively at the point of use have a strong proposition.

Acknowledgements

The author is particularly grateful to Alex Savidis of Narec Distributed Energy for useful discussions and colleagues at NUPV.

Cricket bacteria break down recalcitrant waste

A micro-organism discovered in greenhouse camel crickets can degrade lignin from wood, say researchers in the US. The new finding, which kickstarted thanks to a citizen science project, could help in the quest to find other organisms that break down different types of polluting waste, such as plastic.

Many industrially produced compounds are relatively hard to degrade. Indeed, some are produced to be intentionally tough and long lasting. We not only need to reduce the production and accumulation of these recalcitrant materials in the future, say the researchers led by Stephanie Matthews of Campbell University and Rob Dunn at NC State University, we also need to urgently find ways to degrade those already present in landfills and the environment in general.

Degrading microbes

One promising strategy for dealing with this waste is to find microbes that can break it down. “We knew that camel crickets can eat almost anything, so we began to wonder what bacteria might be present in a camel cricket’s gut that allows them to do this,” says Dunn.

The researchers identified and tested a range of microbial organisms in camel crickets and focused on a strain of bacteria called Cedecea lapagei as being of particular interest. They found that this micro-organism can degrade lignin – the polymers in plant cells that make wood tough.

Lignin (or lignocellulose) is the most abundant biopolymer on Earth and is very difficult to break down. It could be used as biofuel, however, if it could be degraded into its sugar molecules. This is no easy task since lignin contains several types of monomers and distorts when chemically processed. Paper factories, for example, often simply incinerate it and use it for fuel rather than try to convert it into commercial bioproducts.

C. lapegei may be a valuable new resource in this context since it is capable of surviving in a wide range of conditions, says Matthews.

“What are they good for?”

The work was inspired by a 2014 citizen-science study involving camel crickets, in which the participants asked the researchers what these creatures (which are commonly found in our homes) might be good for. “It was this question that led us to consider more specifically whether their gut microbes might be able to live in and degrade black liquor – a waste product from the paper pulp industry that consists mainly of lignin,” explains Dunn.

In their experiments, the researchers began by sterilizing the surface of camel crickets as well hide beetles (Dermestes maculatus), another common insect, to kill any bacteria on their exoskeletons and so focus on the ones in their gut only. They then homogenized the creatures and grew the bacteria on multiple food substrates, including both lignin on its own and lignin in black liquor.

“We then identified the bacteria that grew, compared them to known bacteria and subsequently studied them in more detail,” explains Dunn. “These studies included identifying some of the genes and enzymes of these bacteria that might be responsible for their unique abilities to grow on and degrade lignin.”

Repeatable approach for other types of waste

“As well as identifying bacteria potentially able to turn pulp paper waste into energy, and hence get rid of a pollutant, we’ve identified a repeatable approach to finding new useful organisms that might break down other types of waste,” Dunn tells Physics World. “This might include plastic or other products that cause major pollution problems.”

This project highlights the value of a workflow that starts with the study a particular ecosystem, evaluates the role of organisms in that ecosystem and then becomes increasingly specific – down to the level of each organism’s microbiome, adds Mathews. “At each step, you are collecting information that allows you make increasingly informed decisions about where to look for microbial resources that may have practical applications.”

The research is detailed in Royal Society Open Science 10.1098/rsos.180748 and is free to read.

Collecting the materials that give art colour, entangled in the space between art and physics


This week’s Red Folder has an arty theme. First up is a fascinating video from Tom Scott, who visits the Forbes Pigment Collection at the Harvard Art Museums in the US. It is a fact-filled tour of the many different paints and pigments that have been used by artist’s through the ages. Highlights include some interesting insights into how science is used to spot forgeries.

If you happen to be in north-eastern Sweden you might want to visit Umeå University, which is hosting an art exhibition called Entangle / Physics and the Artistic Imagination. The show is curated by Ariane Koek, who founded the Arts at CERN residency programme. Indeed, four of 14 the artists featured in the exhibition have done residencies at CERN.

You can read much more about the exhibition in “‘Entangle’ exhibit fuels imagination with physics”, which also has a selection of photographs of the objects on display.

Metamaterial computer solves integral equations encoded in electromagnetic waves

Metamaterials have been used by researchers in the US to solve mathematical problems by transforming data that are encoded into electromagnetic waves. The researchers believe their new analogue computing paradigm offers several advantages over conventional digital computers and are now working to make it compatible with traditional silicon photonics devices.

Metamaterials are synthetic, compound materials that are structured in ways that give them specific properties — such as a negative refractive index – that are rare or absent in natural materials. To design optical metamaterials, researchers often rely on a branch of mathematics called transformation optics, which transforms the coordinates of space to control the path of light through a material. A famous example is the invisibility cloak whereby transformation optics is used to control the refraction of light in the cloak so that incident light travels smoothly around the cloaked object rather than scattering off it. The result is that an observer will conclude that the cloaked object is not present.

In 2014, researchers led by Nader Engheta of the University of Pennsylvania proposed another possible use for transformation optics. They pointed out that electromagnetic waves encode mathematical functions in their amplitudes and phases – both of which can be transformed by metamaterials. This led the team to suggest that metamaterials could perform mathematical operations on these functions.

Integral equations

Now, Engheta and colleagues have designed a metamaterial that not only performs mathematical operations but can also find solutions to an important class of equations called integral equations.

“In almost any field of science and engineering you can describe the numerical values of the phenomena that you are after using integral equations,” explains Engheta. Solving these equations is therefore vital to modelling a wide range of phenomena. Algebraic solutions are often impossible, however, so researchers often must rely on computational analysis. This involves rearranging the equation so that the unknown solution appears on both sides. Starting from an arbitrary point, the calculation is then run repeatedly in a feedback loop until the correct solution is reached. At this point, performing the mathematical operation described by the equation does not change the value, so the solution remains stable.

“That takes time,” explains Engheta, which is why finding numerical simulations can often require significant computational resources.

Speed of light

The researchers believed metamaterials could offer several important advantages over this conventional digital process. One benefit is that the computational process could be extremely fast because electromagnetic waves pass through metamaterials at the speed of light. Also, the same metamaterial can process multiple waves simultaneously: “Waves can pass through each other, giving you a parallel system,” explains Engheta.

To test their ideas, the researchers designed metamaterials from carefully-patterned dielectrics to perform mathematical transformations related to three different integral equations. Computational modelling of how electromagnetic waves interact with the metamaterials suggests that the solutions provided by the hypothetical systems should agree very well the solutions obtained from traditional numerical methods. Furthermore, the computational modelling suggests that the metamaterial systems can reach the correct solutions very quickly.

The team also created a metamaterial in the lab for one of the integral equations (see figure). It was made from patterned low-loss polystyrene and is designed for use with microwaves. The team found that its performance was in very good agreement with computational predictions.

In future, the researchers aim to build their metamaterials from a silica dielectric, which would make integration with standard silicon photonics devices easier. A silica dielectric metamaterial would also allow infrared light at telecom wavelengths to be used to perform calculations. This means that future devices could be much smaller than the microwave prototype.

The team also hopes that in the future reconfigurable metameterials could be developed, effectively creating a kind of reprogrammable analogue computer. Nevertheless, stresses Engheta, the present platform does not offer the prospect of an alternative to the conditional logic of a true computer, in which one computation depends on the outcome of another: “We don’t have any optical logic here,” he says.

Andrea Alù at the City University of New York was involved in the 2014 research and continues to work independently on computing based electromagnetic waves. He praises Engheta and colleagues for turning the original idea into reality. “I find it interesting because it’s not at all trivial that this can be worked out, especially given all the tolerances present.”

The research is described in Science.

Raman spectroscopy guides brain biopsies

A Raman spectroscopy guidance system integrated within a brain biopsy needle can help neurosurgeons identify malignant tissue for stereotactic biopsy sampling in real time. The ability to interrogate brain tissue at the tip of a biopsy needle, with minimal disruption to the surgical workflow, can help ensure that biopsy samples are collected in locations where cancer cell densities are high enough for reliable diagnoses. Such a system could help improve the diagnostic yield of biopsies and optimize treatment planning.

The guidance system was developed and validated by researchers from the Montreal Neurological Institute and Hospital of McGill University and the Polytechnique Montreal. The team successfully tested a second-generation Raman probe in the surgical biopsy procedure of one patient with glioblastoma and two patients with lymphoma. The probe was able to collect high-quality spectral data efficiently in a clinically acceptable time. These spectra contained the expected tissue features and exhibited similar spectral characteristics to in vivo and ex vivo spectra acquired previously under different experimental conditions (J. Biophotonics 10.1002/jbio.201800396).

The Raman probe

Raman spectroscopy is a non-destructive analysis technique that uses inelastic scattering of laser light to provide detailed information about a sample’s chemical structure. A Raman spectrum provides a distinct chemical fingerprint for a particular molecule or material. Raman spectroscopy instruments are used for surgical guidance, exhibiting high accuracy in identifying gliomas or metastases associated with colon, lung and skin cancer.

The Raman microprobe

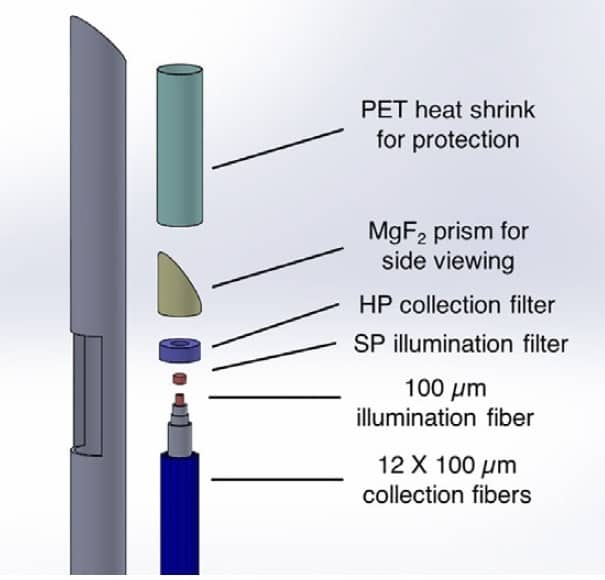
With an outer diameter of 900 μm, the Raman probe fits inside the internal cannula of a commercial biopsy needle. The probe consists of a central illumination fibre with a 100 μm core diameter surrounded by 12 collection fibres. The illumination fibre is coupled to a dual-wavelength spectrally stabilized laser that operates at 671 nm for high-wavenumber Raman spectroscopy (2000-4000 cm-1) and at 785 nm to probe the fingerprint region (500-2000 cm-1).

A navigation attachment positions the tip of the biopsy needle with reference to pre-operative MR images. A Y-shaped sealed plastic breakout enables the surgeon to create negative pressure inside the needle and obtain a tissue sample without removing the fibre-optic probe.

Clinical validation

For the clinical testing, co-principal investigator Frédéric Leblond and co-authors performed 13 Raman acquisitions in the three patients. They acquired 11 spectra in tumours and two spectra in normal brain tissue in the patients with lymphoma.

The researchers acquired spectral data from a single position on the target tissue, first recording a background spectrum with the laser off, followed by 10 measurements in both the fingerprint and high wavenumber regions with the laser turned on. The Raman system detects small wavelength shifts in the returning light, which create the spectral pattern. After processing the raw spectroscopic signal, the Raman spectra exhibited features associated with malignant and benign brain tissue.

The researchers compared the recorded spectra with 147 previously acquired in vivo spectra from 24 glioma patients, and with ex vivo acquisitions from a calf’s brain. They note that key Raman tissue bands were present for all measurements, suggesting that a classification model could be trained with one system and used for live classification with another system. They intend to develop an accurate statistical classification model to be used for real-time prediction of tissue type during a brain biopsy.

Leblond tells Physics World that the researchers have a new clinical study planned later in the spring, and that the probe will be commercialized by ODS Medical, headquartered in Montreal. He says the team is also testing the probe for use with lung and prostate cancers.

Oceanic carbon uptake could falter

Scientists can now put a measure to the role of the waves as a climate shock absorber: they estimate that oceanic carbon uptake by the deep blue seas has consumed 34 billion tonnes of man-made carbon from the atmosphere between the years 1994 and 2007.

This is just about 31% of all the carbon emitted in that time by car exhausts, power station chimneys, aircraft, ships, tractors and scorched forest, as human economies expand and ever more fossil fuel is consumed.

This confident figure is based on a global survey of the chemistry and other physical properties of the ocean by scientists from seven nations on more than 50 research cruises, taking measurements of the ocean from the surface to a depth of six kilometres.

The researchers report in the journal Science that they already had the results of a global carbon survey of the oceans conducted at the close of the last century, and had calculated that from the dawn of the Industrial Revolution – when humans started using coal, and then oil and gas – to 1994, the oceans had already absorbed 118 billion tonnes.

For the latest exercise, they developed a statistical tool that helped them make the distinction between the man-made and the natural atmospheric carbon dioxide always found dissolved in water.

The good news is that the ocean remains for the moment a stable component of the planet’s carbon budget: overall, as more man-made carbon is emitted from exhausts and chimneys, the ocean takes up proportionally more.

The bad news is that this may not go on for ever. At some point, the planet’s seas could become saturated with carbon, leaving ever more in the atmosphere to accelerate global warming to ever more alarming temperatures.

And there is a second unhappy consequence: the more carbon dioxide absorbed by the oceans, the more the sea shifts towards a weak solution of carbonic acid, with potentially calamitous consequences both for marine life and for commercial fisheries.

Research like this is essentially of academic interest: it adds precision to the big picture of a vast ocean that absorbs carbon dioxide, and overturning currents that take it to great depths, and out of atmospheric circulation.

An active moderator

But it is also a reminder that the ocean plays an active role in moderating planetary temperatures, absorbing ever greater quantities of heat and responding with fiercer levels of energy.

It also confirms that although, on average, the high seas are responding to atmospheric change as expected, different ocean basins can vary: the North Atlantic actually absorbed 20% less CO2 than expected between 1994 and 2007, probably thanks to the slowing of the North Atlantic Meridional Overturning Circulation at the time.

And, the researchers say, the acidification of the oceans is on the increase, to depths of 3000 metres. The next step is to understand a little better the interplay between ocean, atmosphere and human emissions of greenhouse gases.

“We learned that the marine sink does not just respond to the increase in atmospheric CO2,” said Nicolas Gruber of the Swiss Federal Institute of Technology, always known as ETH Zurich, who led the study.

“Its substantial sensitivity to climate variations suggests a significant potential for feedbacks with the ongoing change in climate.”

Copyright © 2026 by IOP Publishing Ltd and individual contributors