Wearable patch measures sweat in extreme environments

A research team led by John Rogers at Northwestern University in the US has unveiled a thin and robust sweat sensor that is capable of monitoring hydration during exercise. The circular patch, with a width of just 30 mm, works underwater and in dry, arid environments – which makes it ideal for monitoring fluid loss during swimming, triathlons, ultramarathons and many other endurance sports.

Since people sweat at different rates, it is very difficult to know how much fluid athletes lose through perspiration. This can be a major problem, as drinking too much water can lead to hyponatremia, which in acute cases can cause headaches, seizures or even coma. Meanwhile, drinking too little risks hypohydration, which can produce extreme symptoms that include delirium as well as increased risk of heat stroke and death.

The current gold standards for monitoring sweat are either absorbent foam stickers or the so-called body washdown method – which essentially involves collecting shower run-off. Neither of these methods lend themselves to real-time monitoring during endurance sports.

Endurance challenge

Members of the study team had developed wearable sensors before, such as temporary tattoos to monitor trace metal in sweat or heart beats, brain waves and muscle contractions. But none of these devices were built to cope with the difficulties inherent to collecting sweat in aquatic or arid environments. When swimming, it can be difficult not to let water from the pool or the sea mix with sweat in a sensor. On land, meanwhile, sweat can rapidly evaporate when the weather is hot and dry.

To overcome these challenges, Rogers and colleagues built a thin, stretchable device to monitor sweat. It consists of a microfluidic channel laid out in a circular serpentine pattern, together with electronic modules that include a flexible magnetic-loop antenna, a small wireless temperature sensor, near-field communication components and a light-emitting diode for user notification.

The wearable device, which does not need a battery or wireless technology, can collect real-time data on sweat loss, sweat rate, chloride concentration and skin temperature. This data can then be read by tapping it with a smartphone equipped with near-field communications technology – which enables data transfer without an Internet connection.

“The sweat glands under the device act as a pump that push sweat into a microchannel,” explains team member Jonathan Reeder. “A small amount of colour agent is placed at the beginning of the microchannel, which dyes the sweat a shade of purple that corresponds to chloride concentration. Sweat rate and sweat loss can be determined by visually observing the number of serpentines that are filled.”

The innovation, however, lies in how these components are put together. The design combines a strong, skin-safe adhesive with a very thin, flexible device structure. A watertight bond is formed to the skin at the inlet of the microchannel, and there is a very small outlet for air to escape as sweat fills the channel – transforming the patch into a robust watertight one-way valve.

Extreme field tests

To test the device, the team attached the hi-tech patch to dozens of cyclists, swimmers and triathletes, the latter practicing for the IRONMAN Triathlon World Championship. Results were encouraging, with the patch performing well – even after two hours of vigorous swimming.

Given its proven utility, the researchers are already thinking about bringing their innovation to market. “One of the unique features of these devices is the simplicity and low material cost,” says Reeder. “A startup from the lab, Epicore Biosystems, is working in this area to commercialize similar devices.”

And it could prove useful in other areas too. “We can store collected sweat for hours after sweating,” Reeder says. “We could collect sweat at very low rates during normal everyday activities, which could be useful for vulnerable populations.” This could mean less awkward tests to screen for cystic fibrosis in babies, which is detected by measuring sweat chloride concentration, and better recovery monitoring for stroke patients.

The research is described in Science Advances.

Shadowy algorithm allows digital camera to see round corners

An ordinary digital camera has been used to acquire images of objects hidden round a corner. Vivek Goyal and colleagues at Boston University created their inexpensive non-line-of-sight imaging system using an algorithm to extract information from the shadow cast by an obscuring object. Their technique could lead to a diverse range of imaging applications based on low-cost components.

If the line of sight between a target object and a camera is blocked – by placing the object round a corner, for example — some of the light from the target can reach the camera via diffuse scattering from surrounding objects. This light carries information about the hidden object, but until now this information had to be captured and unscrambled using advanced detectors and algorithms before an image can be obtained.

One successful technique, for example, uses ultrashort laser pulses to illuminate a hidden object. Advanced optical sensors then pick up light that is scattered diffusely by a relay surface — which is essentially an extremely poor mirror. To reconstruct the image, the sensor measures both the arrival times and the incident angles of the light it receives. These data are then fed into an algorithm and an image is created. This requires expensive, highly-specialized equipment, which makes it impractical for many applications.

In the shadows

But now, Goyal’s team has achieved non-line-of-sight imaging with an ordinary digital camera and no need for measuring arrival times. Their algorithm analyses information that is contained in shadows cast by an obscuring object that is placed between the target object and the relay surface (see above figure). Their technique relies on the fact that shadows are not sharp, but rather have penumbrae at their edges. What is more, subtle variations in the colour and intensity of penumbrae light carry information about what lies behind the obscuring object.

Imaging

In their experiment, the target object was a LCD TV screen that displayed a number of different colour images. A digital camera was used to capture penumbrae cast on the diffusely-reflecting relay surface. The team’s algorithm could determine the position of the obscuring object and also identify variations in brightness and colour within the target object. This enabled the system to acquire images of simple target objects including cartoon faces and Boston University’s logo with unprecedented resolution (see above figure).

Goyal’s team now hopes to improve the technique so that it can determine the shapes of the obscuring objects; potentially allowing for 3D reconstructions of hidden scenes. Further research could soon create a diverse range of new imaging applications, including improvements of endoscopes for medical imaging, monitoring hazardous sites such as nuclear plants and burning buildings, and preventing collisions between vehicles.

The imaging system is described in Nature.

Scientists accidentally recreate Japanese art, students play at quantum mechanics, and the Doomsday Clock stands still

Freak waves can appear suddenly and without warning. They are difficult to predict, tower above the surrounding waters, and remain the main suspects when a large ship goes missing. And curiously, before 1995 – when one such wave was recorded to crash into the Draupner oil platform in the North Sea – most evidence of their existence was anecdotal.

But now, researchers from the Universities of Oxford and Edinburgh have finally uncovered the mystery behind these freak waves. They found that when two waves meet at large angles, the height of the resulting wave is not  limited in the same way as it would be in other situations.

To illustrate this, the scientists simulated the formation of a freak wave in the lab. They were surprised when their creation showed an uncanny similarity to Katsushika Hokusai’s masterpiece “The Great Wave off Kanagawa” from the early 1800s.

Their work was published in the Journal of Fluid Mechanics

In an effort to make quantum mechanics reach high-school level classrooms, researchers from the University of Innsbruck, Austria, have created a game as a teaching tool. It conveys some basic concepts from this notoriously difficult field, but without requiring any knowledge of advanced mathematics.

In the game students are split into two teams called “particles” and “scientists”. The goal of the scientists is to perform “measurements” on the particles, who are told to obey specific rules. Then the former must try to come up with theories that explain their observations. The game aims not only to teach new concepts, but also to develop students’ critical thinking.

The game was tested in May 2018 with the three science classes of Colegio JOYFE in Madrid and was well-liked by the students participating.

At the start of 2019 the Doomsday Clock – which was created in 1947 to measure the world’s susceptibility to an apocalypse – remains at 2 minutes to midnight. While the clock hasn’t moved forward over the last year, it is a reminder that things aren’t really improving either. Nuclear modernization, climate change and growing misinformation remain big threats to humankind and our planet.

The clock, which was initially set 7 minutes to midnight, was created by the Bulletin of Atomic Scientists. The last time it was as close to midnight as it is now was in 1953, when the Cold War arms race escalated with the US and Russia’s hydrogen bomb tests.

Do-it-yourself DNA design

A team at Massachusetts Institute of Technology and Arizona State University has developed a program that can convert free drawn shapes to 2D DNA nanostructures, also known as DNA origami. This algorithm can autonomously determine the required sequences, simplifying the process of designing these highly detailed assemblies.

DNA origami is a technique that creates nano-sized 2D and 3D structures made of DNA. These shapes can be particularly useful in nanotechnology for producing complex structures. The approach uses the ability of DNA bases to pair with each other to form a large “scaffold” sequence of DNA and hold these together with smaller “staple” sequences.

Until recently, designing DNA origami required researchers to manually work out the sequences required, as there were limited options for automating this long process. However, Mark Bathe and his team have produced an algorithm that is capable of calculating the strands needed to assemble a desired shape. This removes the need for expert knowledge when designing DNA origami (Science Advances 10.1126/sciadv.aav0655).

Exploring DNA designs

To test the abilities of the program, the researchers designed several structures for it to recreate. They used the sequences that the program generated to create the origami and examined the resulting shapes using atomic force microscopy (AFM). The algorithm was capable of producing many different shapes with varying edge lengths, angles and internal meshes. They were even able to produce highly complex and interesting DNA origami, including a lotus flower shape.

The program works by determining the minimum number of staple sequences needed to adhere to the scaffold and form the desired shape. It searches every possible place where the staples can cross over the strands and creates pathways between these possible crosses, allowing researchers to compute the optimal structure. The sequences can then be simply assembled by placing all the strands in solution and using heat to form the structures.

One of the advantages of this software is that edges within the structures do not have to be a specific length, which unlocks a wide variety of possible shapes. Previously, these lengths needed to be a whole number of double helical turns to ensure the origami was flat. This design flexibility is achieved by taking advantage of a new technique that uses DNA bases that do not have a pair on the scaffold strand to bridge the gap.

Opening the field

The program, called PERDIX, is available to researchers as an online tool and standalone software. The team hopes that this technique will allow a greater variety of researchers to develop DNA origami.

“The fact that we can design and fabricate these in a very simple way helps to solve a major bottleneck in our field,” says Bathe. “Now the field can transition toward much broader groups of people in industry and academia being able to functionalize DNA structures and deploy them for diverse applications.”

On the road to room-temperature superconductivity

A team of researchers from George Washington University in the US is saying that a hydride of lanthanum compressed to 200 GPa (2 Mbars) could be superconducting at temperatures near room temperature – a result that has been backed up with findings from another group in Germany. The results could be a major step towards realizing the long-sought goal of room-temperature superconductivity for energy applications.

Superconductivity is the ability of a material to conduct electricity without any resistance. It is observed in many materials when they are cooled to below their superconducting transition temperature (Tc). In the Bardeen-Cooper-Schrieffer (BCS) theory of (“conventional”) superconductivity, this occurs when electrons overcome their mutual electrical repulsion and form “Cooper pairs” that then travel unheeded through the material as a supercurrent.

Superconductivity was first observed in 1911 in solid mercury below a Tof 4.2K and the search for room-temperature superconductors has been on ever since. Room-temperature superconductivity would help considerably improve the efficiency of electrical generators and transmission lines, as well simplify current applications of superconductivity, such as superconducting magnets in particle accelerators.

Researchers came a step closer to this holy grail with the high-temperature superconducting copper oxides, which were discovered in the 1990s and which have a Tabove liquid helium temperatures. It was only in 2015, however, that they discovered that hydrogen sulphide has a Tof 203 K when compressed to pressures of 150 GPa. This result spurred a flurry of interest in the compressed hydrides – that is, solid materials containing hydrogen atoms bonded to other elements.

Dramatic resistance drop at 260 K

“We believe that a Tat – or very near – room temperature has finally been realized,” says Russell Hemley, who led this latest research effort.

Thanks to quantum-mechanics-based calculations, Hemley’s group first predicted that lanthanum hydride (LaH10) could be superconducting in July 2017. The researchers then synthesized the material, and reported direct measurements of its conductivity that indicated a Tof 260 K at 180-200 GPa in May 2018, posting a paper on the arXiv in August 2018 that has now been published in Physical Review Letters. A team led by Mikhail Eremets at the Max Planck Institute for Chemistry in Germany reported on a Tof 250 K for lanthanum hydride synthesized at pressures of around 170 GPa in independent work posted on the arXiv in December 2018.

Hemley and colleagues use a special modulated heating method to synthesize their superhydride material at 180-200 GPa and temperatures of between 1000 to 2000 K while the material is in a diamond anvil cell. In their electrical conductivity studies, they do this with carefully mounted micro-electrodes on the tips of the diamond anvil to measure the superconducting properties of the material as it is cooled. They observe a dramatic resistance drop at 260 K. Additional experiments indicate that the Tcould reach 280 K depending on the synthesis conditions.

The Washington team has also studied the effect of applied current on the Tof their sample. “This measurement gives us a critical current estimate that is remarkably high,” explains Hemley. “We have performed low-temperature X-ray diffraction on LaH10 too to determine if the transition as a function of temperature is associated with a major structural change – which we find it is not.”

Quantum-mechanics-based calculations for “materials by design”

The researchers say they have reproduced their result many times and also have preliminary magnetic susceptibility data that point to room-temperature superconductivity. To unequivocally prove, however, that this is indeed the case will require them to observe the Meissner effect (the expulsion of magnetic field from a material when it becomes superconducting) in LaH10. This is challenging, they admit, but preliminary results from experiments on their samples at the Argonne National Laboratory in Illinoisare encouraging. Further work is also needed to characterize the superconducting properties of structures other than LaH10 in their samples that they have predicted and observed using X-ray diffraction.

The fact that researchers were able to predict high-Tsuperconductivity in this material using quantum-mechanics-based calculations before actually synthesizing it meant that they were able to guide the experiments in the right direction and identify other potentially interesting compounds. This “materials by design” approach will be important for motivating experimentalists to investigate similar systems, such as yttrium hydride, whose predicted Texceeds room temperature, says Hemley. “Other promising new superconductors include carbides and low atomic number compounds with similar structures that in fact may be stable at ambient pressures.”

The researchers are now indeed busy exploring a broader range of compositions based on their own and other groups’ calculations. “We believe that LaH10is just one of many superhydrides with likely high Tcs,” Hemley tells Physics World.

Steven Weinberg releases third collection of essays

I once interviewed the Nobel-prize-winning theoretical physicist Steven Weinberg, and found him to be a friendly and engaging person who thought deeply about fundamental physics. I’m not sure he enjoys working with other people though. After I wrote up the interview for Physics World, I e-mailed it to Weinberg to check, but he took issue with various parts of the text and refused to spend time straightening it out or answering follow-up questions – we never did end up publishing that piece. I suppose I should have foreseen his reaction; after all, Weinberg had told me he “almost never” collaborates or co-authors research papers because “I don’t like how other people write”.

Thankfully, Weinberg is a prolific author himself, so to know more about what he thinks, take a look at Third Thoughts, his third collection of essays and talks (click here for reviews of the second and first), most of which originally appeared in the New York Review of Books. It covers not only his specialisms of particle physics and cosmology, but also the history of science, politics and funding (he doesn’t like manned spaceflight), and what he dubs “personal matters”. The latter, however, won’t give you much of an insight into what makes Weinberg tick; the closest he gets to a personal revelation is to admit that it’s “profoundly instructive to learn that one has been wrong about something” (though I guess that happens rarely for him).

Where the book excels is the science and Third Thoughts has some marvellously pithy accounts of topics including the Standard Model, symmetries in physics, and dark matter and dark energy. Weinberg is an expert guide and these wise, informative and delightfully written essays are all brief and to the point. “What is an elementary particle?” is particularly strong. I also loved his remarks after receiving an honorary doctorate from Rockefeller University in the US, where Weinberg took issue with those who doubt the consensus on climate change. “It is ,” warned Weinberg, “generally foolish to bet against the judgements of science, and in this case, where the planet is at stake, it is insane.”

  • 2018 Harvard University Press 226pp £20.00/$25.95pb

Tell us more on palm oil sources, say buyers

Companies selling products that contain palm oil need to be upfront about where it comes from, so as to relieve consumers of the burden of making sustainable choices, a UK study says.

Researchers from the University of Cambridge say companies should not rely simply on purchasers’ own awareness of the need to make environmentally responsible decisions, but should publicly disclose the identities of their palm-oil suppliers.

Palm-oil production causes deforestation, biodiversity loss and greenhouse-gas emissions from peatland conversion, and the oil is found in many products, often without consumers’ knowledge. It is a common ingredient in foods, body products, detergents and biofuels.

Rosemary Ostfeld is the study’s lead author. She says “The Roundtable on Sustainable Palm Oil (RSPO) has made efforts to improve the sustainability of palm-oil production by creating an environmental certification system for palm oil.”

Low uptake

“But currently only 19% of palm oil is RSPO-certified,” Ostfeld says. “This means the majority that finds its way into products people buy daily is still produced using conventional practices.

“We wanted to find out if consumers were actively seeking to make a sustainable choice about palm oil. We also explored what extra efforts governments could make to ensure sustainable palm oil consumption.”

The researchers, whose study is published in the journal Environmental Research Letters, surveyed 1695 British consumers through the market-research company YouGov.

Respondents were asked about their awareness of palm oil and its environmental impact; their recognition of “ecolabels” such as Fairtrade, the Soil Association and RSPO; and which ecolabelled products they included in their weekly household shopping.

The study found that UK consumer awareness of palm oil was high (77%), with 41% of those aware of it viewing it as “environmentally unfriendly”. Yet almost no consumers were aware of the RSPO label that shows a product contains sustainably produced palm oil.

“In terms of label recognition versus action, 82% of people recognized the Fairtrade label, but only 29% actively buy Fairtrade products,” says Ostfeld. “Only five per cent recognized the RSPO label – the same as a fictional label we put into the survey as a control. Of that small number, only one per cent said they actively include products with the label in their shopping.”

The low recognition of the RSPO label could be caused by the scarcity of its use by consumer goods companies and retailers.

Action not guaranteed

Ostfeld says “This may be due in part to reluctance to draw attention to their use of palm oil, or it may be because they fall short of the 95% physical certified palm oil content that used to be needed to use the label.

“Either way, we found that relying on consumers to consciously and regularly include certified products in their shopping has limitations. Our results show that even when consumer awareness of an ecolabel is high, action is not guaranteed.”

To address this problem, the researchers put forward several policy recommendations. Ostfeld explains “Palm oil is more efficient to produce than other vegetable oils and plays a vital role in the livelihoods of millions of people, so banning it is not plausible. Instead, the goal should be to encourage sustainable palm oil production.

“We recommend governments require consumer goods companies and retailers to buy identity-preserved certified palm oil, which can be traced back to the individual plantation. If national targets must be met with identity-preserved certified palm oil, demand for it will increase. It will also enable unsustainable practices to be uncovered more easily.”

Disclosure needed

“Companies should also publicly disclose their palm oil suppliers,” says Ostfeld. “This will help consumers know if they’re sourcing their palm oil from growers who use best practices. We believe these measures could promote a more rapid move towards sustainable palm oil consumption, and higher levels of accountability throughout the supply chain.”

Some campaigners argue that sustainability standards, including certification schemes, can have a wider effect by, for example, helping to shape governments’ policies and to steer investment into research.

A year ago one major US financial company, Dimensional, said it had divested two of its portfolios of all palm-oil plantation companies.

Pondering the meaning of time and creating black hole analogues

The latest episode of Physics World Weekly includes an interview with the Irish artist and filmmaker Grace Weir. She is the artist behind Time Tries All Things, a two-screen video installation exploring different conceptions of time; scientific, philosophical and cinematic. Weir is in conversation with Physics World editor Matin Durrani about her inspiration for the work and why she believes that artists and scientists grapple with some of the same big questions about the nature of time.

Later in the podcast, a selection of journalists discuss some of the research highlights published this week on this website. Of particular note, Susan Curtis discusses a breakthrough in an intriguing field of research ­– the idea of creating analogues of black hole systems here on Earth. She’s describes the back story to the “milestone” experiment on the journey towards seeing the spontaneous emission of Hawking radiation from a lab-based analogue.

If you enjoy what you hear, you can subscribe to Physics World Weekly via the Apple podcast app or your chosen podcast host.


Citizen scientists spot meteorite strike during lunar eclipse

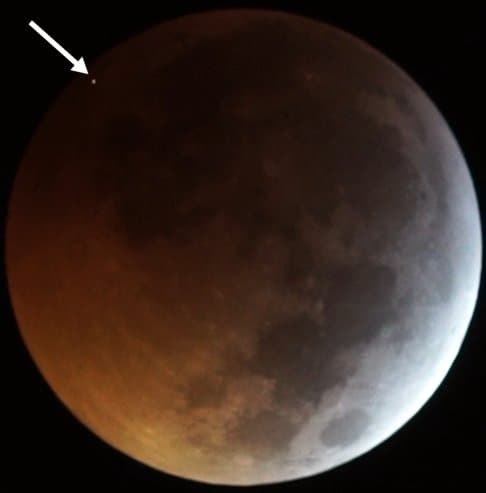
Photograph of meteorite striking the moon

The total lunar eclipse that took place last Sunday night/Monday morning has become a dramatic demonstration of the power of citizen science. As millions of people across Europe, western Africa, and North and South America watched the start of totality, a meteorite hit the moon, producing a tiny flash of light on the darkened lunar surface.

It is the first known meteorite strike to have taken place during a lunar eclipse.

The story begins in the United States with the extremely sharp-eyed Reddit user Ahecht. “I saw a bright flash on the moon opposite the remaining sunlit sliver,” he wrote. “I ran inside and checked the timeanddate webcast from Morocco and it was visible there too, so it wasn’t an airplane or something else local. It was also visible on the Griffith Observatory webcast. Could this have been a meteor impact on the moon?”

The news quickly spread. “Wow,” tweeted the UK-based astronomer and science writer Will Gater. “I’ve just checked in Photoshop & the flashes from the 2 different feeds are in *exactly* the same location. Given there was *also* a visual observation I’d bet good money this was indeed a meteoroid impact on the Moon.”

Live coverage of the eclipse published by timeandate.com (see below) shows the impact as a tiny flash of light at 04:41:43 UTC, about one hour and twenty minutes into the video. It appears on the left edge of the moon, just below the 10 o’clock position.

These live pictures were provided by Steffen Thorsen, the chief executive of timeanddate.com, who was filming the eclipse from Ouarzazate in Morocco. (Alas, the commentator who is speaking at the moment of impact — and who completely misses the historic occasion — was me. In my defence, it is very difficult to spot; you might have to replay the video a couple of times to see it.)

Lunar impact

Confirmation of the strike came the day after the eclipse. The Moon Impacts Detection and Analysis System (MIDAS) is a robotic system that has been specifically designed to record the flashes produced by meteorites hitting the moon. The system, which has been running since 1997, uses telescopes at three astronomical observatories in Spain: Sevilla, La Hita and La Sagra. The day after the eclipse, José María Madiedo of the University of Huelva reported that MIDAS had observed the lunar flash, as shown in the image.

The citizen science part of the story is continuing, with astrophotographers and other observers checking to see if they were lucky enough to record the impact. Petr Horálek was in the Cape Verde Islands for the eclipse. When he was inspecting his images for hot pixels and other imperfections, he found one “very weird” dot that could have been a star.

“But it was in front of the moon,” he says. Later, when he read about the meteorite, he realized he had taken his picture right at the moment of impact. “What a lucky shot!” he admits.

Meteorite strikes such as this one can help us to learn more about the interplanetary matter in our solar system. “This is a great opportunity for shared science,” says Noah Petro, a planetary geologist with NASA’s Lunar Reconnaissance Orbiter (LRO) mission. “I’m asking to archive your data, let’s try to co-ordinate.”

If any Physics World readers have images or observational reports to share, Petro would like to hear from you. You can find his contact details here.

MRI measures breast cancer hypoxia

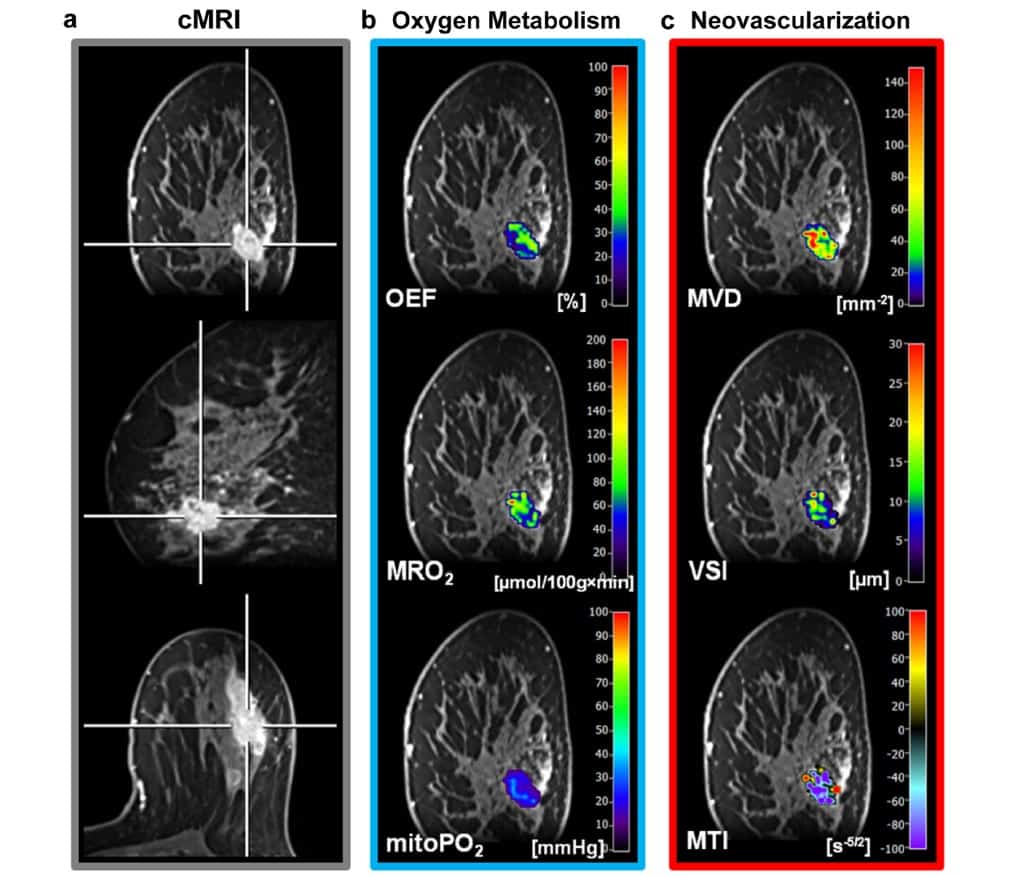
MRI biomarker maps

Researchers from Austria have developed a non-invasive method for assessing hypoxia and neovascularization in breast tumours using MRI data. Their novel MRI approach, which offers the potential to improve tumour characterization and facilitate tailored treatment, is designed for easy integration into a diagnostic MRI protocol.

Tumour hypoxia is a condition in which tumour cells have low oxygen concentrations compared with healthy tissues, resulting from an imbalance between oxygen supply and consumption. Its presence in a breast tumour increases the cancer’s resistance to radiotherapy and can decrease the effectiveness of some chemotherapy treatments. Tumour hypoxia is a strong prognostic factor for disease progression, development of metastases, and the overall survival of a patient.

Methods to accurately assess tumour hypoxia, neovascularization and breast cancer heterogeneity, however, have been limited. Additionally, the levels of oxygenation within a tumour are highly variable from one region to another and can change over time. Existing imaging approaches include PET, which has high costs, or near-infrared spectroscopy, which is of limited value due to its low spatial resolution.

Two recently developed MRI techniques offer a quantitative measurement of hypoxia and have been pioneered in patients with brain cancers. Advanced quantitative blood oxygenation level dependent (qBOLD) imaging can quantify the tissue oxygen tension and provide a direct measurement of tumour hypoxia. Meanwhile, vascular architectural mapping (VAM) can measure and quantify microvascular vessel diameter and architecture.

Radiologist Katja Pinker and colleagues at the Medical University of Vienna hypothesized that this MRI-based assessment of hypoxia and neovascularization should be feasible in breast tumours. To validate their technique, the researchers performed multiparametric breast MRI, including qBOLD imaging and VAM, on 20 patients with benign and malignant breast tumours. They used the acquired data to create MRI biomarker maps of oxygen metabolism and neovascularization (Mol. Imaging Biol. 10.1007/s11307-018-1298-4).

All patients had a suspicious lesion with a diameter of at least 10 mm identified on mammography or breast ultrasound. Thirteen patients were diagnosed with invasive ductal carcinoma and seven had benign tumours.

For the MRI sequence protocol, the team first acquired diagnostic MRI sequences, followed by T2- and T2*-mapping sequences for qBOLD imaging, coronal diffusion-weighted imaging (DWI) for VAM, and the native T1w FLASH sequence for dynamic contrast enhancement (DCE) perfusion. The authors note that only a single dose of gadolinium-based contrast media, injected during the dynamic susceptibility contrast (DSC) gradient echo spin echo (GESE) perfusion sequence, was needed.

The researchers used custom-made MatLab software to post-process qBOLD and VAM data and calculate quantitative MRI biomarker maps of oxygen extraction fraction, metabolic rate of oxygen and mitochondrial oxygen tension. They used these maps to measure tissue hypoxia and neovascularization, including microvessel radius, density and type of vascular architecture.

The resulting MRI biomarker maps demonstrated intra-tumoural spatial heterogeneity with a broad range of biomarker values. The researchers determined that malignant lesions showed significantly higher microvessel density and metabolic rate of oxygen, lower mitochondrial oxygen tension and lower (more pathologic) microvessel type indicator.

“This indicates that breast cancer consumes more oxygen and is more hypoxic and neovascularized than benign tumours,” they authors write. “These findings confirm the importance of tumour hypoxia and neovascularization as powerful physiological stimuli that can be exploited as a tumour-specific condition and can be used to design hypoxia-based imaging biomarkers and hypoxia-activated anti-cancer drugs.”

Copyright © 2026 by IOP Publishing Ltd and individual contributors