Skyrmion phases: two for the price of two

Skyrmions are small magnetic vortices that occur in an astonishingly wide range of materials and they were first discovered about a decade ago. They can be imagined as 2D knots in which the magnetic moments rotate about 360° within a plane. They could form the basis of future magnetic data storage technologies that have a higher density than today’s disk drives. This is because they can be made much smaller than the magnetic domains used in these devices and they can be controlled efficiently with spin currents.

“Skyrmions usually exist in a single thermodynamic parameter range (that is, a certain temperature and magnetic or electric field range). Indeed, this is the case for all the materials in which they have been found so far,” explains physicist Christian Pfleiderer of Munich Technical University, who led this research study. “In a way, this represents an important constraint for when it comes to manufacturing and tailoring skyrmions since the only way to stabilize them is to find the exact physical parameters (pressure, strain, or field for example) at which they occur.

Two disconnected parameter regimes

“We have now discovered two disconnected parameter regimes in one and the same material (namely Cu2OSeO3) with different skyrmion phases. These two phases are stabilized by different mechanisms but are nevertheless active at the same time.”

The first skyrmion phase in this material, which was discovered in 2012, exists at high temperatures near the helimagnetic to paramagnetic transition when a small magnetic field is applied. This phase is isotropic (it does not matter in which direction the field is applied with respect to the crystal structure).

“The second phase, which we discovered in our work, exists at low temperatures at the border between the so-called conical phase (a type of ‘spin-flop’ phase) and the field polarized (ferromagnetic) state,” explains Pfleiderer. “This phase only shows up when we apply a magnetic field along the cubic <100> axis in the material.”

“Something very unexpected and odd”

This phase was discovered by the lead author of the study, Alfonso Chacon, while he was investigating the metastable properties of the high-temperature skyrmion phase. “This metastable behaviour is interesting because it allows us to determine the energetics and mechanisms of how stable skyrmions are and how they are created and destroyed (known as topological protection and unwinding, respectively),” he explains. “Using a technique called small-angle neutron scattering (SANS), I systematically tracked the magnetic order in Cu2OSeOover a wide range of temperatures (0 to 50 K) and magnetic fields ((0 to 120 mT) parallel to the <100> crystal axis. I discovered that something very unexpected and odd was going on.”

This second phase is in fact stabilized by magnetic anisotropy in this cubic material, Pfleiderer tells Physics World. “We used to think that anisotropy did not play an important role here (because it is very weak), but it turns out that it does. We have managed to explain this new phase with all its associated details in remarkable agreement with experiment, thanks to our colleagues in Cologne and Dresden who proposed the detailed interpretation and also performed rather tricky Monte Carlo simulations.”

 Generating skyrmions might be even easier than we think

“The discovery means that it might be much easier to generate skyrmions than we thought,” he adds. “Even very weak magnetic anisotropies might do the trick, if they are carefully selected. Our study also made us realize that several mechanisms may be strong enough in one and the same material, which means that they could appear under many more different conditions. We expect that this will be extremely useful for tailoring skyrmions to specific applications.”

The finding is also important from a fundamental point of view. “For example, we are now asking ourselves the question: how does the topological protection differ between the different phases in Cu2OSeOand is it possible to switch between the two?”

The researchers, reporting their work in Nature Physics 10.1038/s41567-018-0184-y, say they are now busy with measurements of bulk properties, magnetic force microscopy, magnetic resonance and resonant elastic X-ray scattering on the material to better understand its thermodynamics and morphology (domain patterns and defects in the magnetic texture). “We have also started to look for further examples of such two (and more) skyrmion phases in other materials, having now understood what to look out for,” adds Pfleiderer.

Bimetallic nanoparticles enhance proton dose

Particle therapy enables highly conformal radiation delivery while reducing dose to normal tissue. However, the presence of nearby organs-at-risk can limit the maximum achievable tumour dose. One approach that could overcome this limitation is nanoparticle-aided radiotherapy. Researchers from Korea have now investigated the use of  Fe3O4/TaOx nanoparticles as dose-enhancing radiosensitizers for proton therapy (Phys. Med. Biol. 63 114001).

Nanoparticles are selectively taken up by tumours, due to the leaky tumour vasculature. Upon irradiation, the nanoparticles emit low-energy electrons that are deposited nearby, thereby enhancing the deposited local dose. The researchers chose the bimetallic nanoparticle Fe3O4/TaOx (core/shell) as it is already used as a contrast agent for CT and MR imaging, thus opening up the potential for theranostic applications.

“Verifying the tumour position with CT or MR images every day during treatment can enhance the accuracy of radiation therapy,” explains Youngyih Han from Samsung Medical Center and Sungkyunkwan University. “In addition, we wanted to investigate whether these bimetallic nanoparticles can enhance the therapeutic ratio as a radiosensitizer.”

In vivo imaging

First, Han and colleagues verified the detectability of Fe3O4/TaOx nanoparticles in vivo by imaging six mice bearing mammary carcinomas. They acquired MRI and microCT images of the animal’s organs before, and 5 min, 30 min, 60 min and 24 hr after injection of the nanoparticles in solution.

Nanoparticle imaging

They observed that the uptake ratio of the tumour region increased with time, with a maximum tumour-to-tissue concentration ratio of 0.16 after 24 hours. In the MR image, the tumour was distinguishable 5 min after nanoparticle injection, and the signal intensity of the tumour region gradually increased with time. In the microCT image, however, the aorta and blood vessels were seen 5 min after injection, but the tumour periphery was not visible until after 24 h. The authors note that improvement in the uptake efficiency is desirable.

Simulation studies

In the second part of this work, the researchers used Monte Carlo simulations to compute the dose enhancement from Fe3O4/TaOx and other nanomaterials. They simulated 70 and 150 MeV proton irradiation of gold, gadolinium, Fe3O4/TaOx, Fe3O4, iodine and BaSO4 nanoparticles located at the centre of a 4x4x4 µm water phantom. They then calculated the dose enhancement ratio (DER) – the ratio of the radiation dose with nanoparticles to the dose without – for each case.

Calculating DER as a function of distance from the nanoparticle surface demonstrated that all nanomaterials had a dose enhancement effect, and that it was greatest near to the particle surface. Irradiation with 70 MeV protons resulted in DERs (at 1 nm) of 15.76, 7.68, 7.82, 6.17, 4.85 and 5.51, for gold, gadolinium, Fe3O4/TaOx, Fe3O4, iodine and BaSO4, respectively. The dose enhancement with 150 MeV proton irradiation was similar.

Dose enhancement ratio

The researchers expect that the approach will also work for higher proton beam energies, as used in patient treatments. “As shown in the Monte Carlo simulation, the dose enhancement ratios for 70 and 150 MeV were not that different, but we think the dose enhancement could be slightly lower due to the lower yield of secondary electron at higher energies,” says Han.

Han notes that additional in vitro experiments have shown that cells mixed with Fe3O4/TaOx nanoparticles and irradiated with 230 MeV energy proton beams showed a decrease in cell survival compared with a control group without nanoparticles.

For both proton energies, gold generated the largest yield of secondary electrons, followed by gadolinium and Fe3O4/TaOx. The dose enhancement with the Fe3O4/TaOx nanoparticles was approximately half that seen for gold, and similar to that of gadolinium. However, the researchers point out that Fe3O4/TaOx nanoparticles are cheaper to produce than gold nanoparticles, and more biocompatible than gadolinium.

A unique feature of Fe3O4/TaOx nanoparticles is that the Fe3O4 in the core is superparamagnetic.  This could enable tumour targeting, by combining this superparamagnetic property with a well-designed magnetic field. “We are investigating active targeting methods for Fe3O4/TaOx nanoparticles to overcome the 50% lower dose enhancement compared with gold,” Han explains.

The authors concluded that Fe3O4/TaOx nanoparticles can be effective cancer cell sensitizers when used with proton therapy. “We are now preparing in vitro and in vivo experiments using proton beams, to link the Monte Carlo simulation results to biological effects,” Han told Physics World.

Big data, small lab

Claire Lifan Chen

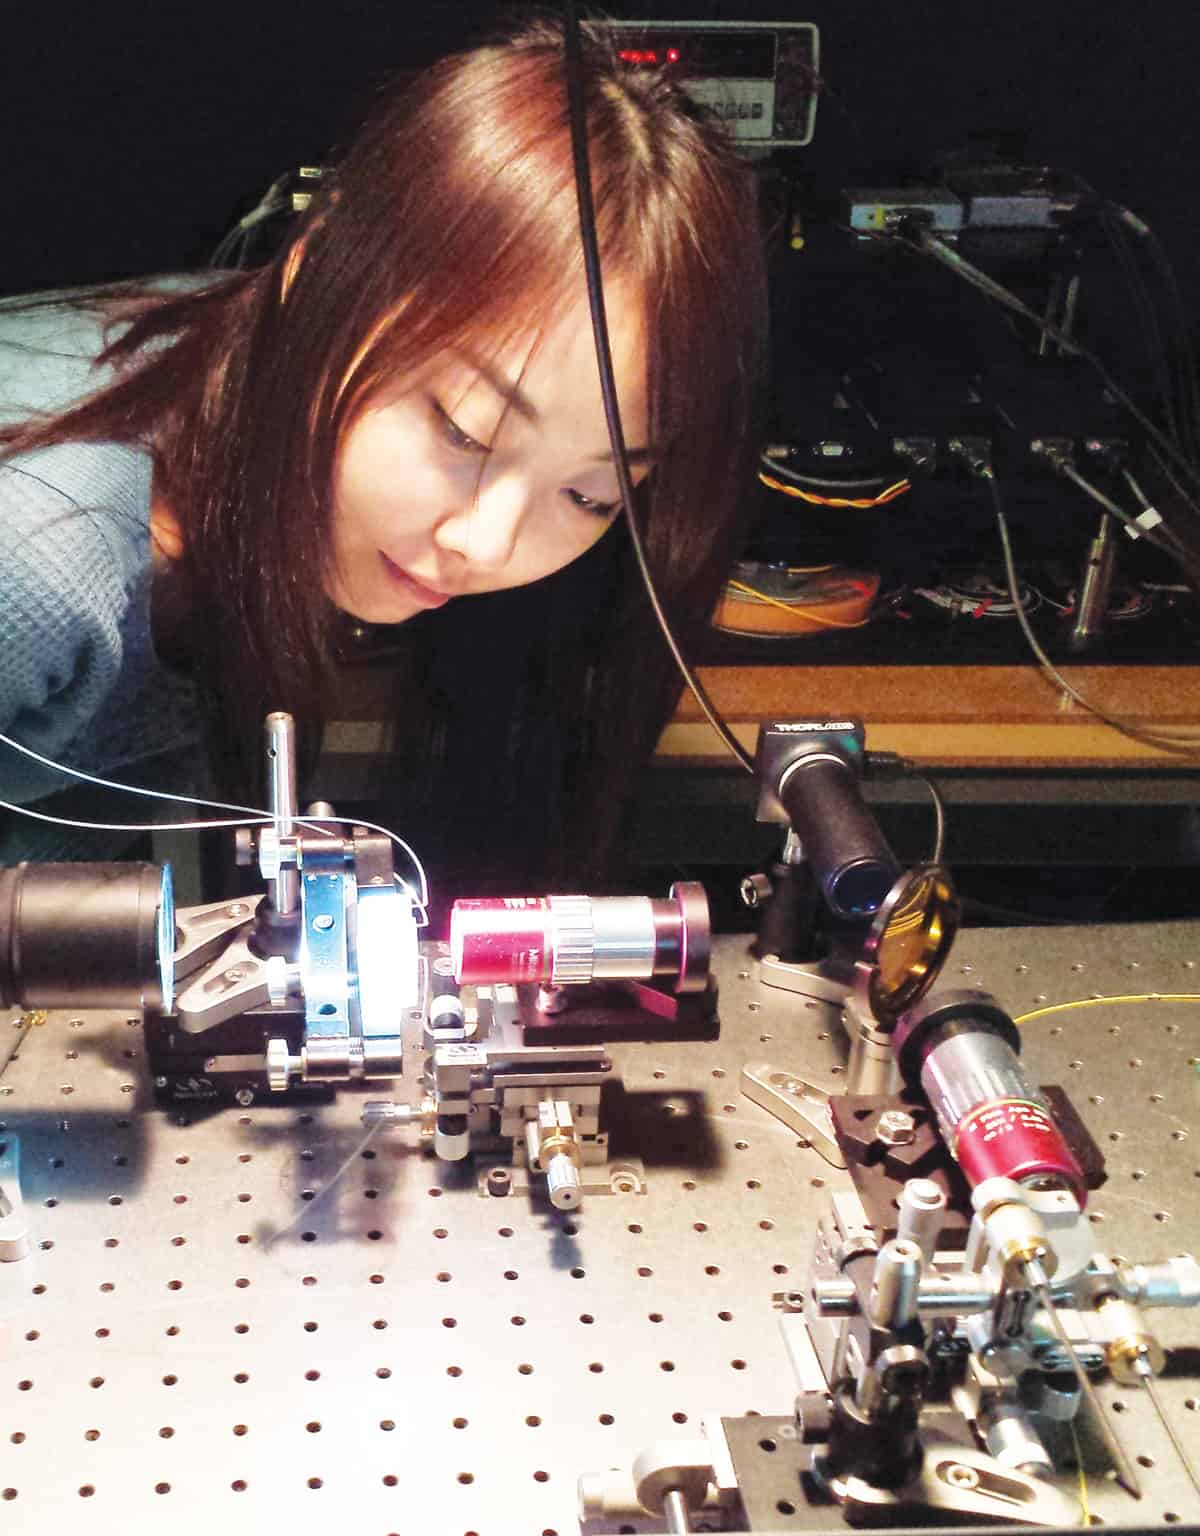
The Large Hadron Collider at CERN is one of the world’s largest scientific instruments. It captures 5 trillion bits of data every second, and the Geneva-based lab employs a dedicated group of experts to manage the flow. In contrast, the instrument shown here – known as a time-stretch quantitative phase imaging microscope – fits on a bench top, and is managed by a team of one. However, it is also capable of capturing an immense amount of data: 0.8 trillion bits per second.

These two examples illustrate just how ubiquitous “big data” has become in physics. Challenges once limited to huge machines managed by international teams are now beginning to crop up in small devices used by single researchers. Consequently, more physicists need to get comfortable with donning the hat of “data scientist”.

Acquiring the necessary skills is often framed as a daunting task, one that inspires some physicists to enrol in intensive boot camps over a series of weeks to learn an alphabet soup of disjointed, unfamiliar tools. However, physicists already have much of the conceptual understanding required to handle big data. All they need is for the computational tools they are already using to continue to work when their problem grows beyond the (somewhat arbitrary) point considered “big”. Physicists should not have to worry so much about the computing fabric that makes this possible.

Generating data

These two principles are the motivation behind the big data and machine-learning capabilities in MATLAB – the software that my company, MathWorks, produces. At the American Physical Society’s 2018 March meeting, I joined a series of speakers at a session entitled “Put Big Data in Your Physics Toolbox” to explain how these principles work in practice, using the time-stretch quantitative phase imaging (TS-QPI) microscope as a case study.

Bahram Jalali, a photonics expert at the University of California, Los Angeles (UCLA), his then PhD student Claire Lifan Chen and postdoc Ata Mahjoubfar built their TS-QPI microscope with the aim of imaging every cell in a 10 mL blood sample and determining which of these cells are cancerous. The cells in the sample are sent through a flow cytometer one at a time, at a rate of almost 100,000 blood cells per second; if the cells could be stacked end to end, that would equate to imaging about 1 m of cells per second. To capture clear images at such a torrential rate, their imaging system runs at 36 million frames – equivalent to 20 HD films – per second. Hence, a single small blood sample generates between 10 and 50 terabytes of data.

The physical infrastructure that enables their TS-QPI system to run at such a fast clip is interesting in its own right. The system creates a train of laser pulses with durations measured in femtoseconds. Lenses, diffraction gratings, mirrors and a beam splitter disperse these laser pulses into a train of multifrequency “rainbow” flashes that illuminate the cells passing through the cytometer. The spatial information for each cell is encoded in the spectrum of a pulse, and the optical signal is then intentionally dispersed as it is sent through a waveguide, imposing varying delays to spectral components at different wavelengths and stretching the signal enough to enable it to be digitized using a standard electronic analog-to-digital converter.

Manipulating and exploring data

All told, Jalali, Mahjoubfar and Chen extracted more than 200 numerical measurements from each cell in their sample. These data were grouped into three categories: morphological features that characterize the cell’s size and shape; optical-phase features that correlate with the cell’s density; and optical-loss features that correlate with the size of organelles within the cell. The result was a staggeringly large dataset. Fortunately, MATLAB intelligently and transparently breaks down these data into small chunks, allowing operations that can incorporate the entire dataset. This means that common expressions, such as A+B, will still work even with big datasets.

Another helpful trick is to define such data as MATLAB “tall” arrays, rather than in-memory arrays. Unlike in-memory arrays, tall arrays typically remain unevaluated until you request that the calculations be performed using the “gather” function. This so-called deferred evaluation allows you to work quickly with large datasets. When you eventually request output using gather, MATLAB combines the queued calculations where possible and takes the minimum number of passes through the data. Better still, all the subsequent code written for small in-memory data will automatically work on the big-data versions: no code changes and no special techniques are required.

The UCLA researchers sought to develop a supervised machine-learning model that could classify cells as either healthy or cancerous

To generate these tall arrays of numerical measures of cells, Jalali and his colleagues used the MATLAB API for Python to integrate a specialized open-source cell image analysis package with more general workflows supported by MATLAB’s Image Processing Toolbox. Since every image was processed the same way to extract their features, they could use a parallel for-loop, “parfor”, to run their image-processing iterations concurrently on their 16-core processor with MATLAB’s Parallel Computing Toolbox. This reduced the time needed to complete their analysis from eight days to approximately half a day.

Incorporating machine learning

Machine learning comes in two flavours. One is unsupervised learning, where an algorithm finds hidden patterns or intrinsic structures in input data. The other is supervised learning, where an algorithm is “trained” on known input and output data and then uses the resulting model to generate reasonable predictions for outputs based on new data. In their work, the UCLA researchers sought to develop a supervised machine-learning model that could classify cells as either healthy or cancerous. A principal benefit of MATLAB is the ability to test a wide variety of machine-learning models in a short amount of time, so the pair used the software’s Statistics and Machine Learning Toolbox to compare three classification algorithms – naive Bayes, support vector machine (SVM) and logistic regression (LR) – before selecting the most useful.

Jalali’s group also explored deep- learning methods to create their predictive model. Deep learning is a specialized form of machine learning. With a deep-learning workflow, relevant features are automatically extracted from images. In addition, deep learning performs “end-to-end learning” – in which a network is given raw data and a task to perform, such as classification, and it learns how to do this automatically.

Although Jalali’s lab trained their network from scratch, most deep-­learning applications use “transfer learning” instead. In this method, the idea is to start with an existing pre-trained network, such as AlexNet or GoogLeNet, then fine-tune it by feeding new data that contain classes pertaining to your problem. After making some tweaks to the network, you can then ask it to perform a new task, such as categorizing cancerous or normal cells instead of, say, dogs and cats (a real example from AlexNet’s set of classes). This requires much less data – you might end up processing thousands of images, rather than millions – and thus less time.

Jalali, Mahjoubfar and Chen got all their machine-learning models to perform with greater than 85% accuracy. They then pushed their deep-learning model’s accuracy above 95% by combining their third-party deep-­learning package seamlessly with MATLAB to perform a global optimization of the receiver operating characteristics: the true positive rate versus the false positive rate at various discrimination threshold settings.

The UCLA team’s work – inventing a novel cancer-detecting microscope, and then using specialized tools within MATLAB to process their data – represents a good example of how data-science techniques and workflows can be integrated into small laboratories. The tools that were once distributed among teams of experts, or were found in the toolbelts of just a handful of researchers, are now increasingly available even to scientists who skipped the boot camp and jumped straight into making their big data work for them.

Can we predict heatwaves better?

Understanding more about the drivers of heatwaves could help weather forecasters make better predictions and give people more time to prepare. Now, thanks to large ensembles of climate models, researchers are probing the co-occurrence of atmospheric blocking and summer temperature extremes – a relationship that has been difficult to study due to limited observations.

During atmospheric blocking, a persistent and stationary high-pressure system diverts the usual westerly flow at mid-latitudes for a few days to several weeks. It’s a scenario that can lead to extreme events such as heatwaves.

The researchers used simulations for 1979–2015 to determine that there is a significant correlation between the magnitudes of summer heatwaves and the number of days influenced by atmospheric blocking in Northern Europe and Western Russia.

After demonstrating agreement with historical records, the group – which includes scientists from the Canadian Centre for Climate Modelling and Analysis, ETH Zurich and the European Commission’s DG Joint Research Centre – examined how the relationship might hold for the rest of this century.

Although heatwaves are projected to become more intense and last longer with continued global warming, the relationship between heatwaves and blocking appears to remain the same, the researchers found.

Considering multiple, large ensembles of climate models is an advantage from a statistical perspective. “They seem to represent the relationship between blocking and heatwaves correctly, and in a similar manner to that of the real world,” says Nathalie Schaller of the Centre for International Climate Research in Norway.

Schaller and colleagues suggest that under present-day climate conditions we could experience even larger heatwaves than the one observed in Central Europe in 2003. The group is keen to develop the approach, examining aspects such as the return period of prolonged periods of high-temperature.

“If blocking events or their probability of occurrence could be more skillfully predicted in monthly to seasonal forecasts, this would be particularly useful to increase our preparedness for extreme heatwaves in the future,” writes the team in Environmental Research Letters (ERL).

Such information could aid decision-makers in planning disaster risk reduction and adaptation to climate change.

Ionic liquid formulation makes oral insulin pill

Diabetes mellitus is becoming a serious worldwide health problem. This auto-immune disease leads to β-cells being destroyed in type-1 diabetes and progressive β-cell dysfunction in type-2 diabetes. The result is insulin insufficiency in the patient.

Current treatments rely on closely monitoring blood glucose levels and then injecting insulin to simulate natural insulin secretion by pancreatic β-cells. Not only are repeated injections painful, this approach is far from ideal in itself and often fails to keep glucose levels within the tight physiological range required. Complications such as potentially fatal hypoglycaemia can ensue, as well as various pathologies (such as cardiovascular disease, kidney failure, retinopathy and neuropathy) linked to repeated hyperglycaemic episodes.

An insulin capsule that can be swallowed would be much better because not only would it make patients’ lives easier, the delivered insulin would closely mimic the natural physiological path that pancreatic insulin takes (via the portal vein to the liver and then on into the systemic circulation).

Researchers have been working on such a pill for a few decades now, but no formulation has successfully passed clinical trials yet. “One of the main problems to overcome is the fact that insulin is degraded in the stomach by enzymes and gastric acids,” explains Samir Mitragotri of Harvard University. “And even if some insulin survives and enters the intestine, it cannot be absorbed into the bloodstream because of the viscous mucus layer on the intestinal wall and the tight junctions of the intestine cells, through which large molecules such as insulin cannot easily pass.

“In our work, we have overcome these hurdles using ionic liquids.”

CAGE for oral insulin delivery

Ionic liquids consist of organic/inorganic salts and are widely used in various novel chemical and pharmaceutical technologies. In their work, Mitragotri and colleagues suspended insulin in an ionic liquid comprising choline and geranic acid (CAGE). This formation has already proved itself to be efficient for delivering antibiotics and insulin through skin.

“CAGE is good for three reasons for when it comes to oral insulin delivery,” says Mitragotri. “First, it protects insulin against enzyme degradation. Second, it reduces the viscosity of the mucus layer on the intestine, which improves how the insulin permeates across it. Finally, it can pass through the tight junctions of the intestine wall.”

The researchers filled capsules with an acid-resistant enteric coating with 80 microlitres of the formulation and orally administered these to nondiabetic male Wistar rats that had fasted overnight. They then measured blood glucose using a commercial glucose meter every hour for 12 hours and found that a relatively low dose of 10 U/kg dose brings about a 45% decrease in blood glucose levels. The blood glucose drops rapidly within the first two hours and then steadies out, reaching a plateau after 10 hours. In comparison with injected insulin, a dose of 2 U/kg of insulin produces a sharp drop of 49% in one hour, which rises steadily and subsequently peaks at 88% of the initial value in four hours.

Biocompatible and stable

The formulation is also biocompatible, and, according to circular dichroism measurements on its structure, is stable for up to two months at room temperature and up to four months in the fridge (at 4°C).

“Our work demonstrates the feasibility of oral delivery of insulin,” Mitragotri tells Physics World. “The same technology might also be used to deliver other proteins.”

Reporting the work in PNAS 1722338115, the team, which includes researchers from the University of California at Santa Barbara, is now busy with longer term safety and efficacy studies in larger animals. These will pave the way for subsequent human trials.


Introducing Physics World Weekly podcast

In case you haven’t listened to it yet, make sure you check out our new topical podcast, Physics World Weekly.  Each week, a selection of Physics World journalists discuss research breakthroughs, key events and some of the most important talking points in physics and its related disciplines.

Now in its seventh week, yesterday’s episode, presented by Hamish Johnston, explored asteroids, the incredible properties of water, and what it takes to create a successful spin-out business from physics research. We were also joined by special guest Lincoln Carr (see photo above) of the Colorado School of Mines who spoke about his research in quantum simulators as well as his passion for bridging the gap between the sciences and the humanities.

Football fans should also take a listen to this episode where Matin Durrani and I chewed the fat about the ways physics interacts with the beautiful game. The only bit of “fake news” is Matin’s World Cup predictions, which included England crashing out in the group stages of the tournament!

As someone who has spent a good few years learning the craft of video production, I must admit it that producing these first few episodes has been a liberating experience. Where video has an endless list of considerations (lighting, composition, exposure, what to wear??), producing a conversation-based podcast is relatively streamlined. There is a satisfying simplicity in setting up a couple of microphones and encouraging our journalists to speak their minds on the issues they are immersed in every day.

If you enjoy what you hear, then you can subscribe to this podcast on Apple Podcasts and other podcast applications. You can also listen to our other podcast Physics World Stories, which takes a wider look at specific themes in the physics community.

The physics of pizza and Chinese food, a theory of why knitwear stretches so easily

“Chinese cuisine is one of the richest and most interesting cuisines in the world,” write the physicists Andrey Varlamov, Zheng Zhou and Yan Chen in a paper on arXiv that explores the physics of Chinese food. Questions explored by the trio include “What is the difference in the physical processes of heat transfer during steaming of dumplings and their cooking in boiling water?” and “Why is it possible to cook meat stripes in a ‘hot pot’ in ten seconds, while baking a turkey requires several hours?”.

Varlamov is based in Italy so it is not surprising that he has also posted a paper on arXiv about the physics of baking pizza. Teaming up with physicist Andreas Glatz and food anthropologist Sergio Grasso, Varlamov compares pizza cooking in traditional wood-fired brick ovens and modern domestic ovens.

Here is something to think about while your pizza is baking. Why can you easily stretch a knitted scarf, whereas its individual strands of yarn are very difficult to stretch? If you are stumped, check out “Stitching together a knit theory” by Michael Schirber – who explains how physicists in France have created a new model of how knitted fabrics respond to stretching forces.

Rotating resonator creates a one-way street for light

An optical device that uses mechanical rotation to allow light to propagate in one direction along a fibre, but not in the opposite direction has been built by an international team of researchers. The device could find use in optical circuits, where it is very difficult to prevent light from propagating in unwanted directions. However, practical applications may be difficult to achieve.

The idea of using mechanical rotation to allow waves to travel in one direction, but not in the opposite direction, was first developed in 2014 by Andrea Alú and colleagues at the University of Texas at Austin. They placed a fluid into a circular cavity and stirred it so the fluid rotated. Sound waves travelling around the cavity in one direction were pushed along by the fluid, whereas waves travelling in the opposite direction were held back. As a result, the resonant frequency of the cavity was different for sound moving in opposite directions. By judiciously choosing the rotation speed of the fluid, the researchers could ensure that sound waves at a chosen frequency could only travel in one direction around the cavity.

The same ideas can be applied to light waves, however, the speed of light is much faster than the speed of sound, and consequently the frequencies involved are so much higher – making the technique seemingly impractical. Instead, researchers have looked at other ways of achieving one-way transmission – including the use of strong magnetic fields — but these have also proven to be difficult to adapt for practical applications.

Tapered fibre

In the new research, Shai Maayani, Raphael Dahan and Tal Carmon at Technion – Israel Institute of Technology and colleagues have returned to rotation. They use a cylindrical, silica-glass resonator that is 4.75 mm in diameter and is rotated on a turbine at speeds up to 6.6 kHz. An optical fibre that is tapered to be 1088 nm in diameter is located 320 nm above the spinning resonator.

Light travelling along the fibre interacts with the nearby resonator via the light’s short-range evanescent field. In analogy to the rotating fluid, light travelling in the same direction as the spinning resonator perceives it to be less dense than does light travelling in the opposite direction. This difference in apparent density means that the index of refraction of the resonator will be different for light moving in opposite directions.

For this reason, the resonant frequency of the system is different for light travelling in opposite directions. This allowed the researchers to pass light of the same frequency down the fibre from both ends and have light be transmitted from one side but blocked from the other: “Wavelengths that are off resonance with the cavity will be transmitted; wavelengths on resonance with the cavity are absorbed,” explains Maayani, now at the Massachusetts Institute of Technology.

Delicate matters

The team is now looking at the feasibility of creating practical devices: “A tapered fibre will fail after a few hours because of the humidity in the air,” explains Maayani. “But if you encapsulate it in an inert environment, it can last for years. The other big problem is vibration – at present, this is a delicate experiment that requires an optical table.”

Alú – now at City University of New York – is impressed by the researchers’ technical achievement, saying that, “from the fundamental side, they’re proving what we already proved for sound, but they’re doing it for light – which is impressive, because the technology required is much more complicated”. He says that the device could have advantages over optomechanical systems in energy efficiency, but the researchers will need to demonstrate its practicability when scaled down: “As you scale things down, typically the quality factors go down and the requirement on speed goes up. At some point, some trade-offs will have to be made,” he says.

Mohammad Hafezi of University of Maryland, College Park agrees: “I find it very cool that we can rotate something and look at the huge spectral shift in transmission between forward and backward,” he says, “but in terms of non-magnetic non-reciprocity, this whole field has been a challenge, and we haven’t seen a real technological solution yet.”

The invention is described in Nature.


Are amyloid PET scans ready for the clinical setting?

© AuntMinnieEurope.com

The use of PET scans to confirm the presence of dementia-inducing amyloid plaque in the brain may be ready for routine clinical use, based on a prospective study published in JAMA Neurology. Researchers found that both positive and negative results influenced the diagnosis and treatment of patients with and without dementia (JAMA Neurol. 10.1001/jamaneurol.2018.1346).

The researchers took the unique approach of enrolling subjects ranging from patients with confirmed cognitive impairment to people with no dementia at all. They discovered the presence of amyloid in both sets of subjects, which could provide a “bridge between validating amyloid PET in a research setting and implementing this diagnostic tool in daily clinical practice,” they wrote.

“Our findings demonstrate that both amyloid-positive and amyloid-negative PET results changed diagnosis and treatment in a significant number of patients,” said lead author Arno de Wilde from VU University Medical Center (VUMC) in Amsterdam. “We observed this in both patients with and without dementia, [so] amyloid PET can be of value in a selection of patients in clinical practice.”

Amyloid factor

The accumulation of beta amyloid in the brain is one key indicator of possible progression to dementia or Alzheimer’s disease. With the development of tracers such as carbon-11-labelled Pittsburgh Compound B (C-11 PiB) and amyloid PET imaging, the modality has become increasingly important in the research of neurodegeneration.

Arno de Wilde

Researchers at VUMC have been performing amyloid PET scans in selected research patient populations for several years now. More recently, they have begun to make the modality available in clinical practice, using amyloid PET in people seen in the institution’s memory clinic as part of routine diagnostic workup, de Wilde wrote in an email to AuntMinnie.com.

“We offered amyloid PET to all patients visiting our clinic, even if they were not cognitively impaired or there was no suspicion of Alzheimer’s disease,” he said. “This unique approach gave us the opportunity to determine the value of amyloid PET in an unselected memory clinic population.”

VUMC’s amyloid PET protocol includes the radiotracer florbetaben (Neuraceq, Piramal Imaging). It is indicated for PET imaging to estimate beta-amyloid neuritic plaque density in adult patients with cognitive impairment who are being evaluated for Alzheimer’s disease and other causes of cognitive decline.

Florbetaben is one of three F-18-labelled amyloid PET tracers that have been approved by the US Food and Drug Administration and the European Medicines Agency for clinical use. The other two are florbetapir (Amyvid, Eli Lilly) and flutemetamol (Vizamyl, GE Healthcare).

“Amyloid PET has been proven to be a valid and stable technique to visualize cerebral amyloid plaques,” de Wilde said. “However, studies that demonstrate the usefulness of amyloid PET in patients whose diagnosis and treatment are based on amyloid PET status are lacking.”

Clinical subjects

The researchers enrolled 507 patients from VUMC’s memory clinic who were participating in the Alzheimer Biomarkers in Daily Practice (ABIDE) project between January 2015 and December 2016. The subjects had a mean age of 65 years (±8 years) and varying degrees of dementia and cognitive issues.

The subjects consisted of 164 (32%) people with Alzheimer’s dementia, 114 (23%) with mild cognitive impairment, 159 (31%) with subjective cognitive decline, and 70 (14%) with non-Alzheimer’s dementia. Cognition evaluations were based in part on Mini-Mental State Examination (MMSE) test scores and a family history of dementia.

From that information, one of two neurologists who co-authored the study determined whether subjects presented with clinical symptoms of Alzheimer’s, such as dementia, mild cognitive impairment or subjective cognitive decline. The neurologists then determined the suspected aetiology of the symptoms, with causes including Alzheimer’s disease, vascular problems, frontotemporal dementia, Lewy body dementia or a neurodegenerative disease. The physicians then rated their level of diagnostic confidence in the suspected aetiology on a scale of 0% to 100%.

Amyloid accumulation

The researchers found evidence of amyloid on the PET scans of 242 patients (48%). Amyloid was most prevalent among the 164 patients with Alzheimer’s dementia: 128 were amyloid-positive (78%). Subjects with non-Alzheimer’s dementia were the next most prevalent group, with 45 (64%) of 70 being positive for amyloid.

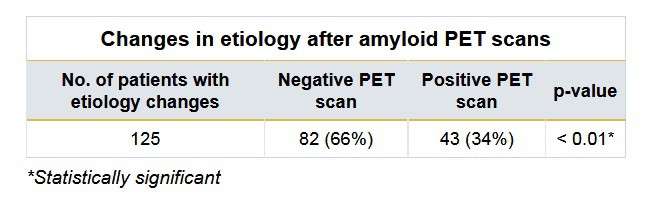
After undergoing amyloid PET scans, the suspected aetiology changed for 125 patients (25%), with a negative PET scan contributing more significantly to the change in diagnosis than a positive PET scan.

Aetiology changes after PET

Treatment plans changed for 123 patients (24%), the researchers found. A positive amyloid PET scan prompted changes in medication, a clinical trial referral or both, while a negative amyloid PET scan most often resulted in a follow-up FDG-PET scan, genetic screening or referral to a psychiatrist.

Changes in diagnoses did not differ significantly between patients with dementia (50 of 234, 21%) versus subjects without dementia (75 of 273, 28%) (p > 0.05).

As for the neurologists reading the results, the additional information gleaned from the amyloid PET scans boosted their diagnostic confidence by a mean of 80% to 89% (p < 0.001).

“This study goes beyond previous findings, as we also assessed patient-reported outcomes,” the authors wrote. “More than 80% of patients experienced the PET scan as not burdensome. One-fifth of patients expected the PET scan to be burdensome, and a similar fraction, looking back, said to have experienced the PET scan as burdensome.”

In addition, when patients were told of the amyloid PET scan results, their level of uncertainty decreased while their anxiety levels remained stable. That finding, de Wilde suggested, means that disclosing the PET result in clinical practice does not have an adverse effect on patients’ psyche.

“The current study demonstrates that amyloid PET can be valuable in a selection of patients,” he concluded. “We are currently trying to identify those patients who benefit most from amyloid imaging and create a tool that helps clinicians to identify those patients.”

  • This article was originally published on AuntMinnieEurope.com © 2018 by AuntMinnieEurope.com. Any copying, republication or redistribution of AuntMinnieEurope.com content is expressly prohibited without the prior written consent of AuntMinnieEurope.com

West Antarctica’s rocks’ rise may slow ice melt

Its ice sheet may be melting, but West Antarctica’s rocks are on the way up. In a dramatic demonstration of geology’s in-depth response to surface change, the submerged bedrock of that part of the southern continent is springing upwards at 41 mm a year.

And as it does so, it may slow the rate of inexorable ice melt, as the western part of the continent sheds ice in response to global warming driven by profligate human combustion of fossil fuels.

But for the moment the finding is yet another surprising demonstration of what geophysicists call isostatic response: as mass is shifted from the surface of the continent – and that region of Antarctica has lost three trillion metric tons of ice in the last 25 years – the semi-liquid rocks of the Earth’s mantle, deep below the continental crust, flow below the lightening burden to liftthe crustal rocks higher.

This rate of rise is unexpectedly rapid. As more ice melts, the process is likely to accelerate. A century from now, that stretch of Antarctic peninsula could have risen by 8 metres.

“When the ice melts and gets thinner, the Earth readjusts, and rises immediately by a few millimetres, which depends on the ice lost,” said Valentina Barletta, of the Technical University of Denmark, who led the research.

“But the earth also acts a bit like a very hard memory-foam mattress. And it slowly keeps readjusting for several thousand years after the melting. In Scandinavia the bedrock is still rising about 10 millimetres per year because of the last ice age.”

Dr Barletta and US colleagues report in the journal Science that they gathered data from six global positioning satellite stations fixed to the exposed rock around a stretch of West Antarctica called the Amundsen Sea embayment.

They coupled that with seismic studies of the crustal bedrock and then ran an immense number of computer simulations to settle on the most likely explanation – that deep beneath that point of the southern continent, the Earth’s mantle was relatively hotter and more fluid, and could respond to changes in mass more swiftly.

Polar perplexities

At the heart of such research is the puzzle of southern polar dynamics: the complex interplay of ocean, atmosphere, precipitation and topography that keeps Antarctica the coldest, driest, iciest place on the planet: it may be technically a desert, but its continental crust carries almost two thirds of the world’s freshwater in frozen form. If it all melted, global sea levels would rise by 70 metres.

But such is the weight of ice that some parts of the continent are depressed below sea level. In West Antarctica the surrounding sea ice is so thick it is anchored to submerged bedrock, to provide a buffer that slows the rate of glacial flow from inland.

Right now, the West Antarctic Ice Sheet is spilling into the oceans the equivalent of a quarter of all the planet’s melting ice. If all of West Antarctica were to melt, global sea levels would rise by three metres.

And the fear is that, as the oceans and atmosphere warm in response to ever-rising levels of greenhouse gases in the atmosphere, winds and currents could loosen the great shelves of sea ice and send them floating north, at which point the glacial flow from the high ground of the continent to the sea would accelerate.

Stability explained

So the latest discovery helps explain the wider puzzle of why Antarctica’s ice has been relatively stable over long geological periods: as the ice melts, the bedrock rises, and the ice shelves are more likely to stay anchored to the mainland, at least at that particular “pinning point” above a hotter, more fluid mantle.

There is another factor at work: the gravitational pull of the ice itself, which raises sea level near the great mass of ancient polar ice. As the ice melts, the gravitational tug diminishes, and the sea levels subside.

“The lowering of the sea level, the rising of the pinning points and the decrease of the inland slope due to the uplift of the bedrock are all feedbacks that can stabilise the ice sheet,” said Terry Wilson, of Ohio State University, and one of the authors. “Under many realistic climate models, this should be enough to stabilise the ice sheet.”

But as planetary average temperatures rise, so does the hazard. Rick Aster, of Colorado State University, and another of the authors, warned: “To keep global sea levels from rising more than a few feet this century and beyond, we must still limit greenhouse gas concentrations in the atmosphere, which can only occur through international cooperation and innovation.”

Copyright © 2026 by IOP Publishing Ltd and individual contributors