Plasma physicists who publish on the arXiv preprint server have the widest range of research interests. That is according to a new analysis carried out by theorist Sabine Hossenfelder at the Frankfurt Institute for Advanced Studies (FIAS) in Germany and Tom Price, who have introduced a new way to quantify a scientist’s “scientific broadness”. The authors of the paper, which is published on arXiv, say that determining broadness could be used alongside other metrics to measure a researcher’s output.
Scientists have long determined their output by using quantities such as the h-index – a measure of the quality of an individual’s research output based on the number of published papers and their citation rates. Yet scientists are also keen to put a figure on woollier concepts such as the broadness of their research. “I began to wonder if there isn’t a way to quantify just what we mean by ‘broad interests’,” explains Hossenfelder.
Science needs both, specialized and broad researchers
Sabine Hossenfelder
To quantify broadness, Price and Hossenfelder identified 40,000 key words in the title and abstract of more than 1.3 million papers on arXiv. They then assigned keywords to the papers and their authors, leaving each author with a list of associated keywords. The more similar an author’s keywords were to the distribution of the keywords of all authors in the arXiv database the greater their scientific broadness. “The concept that we try to capture is how widely distributed the topics a researcher has worked on are over all existing topics,” Hossenfelder told Physics World.
When they looked at authors that had more than 20 papers on arXiv, the researchers found that those primarily associated with the categories plasma physics, numerical analysis and statistical mechanics had the highest author broadness, on average. Authors associated with astrophysics of galaxies, representation theory and algebraic geometry, meanwhile, had the lowest broadness.
Interdisciplinary benefits
According to Hossenfelder, broadness is neither good or bad. “I think science needs both, specialized and broad researchers,” she explains. “Each have their place, but each fulfil different needs. Sometimes digging deep into a problem is the way through, and sometimes you find new inspiration while learning what goes on in other disciplines.” The study also looked at looked at where the authors did the work to establish a “country broadness”. They found that researchers based in Israel, Austria and China carried out the broadest research, with Japan, Iran and South Korea languishing at the bottom.
Lutz Bornmann, a sociologist of science at the Max Planck Society in Munich, Germany, who was not involved in the research, told Physics World that crossing disciplinary boundaries is important, particularly when addressing complex problems such as global warming. He adds that broadness could be useful for evaluating individual researchers, explaining that some methods select researchers based on the number of highly-cited papers within certain disciplines, possibly disadvantaging those that work across fields. “The new broadness metric could be used to empirically study that and to reveal this supposed weakness,” he adds.
A minuscule correction to the calculation of Mercury’s orbital precession has been made using previously unexplored consequences of Albert Einstein’s general theory of relativity. Clifford Will at the University of Florida has derived new equations of motion to describe a shift of one degree every two billion years in the direction of orbit’s perihelion. Although the tiny movement is currently undetectable, the correction could soon be measured when the BepiColombo mission to Mercury is launched later this year.
Every century, the perihelion of Mercury’s elliptical orbit – the point where the planet is nearest to the Sun – rotates (or “advances”) by around 0.16°. The shift can mostly be explained by using Newton’s laws to calculate the pull of other planets in the Solar System, however a discrepancy between observations and calculations became apparent in the 19th century. In 1916, Einstein famously solved the mystery using general relativity. Now, Will has shown that calculations made by Einstein – and then improved on by others – do not tell the entire story.
Writing in Physical Review Letters, Will predicts that Mercury’s orbit is further influenced by relativistic “cross-terms”, which account for the general relativistic influence of the Sun throughout the entire Solar System. The terms are described using relativistic equations of motion for a system of multiple bodies, which all exert a gravitational pull on each other. Will derived equations which account for how the gravitational attraction between the Sun and other planets has an indirect influence on the pull between the Sun and Mercury.
Gravitomagnetic field
The cross-term equations also describe other smaller influences, accounting for the similar relativistic effects arising from the gravitational attraction between other planets and Mercury. Additionally, the “gravitomagnetic field” of the other planets – which, in analogy to the magnetic field, is generated by the “mass currents” of the planets – shifts Mercury’s orbit further. Overall, Will predicts an additional perihelion advance of one degree every two billion years.
Later this year, the joint European-Japanese BepiColombo mission will send two probes to orbit Mercury, allowing for far more accurate measurements of its motion. Will hopes that the measurements will confirm his predictions, which could ultimately help to further advance our understanding of general relativity.
Major changes are taking place in the intricate network that supplies healthcare providers around the world with molybdenum-99 (Mo-99), a key radioisotope for nuclear medicine studies. The question is, can the nuclear medicine community avoid another devastating shutdown like the one that occurred in 2009?
Back then, providers were left scrambling after a perfect storm left sites without supplies of Mo-99, which cannot be stockpiled due to its extremely short half-life. In the years since the 2009 crisis, nuclear reactor operators, nuclear medicine pharmacies and practitioners, radioisotope generator manufacturers, medical societies, and other stakeholders have banded together to ensure that adequate supplies of Mo-99 and its technetium-99m (Tc-99m) byproduct are consistently available.
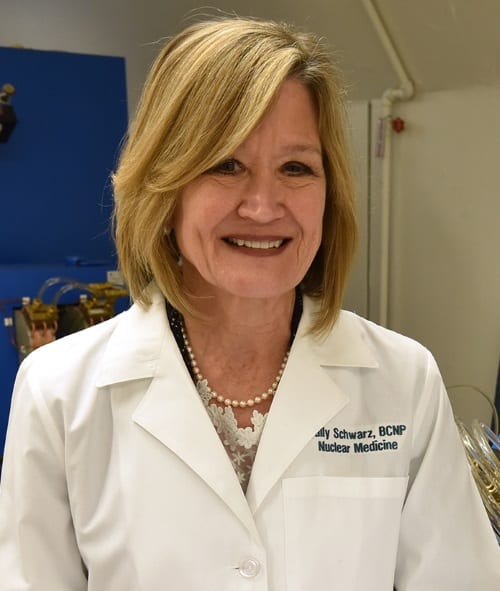
Sally Schwarz from Washington University School of Medicine in St. Louis.
“This whole occurrence of 2009 really presented a wake-up call to the industry at large, but I think we have embraced it,” said Sally Schwarz, co-director of the cyclotron facility at the Washington University School of Medicine in St. Louis. “This has been an extensive and time-consuming process to move this change forward.”
One of the more significant steps to Mo-99 stability was the creation in 2009 of a joint effort between the Organization for Economic Cooperation and Development (OECD) and the Nuclear Energy Agency (NEA). The goal is to coordinate Mo-99 production and develop ways to ensure that supply meets worldwide demand; the organizations’ members cover the gamut of nuclear medicine enthusiasts and meet every six months in Paris.
The Society of Nuclear Medicine and Molecular Imaging (SNMMI) and the European Association of Nuclear Medicine (EANM) are also on hand to advocate for physicians who use radioisotopes in the treatment of their patients.
One of the tenets of the OECD-NEA collaborative is to develop an outage reserve capacity. That means Mo-99 suppliers must have permanent arrangements in place to acquire additional capacity to cover shortfalls when reactors go offline for scheduled or unplanned maintenance.
“On the recommendations of the NEA and OECD, there is a 35% contingency supply,” said Cathy Cutler, director of the Medical Isotope Research and Production (MIRP) program at the Brookhaven National Laboratory. “If someone goes down, you can call on this 35%. They are basically asking radiators to produce this additional amount.”
The outage reserve capacity is maintained by Mo-99 suppliers paying for extra ports and time on a nuclear reactor. If a supply issue occurs, they then have a position in line to acquire additional Mo-99 to cover the shortfall.
Supply and demand
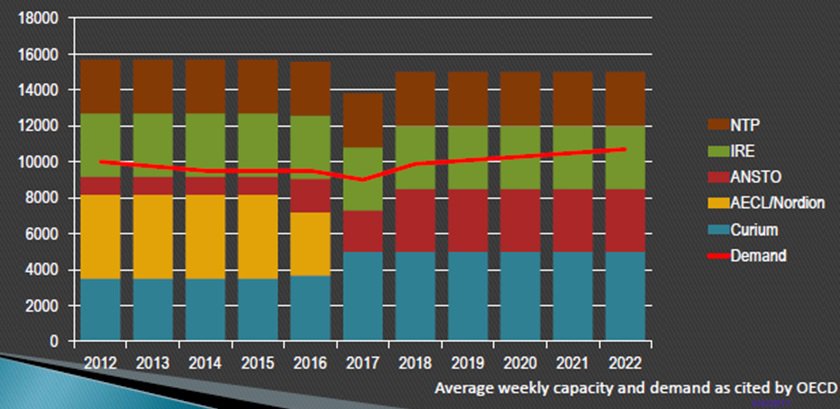
The demand for Mo-99 is expected to grow modestly over the next four years, peaking at approximately 11,500 Ci per week. Interestingly, the anticipated upswing follows a reduced call for Mo-99 in 2017. Currently, the OECD estimates that worldwide demand for Mo-99 is at 9000 six-day Ci per week. Mature markets account for approximately 84% of the demand, while emerging markets take the remaining 16%. The growth rate in mature markets is expected to remain stable at 0.5% through 2021.
Mo-99 production capacity at major producers (six-day Ci per week). (Courtesy: Sally Schwarz)
Whatever demands are to come will be handled by fewer Mo-99 suppliers, however. On March 31, the National Research Universal (NRU) nuclear reactor in Chalk River, Ontario, Canada, went offline for the final time after serving North America for decades. Even before its permanent closure, the NRU reactor manufactured little if any Mo-99 since October 2016. In addition, the Osiris reactor in France shut down at the end of 2015. Their departure leaves four Mo-99 manufacturers who now must cover the loss.
Australian Nuclear Science and Technology Organization (ANSTO)
ANSTO‘s Open Pool Australian Lightwater (OPAL) nuclear reactor currently produces some 2300 Ci per week. With the help of a $168 million ($128 million US) investment from the Australian government, ANSTO is in the process of completing work on its state-of-the-art ANSTO Nuclear Medicine (ANM) Mo-99 production facility. ANM this month received its license to operate and begin testing its Mo-99 production process in May.
“It involves introducing the irradiated low-enriched uranium target plates from the OPAL reactor to the hot cell, extracting and purifying Mo-99 from them, and going through various medicine manufacturing sequences, such as quality control checks,” Jane Senior, general manager for ANM, wrote in an email to AuntMinnie.com.
ANM will take over the primary Mo-99 manufacturing duties from the OPAL reactor, with production increasing to approximately 3500 six-day Ci per week at full capacity, which is scheduled to occur before the end of this year. That amount would allow ANSTO to serve Australia’s needs and potentially accommodate approximately 25% of global demand.
ANM’s ability to perform three Mo-99 runs in one day, rather than one run per day at OPAL, is also expected to provide additional supplies during peak weekend periods.
Curium
Nuclear medicine firm Curium was created in April 2017, three months after IBA Molecular’s acquisition of Mallinckrodt Nuclear Medicine. The entity’s roots date back to 1996 when Dutch radiopharmaceutical producer Nuclear Research and Consultancy Group (NRG) began Mo-99 production at its High Flux Reactor (HFR) in Petten.
Today, Curium takes its Mo-99 supply from the HFR; the Belgian Reactor 2 (BR2) in Mol, Belgium; and the Maria reactor in Warsaw, Poland. Last year, Curium increased its take from four to five runs per week, which brought its capacity to approximately 4500 Ci per week. If necessary, Curium could increase its output to six productions per week.
In addition, Curium has outage reserve capacity arrangements with the three reactor operators, which could add approximately 100 weeks of supply during a Mo-99 shortage. And if one of those reactors goes offline, one of the other two facilities can make up the difference.
NTP Radioisotopes
NTP Radioisotopes in South Africa has its own dedicated nuclear reactor that manufactures a number of targets, including Mo-99. The Safari-1 reactor processing facility completed its conversion to low-enriched uranium (LEU) last September. The reactor’s capacity for Mo-99 is in the range of 1400 Ci per week.
“We want to be in nuclear medicine and the technetium-99m supply business for many years to come,” commented Piet Louw, executive manager for NTP Radioisotopes, during a June 2017 SNMMI forum on Mo-99. “We believe that 20 years from now there will still be a big demand for technetium, and we want to be there to service this demand. We are committed to it and we are making the necessary investments.”
Institute for Radioelements (IRE)
While it is capable of greater capacity, IRE‘s license allows for three days of Mo-99 production or 3500 Ci per week using an LEU process. That output represents approximately 25% of the weekly global demand. IRE also has contracts to take Mo-99 supply from the HFR in the Netherlands, the BR2 in Belgium, and the LVR-15 reactor in the Czech Republic.
“The problem we faced in 2009 and 2010 was not a capacity problem, because the capacity was there,” Jean-Michel Vanderhofstadt, CEO of IRE, recalled at the SNMMI event. “The problem was reliability. Reliability is the key in this business.”
Mo-99 alternatives
Demand for Mo-99 has held fairly steady since the shortage in 2009. One reason for the decline last year may be that nuclear medicine practitioners are wary of history repeating itself and believe they should have other radioisotope options.
“I think part of that [decrease in 2017] is because people have been looking for other isotopes they can use, so they are not so strongly dependent on Mo-99 because of the shortages,” Cutler said.
Among its tasks, Brookhaven’s MIRP program distributes certain commercially unavailable radioisotopes to the nuclear medicine community and develops new radioisotopes for nuclear medicine research. The facility has an accelerator to produce radionuclides and isotopes for imaging.
“One of the prominent uses for Mo-99 is for imaging the heart. Another agent that can be used to do that is strontium-rubidium, which we can make on the accelerator,” Cutler said. “The demand [for strontium-rubidium] has been higher than what is produced. The use of rubidium has been increasing because of the [Mo-99] supply problems.”
At Washington University in St. Louis, there are four clinical cyclotrons that manufacture F-18 FDG, nitrogen-13 ammonia, technetium-99m sestamibi, and carbon-11 choline, among others. The radiotracers are primarily used onsite and not distributed unless the facility receives a call from a nearby imaging centre.
“Although nuclear medicine is not growing rapidly, it still is a very important diagnostic tool and we have a very broad base in the US,” Schwarz said. “We certainly need to be thinking about how we can produce Mo-99 and have technetium-99m.”
Earth’s wet areas – land in the high latitudes and tropics – are getting wetter while dry areas are becoming more dry, according to 14 years of observations from the Gravity Recovery and Climate Experiment (GRACE) mission. The pattern is due to a mix of factors, including water management by people, man-made climate change and natural climate cycles.
“What we are witnessing is major hydrologic change,” said Jay Famiglietti of NASA’s Jet Propulsion Laboratory (JPL), US, in a press release. While water loss in some regions, like the melting ice sheets and alpine glaciers, is clearly driven by warming climate, he noted, it will require more time and data to determine the driving forces behind other patterns of freshwater change.
“The pattern of wet-getting-wetter, dry-getting-drier during the rest of the 21st century is predicted by the Intergovernmental Panel on Climate Change models, but we’ll need a much longer dataset to be able to definitively say whether climate change is responsible for the emergence of any similar pattern in the GRACE data,” Famiglietti said.
A joint NASA/German Aerospace Centre endeavour, GRACE launched a pair of satellites in 2002. Measuring the distance between the two satellites revealed changes in Earth’s gravity field caused by movements of mass – such as water – on the planet below. The mission ended in October 2017.
For this freshwater analysis, Famiglietti and colleagues combined GRACE data with precipitation data and imagery from other satellites, and reports on human agriculture, mining and reservoir operations.
“This is the first time that we’ve used observations from multiple satellites in a thorough assessment of how freshwater availability is changing, everywhere on Earth,” said Matt Rodell of NASA’s Goddard Space Flight Center. “A key goal was to distinguish shifts in terrestrial water storage caused by natural variability – wet periods and dry periods associated with El Niño and La Niña, for example – from trends related to climate change or human impacts, like pumping groundwater out of an aquifer faster than it is replenished.”
The GRACE Follow-On mission is due to launch from California soon.
In the first episode of our new podcast, Physics World Weekly, we bring you a selection of stories on light and light-based technologies. 16 May 2018 was the inaugural International Day of Light, a UNESCO-backed initiative to promote the role light plays in science and society. This annual initiative will provide the legacy of the International Year of Light (IYL 2015), which saw thousands of activities take place across 147 countries, reaching an estimated audience of 100 million people.
In the podcast, Physics World journalist James Dacey visits a pub in Bath where he meets Peter Mosely, a researcher at the centre for photonics and photonic Materials at the University of Bath. On the International Day of Light, Mosely gave a public lecture about his group’s work and its possible applications in quantum computing and cryptography. He tells Dacey about the opportunities and challenges of doing public outreach events.
Also in the podcast, Physics World’s general physics editor Hamish Johnson is in conversation with the magazine’s industry editor Margaret Harris. They discuss a new Institute of Physics report on the state of the photonics industry in the UK and recommendations for its growth. Johnston also speaks about a story he recently covered about how leaks of natural gas can be detected using laser frequency combs.
If you enjoy the podcast then you can subscribe via iTunes or your chosen podcast service. Join us again for another instalment next week. In the meantime, you can also listen to our longstanding monthly podcast, Physics World Stories.
The distribution of pressure inside the proton has been mapped by physicists using the electron accelerator at Jefferson Lab in Virginia, US. By putting a new twist on Compton scattering, the team showed that the extreme repulsive pressure experienced by quarks in the centre of the proton is balanced by strong attractive forces around the edges. The research sheds further light on how quarks are confined inside protons and other hadrons – which is one of the most important mysteries of modern particle physics.
Quantum chromodynamics says that the strong nuclear force binds quarks into protons through the exchange of force particles called gluons, much as the electromagnetism binds electrons into atoms by the exchange of photons. Whereas electromagnetism gets weaker with increasing distance, the strong nuclear force gets stronger. Therefore, knocking a quark out of a proton and studying it in isolation is impossible. Instead, striking a single quark too hard gives the gluon field so much energy that a new quark-antiquark pair is created: “You would produce either a neutron plus a meson (a bound state of a quark and an antiquark) or a proton plus a meson,” explains Jefferson Lab’s Volker Burkert. “We want to study the transition from a proton to a proton so we can see what’s happening in the proton itself – not in the transition to some other state.”
In 1996, Xiangdong Ji of the University of Maryland proposed a way to do this using a process called “deeply virtual Compton scattering”. This involves firing high-energy, spin-polarized electrons at protons. Ji realized that such an electron could exchange energy and angular momentum with a proton in the form of a high-energy virtual photon, which only exists for a tiny fraction of a second. The proton then releases some of this extra energy in the form of a real photon. Ji showed theoretically that, if the scattered electron and proton and the emitted photon were all detected, this could reveal the pressure inside the proton.
Essential developments
Deeply virtual Compton scattering was first detected experimentally in 2000 by Burkert’s group at Jefferson Lab and, independently, by physicists in Germany. Subsequently, there have been several essential experimental and theoretical developments by Burkert, Ji and many others such as measurements of the probability that the process will occur (the scattering cross section) for spin-polarized electrons of various energies and calculations of the links between scattering and internal pressure.
In the new research, Burkert and colleagues at Jefferson Lab brought all of this together for the first time in an experiment. They measured deeply virtual Compton scattering between a spin-polarized beam of 6 GeV electrons and a cryogenic liquid hydrogen target to probe the internal structure of protons. They calculated that there was a repulsive pressure in the proton’s centre of about 1035 Pa – greater than in the centre of a neutron star. Around 0.6 fm (0.6 x 10⁻¹⁵ m) from the centre, however, the forces became strongly attractive and peaking at 0.8 fm radius. The researchers say that this is a significant improvement over our previous understanding of the pressure inside the proton. They anticipate it should be possible to reduce their errors further following the Jefferson Lab accelerator’s recent upgrade from 6 GeV to 12 GeV, potentially unlocking the secrets of quark confinement. The researchers also intend to explore deeply virtual Compton scattering in neutrons.
“It’s a good, interesting study and a first step into the extraction of the quark pressures inside a proton,” says particle physicist Kresimir Kumericki of the University of Zagreb in Croatia. He wants more technical details of the researchers’ error analysis but he says that “even if the uncertainties are larger [than they claim], it’s still important that…such analysis can be used to get a physical picture of the proton.”
Universal concept
“I think it’s a really interesting generalization of the theoretical concept of pressure,” says Oleg Teryaev of the Joint Institute for Nuclear Research in Dubna, Russia. “Pressure unites all the scales, from the universe and cosmology – where you have the cosmological constant – to stars, to hydrodynamics, to heavy-ion physics and now finally to protons. All elements of this relation can be studied and I am looking forward to that with excitement.”
For a global average temperature rise of 1.5 °C, 16% of the world’s population in 2050 – 1.5 billion people – will have moderate-to-high levels of risk in two or more of the water, energy, and food and environment sectors. At 2 °C this figure nearly doubles to 29% of global population, whilst at 3 °C of warming it rises to half the population, or 4.6 billion people.
“Few studies have consistently investigated so many overlapping climate and development challenges,” said Edward Byers of the International Institute for Applied Systems Analysis (IIASA), Austria, in a press release. “The research considers both different global mean temperature rises, such as the differences between 1.5 °C and 2.0 °C, and uses new socioeconomic datasets of income levels and inequality, to identify where and to what extent the most vulnerable in society are exposed to these climate-development challenges.”
At lower temperature rises, hotspots of risk in two or more sectors were mainly in south and east Asia, Byers and colleagues found. At higher global temperatures, hotspots also broke out in Central America, west and east Africa, the Middle East and the Mediterranean.
Depending on the scenario used, 91–98% of the exposed and vulnerable population live in Asia and Africa. Sustainable development in hotspot areas could reduce the number of people who are exposed and vulnerable by an order of magnitude, from 1.5 billion to 100 million, compared to the high inequality scenario, according to the researchers.
“The research will be most relevant to policymakers and others looking to understand the benefits of keeping the average global temperature rise to 1.5 °C rather than 2 °C, as well as providing insights into the regions most at risk across different sectors,” said Astrid Hillers of Global Environment Facility, US. “The poorest and most vulnerable countries are most at risk and this work will aid to identify integrated, cross-sectoral approaches and target resources for maximum impact.”
The land mass affected, 3–16% depending on the scenario, was relatively small but the areas at highest risk tend to have high population densities.
Researchers at MIT’s Little Devices Lab have developed a set of modular blocks that can be assembled in different ways to produce diagnostic devices for functions such as infection detection and glucose monitoring. These “plug-and-play” blocks are inexpensive, reusable and require little expertise to assemble (Advanced Healthcare Materials doi: 10.1002/adhm.201800104).
“Our long-term motivation is to enable small, low-resources laboratories to generate their own libraries of plug-and-play diagnostics to treat their local patient populations independently,” explained Anna Young, co-director of the Little Devices Lab.
The components, called Ampli blocks, are based on paperfluidics technology in which chemical reactions occur on paper strips. They consist of a sheet of paper or glass fibre sandwiched between a plastic or metal block and a glass cover. The blocks, which are about half an inch on each side, snap together along any edge to construct customized diagnostic devices.
The MIT team has created about 40 different building blocks, colour coded by function, that lab workers around the world could easily assemble on their own. Some blocks contain channels for liquid samples to flow straight through, some have turns and can mix multiple reagents together. The blocks can also perform biochemical functions. For example, many contain antibodies that can detect a specific molecule in a blood or urine sample.
The blocks do not require refrigeration or special handling, making them appealing for use in the developing world. “We see these construction kits as a way of lowering the barriers to making medical technology,” said senior author Jose Gomez-Marquez, co-director of the Little Devices Lab.
The researchers are using the Ampli blocks to create devices to detect cancer, as well as Zika virus and other infectious diseases. They are also working on tests for human papilloma virus, malaria and Lyme disease, among others. In addition, they are working on blocks that can synthesize useful compounds, including drugs, as well as blocks that incorporate electrical components such as LEDs.
The ultimate goal is to get the technology into the hands of small labs in both industrialized and developing countries, so they can create their own diagnostics. The MIT team has already sent Ampli blocks to labs in Chile and Nicaragua, where they have been used to develop devices to monitor patient adherence to tuberculosis treatment and to test for a genetic variant that makes malaria more difficult to treat.
The researchers are now investigating large-scale manufacturing techniques, and they hope to launch a company to manufacture and distribute the kits around the world.
Over two thirds of researchers have released the results of at least one study they authored before the findings were formally published. That is according to a survey of more than 7000 researchers across nine disciplines carried out by Jerry Thursby from Harvard University’s Laboratory for Innovation Science and colleagues. The researchers found that social scientists, mathematicians, biological scientists and those working in agriculture have the highest disclosure rates, with around 75% sharing the results of work before final publication. The figure for physical scientists is slightly less, at 67%.
The survey found that most academics who share their work early – either at conferences, in preprint papers or during earlier conceptual stages – do so to get feedback from peers. Other reasons include receiving credit for their work early, attracting potential collaborators and deterring competition. Researchers who share the least, meanwhile, are the most worried about being scooped by their peers.
The authors say that why some academics share earlier than others depends on the norms within their field, the amount of competition and how commercial their field is. This could explain why only around 40% of computer scientists and 55% of engineers report sharing their results before final publication – much lower than in purer areas of work.
“Discipline norms are also reflected in embargoes or regulations by major publishers within a discipline that prohibit early sharing of results,” notes Carol Tenopir, an information scientist at the University of Tennessee in Knoxville. “Willingness to disclose may not be possible according to rules governing the major publication outlets in their field.”
Bernd Pulverer, head of scientific publications at the European Molecular Biology Organization in Heidelberg, Germany, is surprised by the amount of prepublication sharing in biology. “I share the preconception with many others in the field that the biological sciences have, up to now, been relatively circumspect in relation to prepublication disclosure at conferences or on preprints,” he says. “The study here suggests that this is not the case.”
Pulverer is impressed with the number of researchers in the survey. “It would be very useful to follow up with the same questionnaire in about five years when fields like biology have had time to embrace preprints more and when regions like Europe have had time to develop their open-access mandates,” he adds.
Energy-saving solid-state lighting and full colour displays have come along in leaps and bounds in recent years with materials that emit bright, pure colours. To create white light, we need red, green and blue sources, but blue light is the most challenging to produce. Indeed, it took researchers an extra two decades to create the first blue-light emitting diodes (LEDs) after red and green ones were made in the 1950s and 60s.
Efficient blue-light emitting materials for displays need not only to emit bright light, they also need to do this over a narrow wavelength range. Making such materials has proved to be no easy task, and even the purest and defect-free candidates, such as epitaxially-grown gallium nitride films, only manage to reach a maximum photoluminescence quantum yield (PLQY) of less than 1%. This low value is due to rapid non-radiative recombination of charge carriers (electrons and holes) through surface and bulk defects (or traps) and a low radiative recombination rate associated with a small exciton (electron-hole pair) binding energy.
Although other materials, such as inorganic phosphors, fare much better when it comes to PLQYs, their insulating properties result in high turn-on voltages, which means that they cannot be used in LEDs. They unfortunately also emit spectrally broad light.
2D layered perovskites
Organic-inorganic hybrid perovskites could be the answer here. These materials are one of the most promising thin-film photovoltaics around today thanks to the fact that they can absorb light over a broad range of solar-spectrum wavelengths. Researchers led by Edward Sargent of the University of Toronto in Canada have been studying 2D layered perovskites with the composition R2PbBr4, where R stands for organic ammonium cations, Pb is lead and Br is bromine. Such perovskites boast fast radiative recombination rates (thanks to localized excitons) and a narrow light emission linewidth.
“In particular, we investigated the effect of electron-phonon interactions on the luminescence of single crystals of 2D perovskites,” explains team member and lead author of the study Xiwen Gong. “We found that reducing these interactions can lead to bright blue emission in these materials.” Phonons are quantized lattice vibrations that behave like particles.
The researchers studied the strength of electron-phonon coupling and how rigid the crystals were using several techniques, including deformation potential analysis, resonance Raman spectroscopy, single-crystal X-ray diffraction, neutron scattering and solid state nuclear magnetic resonance. The neutron studies were carried out at Oak Ridge National Laboratory.
PLQY of up to 79% and a linewidth of just 20 nm
The results reveal that the brightest emitters are those that are the most rigid. “By varying the molecular configuration of the ligands on the perovskite, we found that we can reach a PLQY of up to 79% and a linewidth of just 20 nm by controlling the crystal rigidity and electron-phonon interactions,” says Gong.
“The most rigid structure suppresses dynamic vibrations in the 2D perovskite crystals, which leads to decreased electron-phonon interactions,” Sargent tells Physics World. “This slows the electron band-edge to trap transition process, thereby increasing the brightness of the 2D perovskite emitter.
“Designing crystals structures with electron-phonon interactions in mind thus provides us with a previously unexplored way to improve the properties of optoelectronic materials,” he adds.
Barry Rand of Princeton University in the US says that the new work is an “impressive step forward. It shows that this class of layered perovskites has the capacity to host very high efficiency blue emission, a necessary milestone in their use in efficient LEDs. This is especially important as blue LEDs have lagged considerably behind the performance of red and green emitting devices.”
Sargent and colleagues, reporting their research in Nature Materials , worked with large single crystals with dimensions of millimetres in this work. They say they now plan to move to 100-nm-thick active materials so that they can indeed incorporate them into LED devices.