Earlier this year, I was at a reception for science journalists at the Fenway Park baseball stadium in Boston, US, when I bumped into Jens Wilkinson, who works in the communications team at RIKEN – one of Japan’s biggest research institutions. He encouraged me to visit the lab, which was founded 100 years ago, should I ever find myself in Japan.
And so here I was at RIKEN’s headquarters in Wako, just north of Tokyo, on day two of my trip to gather material for the upcoming Physics World special report on Japan. Wako is home to the largest of RIKEN’s seven campuses, which together employ almost 2000 researchers.
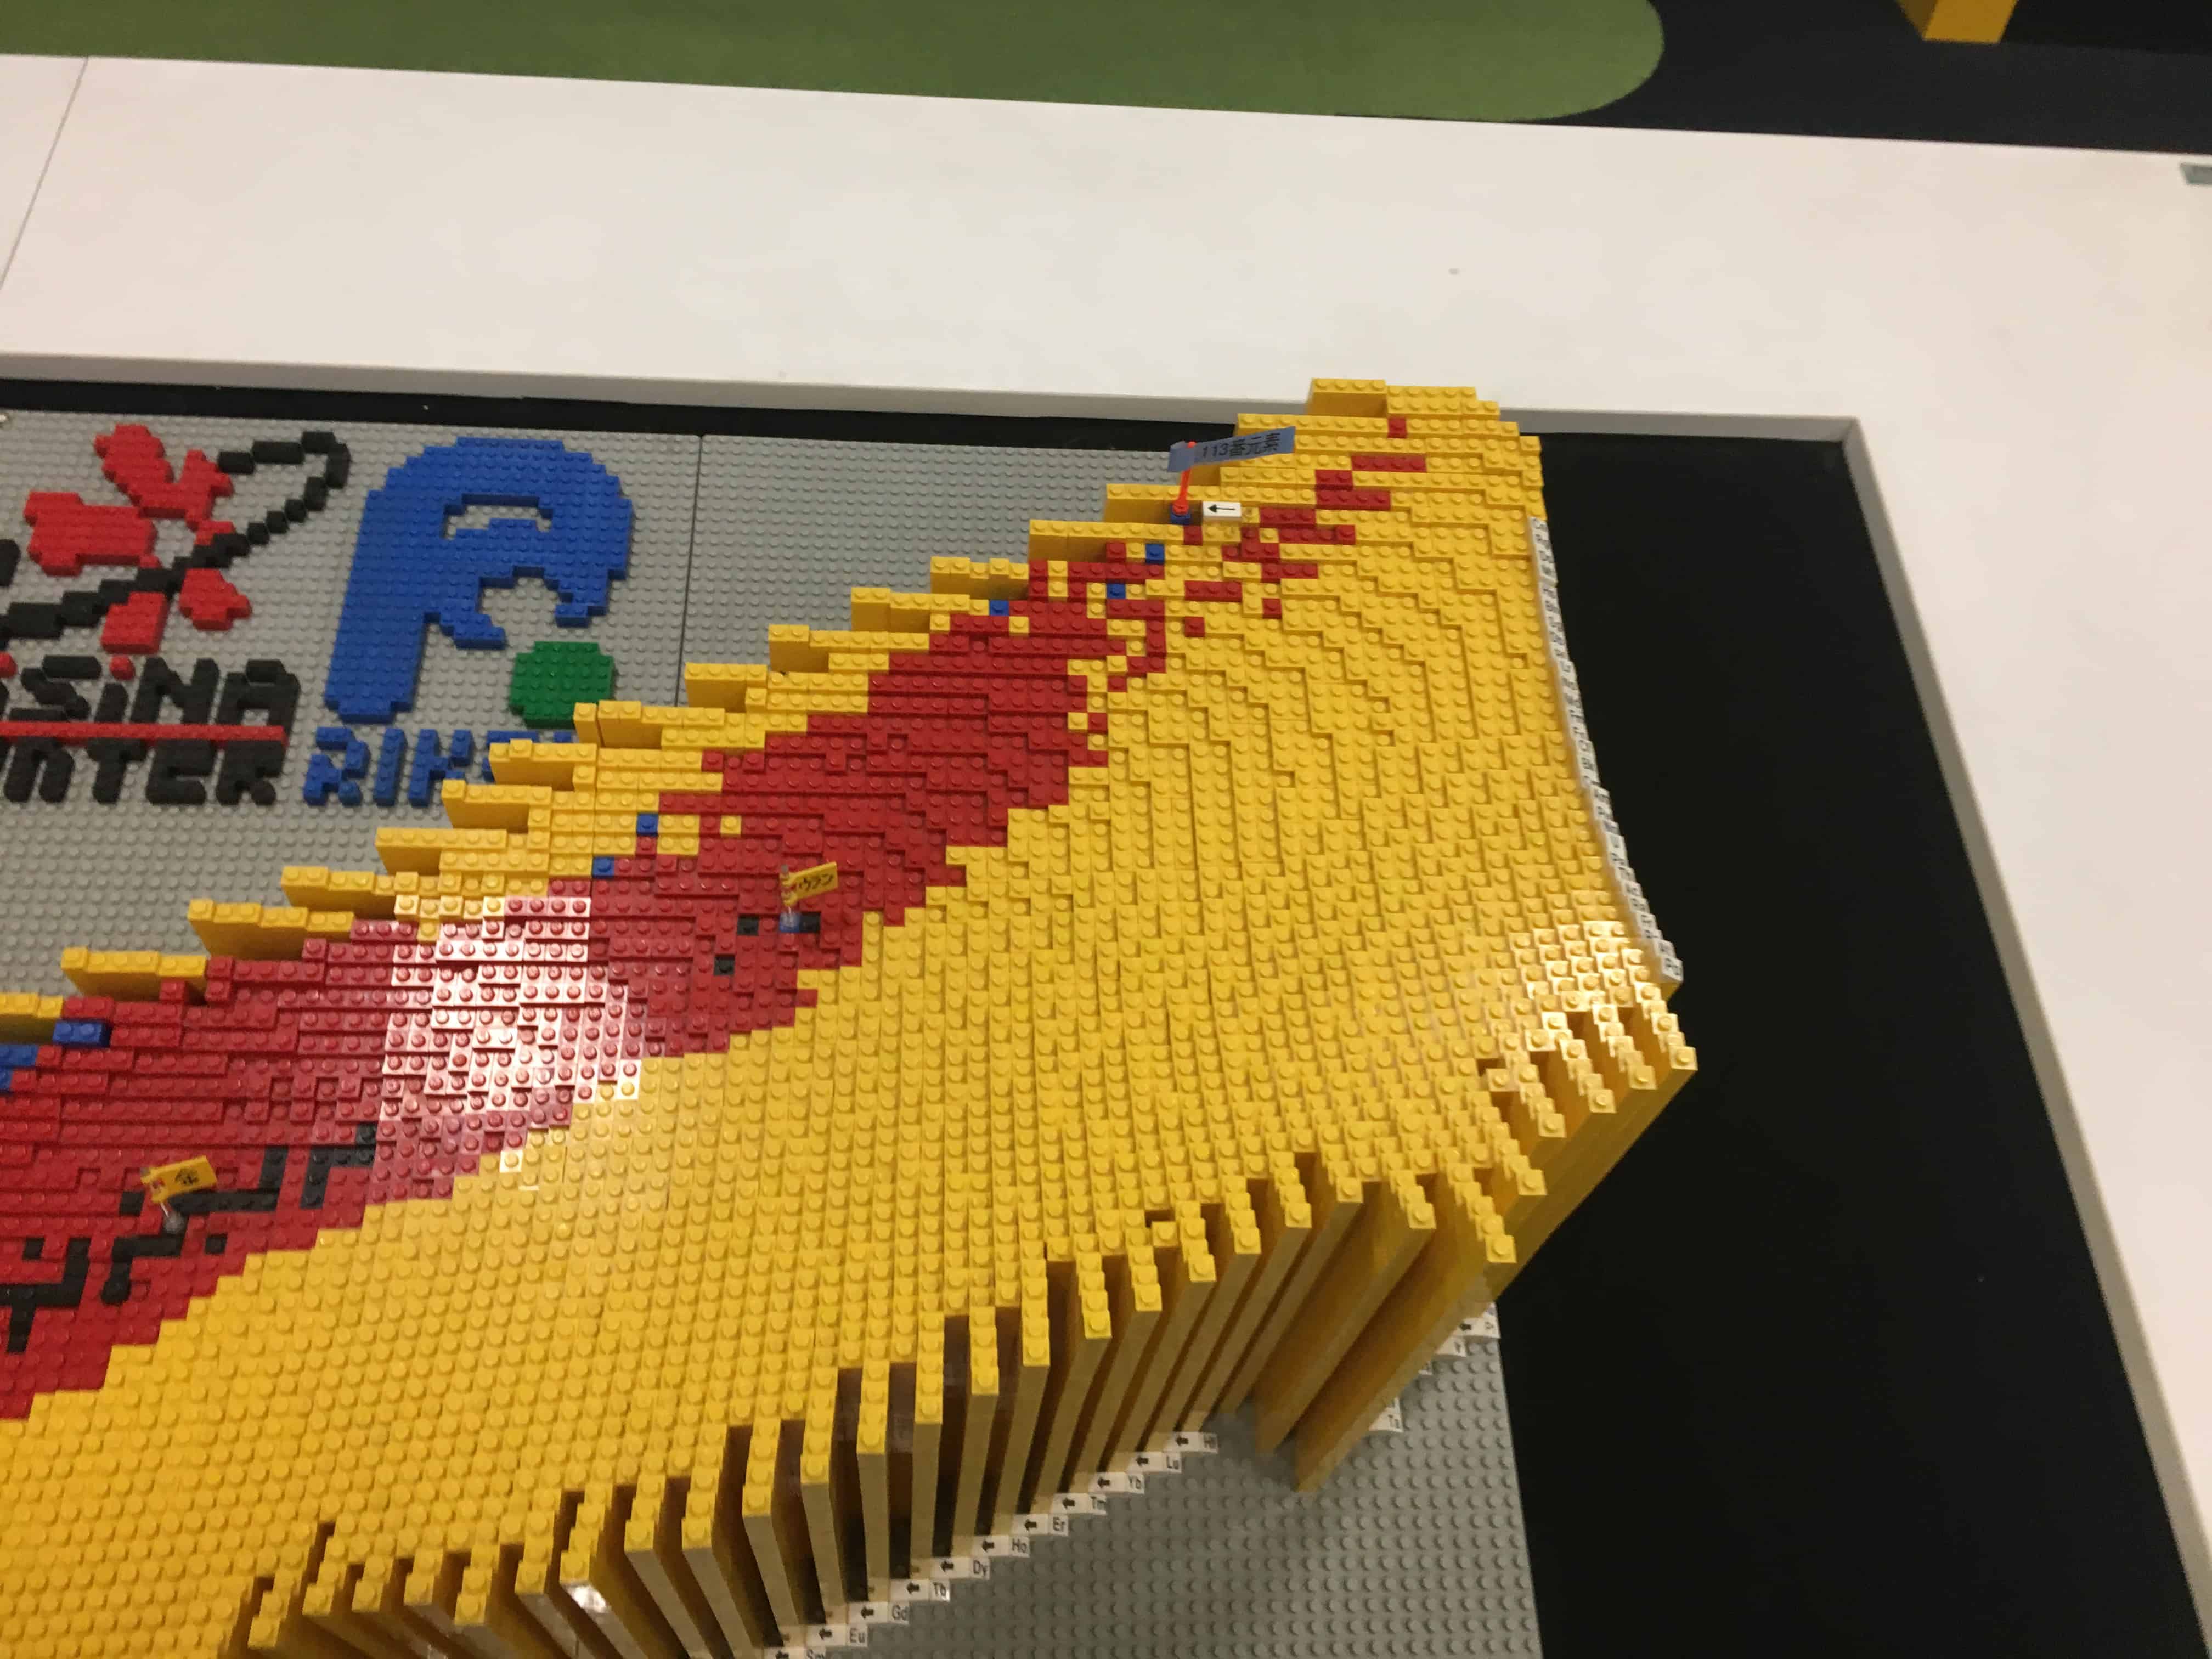
Block by block: a LEGO model at RIKEN of the classic radionucleide chart, which shows stable and unstable nuclei on a plot of protons versus neutrons. (Courtesy: Matin Durrani)
As Kouji Morimoto from RIKEN’s research group for superheavy elements explained to me, nihonium’s name comes from “Nihon” – one of two alternative names for Japan, both of which mean “land of the rising Sun”. The other name – “Nippon” – was not allowed to be given to the new element as it had been used by the Japanese researcher Masataka Ogawa in 1908 to describe an element with an atomic mass of 43 that he thought he’d discovered. Unfortunately, what Ogawa had actually found was what we now call rhenium, which has an atomic mass of 75. And because “nipponium” had been previously used in error, the rules stated it couldn’t be used again. So nihonium it was.
You can see it on the close-up of the LEGO model (right) picked out with a tiny flag.
Putting down a marker: a tiny flag identifies nihonium on the LEGO model at RIKEN.
Naming the element was the least of the RIKEN team’s worries. As Morimoto pointed out, creating nihonium was a huge feat, given that zinc and bismuth nuclei fuse just once in a 100 trillion collisions in their lab. In fact, the experiment took 500 days of beam time and even then the team created just three solitary atoms of nihonium.
Now if you think this kind of research has no relevance to everyday life, you’re wrong. Hiromitsu Haba, who leads RIKEN’s RI applications research group, described how the radioactive isotopes created at its Radioactive Ion Beam Factory (RIBF) are used in everything from pharmaceuticals and industry to engineering and medicine.
One isotope in particular – astatine-211 – is shipped to researchers across Japan who want to see if it can be used to treat cancer. Astatine-211 releases alpha particles with energies that are good at killing tumours, while leaving surrounding tissue more intact than rival beta-particle-emitting radioisotopes.
Tasty stuff: the sake brewed with yeast developed at RIKEN. (Courtesy: Matin Durrani)
Haba also mentioned another interesting application of RIKEN’s heavy-ion beams, which is to breed a new kind of yeast that’s been used to create a special kind of sake rice wine. Three types of sake are brewed using the new yeast and have been on sale since 2011. I wonder if they were served to the emperor at RIKEN’s centenary celebrations? It’s one question I forgot to ask…
An international team of researchers has developed a new high-resolution x-ray Compton scattering method to visualize the perturbation of redox orbitals in energy-storage materials. The new spectroscopic descriptor would allow the creation of high-performance batteries used in smartphones, laptops and electric cars.
The scientists used high-resolution x-ray Compton scattering profiling to image the redox orbitals since it can provide precise momentum space images. Measuring Compton profiles with Li content maps the evolution of reduction-oxidation (redox) orbitals involved in lithiation/delithiation of battery materials. The novel method helps unravel the mechanism of redox reactions that drive batteries, opening a spectroscopic gateway for improving the material’s performance.
Preparing the orbital camera: Compton profiling of FePO4
Compton profiles are related to a 2D integral of the electron momentum density (EMD). These are obtained by measuring Compton scattering spectra along different directions of the x-ray scattering vector, and have the same symmetry as the charge density.
The researchers chose lithium iron phosphate (LFP), an olivine family member, as a model material to perform the spectroscopic measurements due its potential as a high-performance cathode material and its intricate delithiation process. This is present as two phases: fully lithiated, LFP, and the delithiated, FePO4.
The experimental Compton profile difference (ΔJ) of the delithiated compound (FePO4) was compared with theoretical Compton profiles. Theoretical profiles were calculated based on three different models of the delithiation process: rigid band model (same as LFP), rigid FeO6 octahedral and relaxed FeO6octahedral.
The experimental ΔJ matched the relaxed FeO6 model, reflecting the oxidation of the Fe2+ to Fe3+ and modification of the Fe-O bond. Such distortion can be highlighted by subtracting the Compton profiles of the relaxed octahedron from the rigid, resulting in a distortion profile, D(p).
“Taking pictures” of redox orbitals
By theoretically calculating the 2D EMD differences of LFP and FePO4, the researchers mapped the modification of the 3D orbitals due to the distortion of the Fe-O bond in the three different models considered. The momentum maps of the redox orbital show how the perturbation of the short-range structure of the materials can produce a localization of the states in different regions of the momentum space. The relaxed octahedral model 2D EMD exhibits the most localization at low momenta, highlighting the importance of the octahedral relaxation on delithiation.
Evaluation of the potential shift
The distortion profile, D(p), also provides information about the loss of the redox potential or potential shift, ΔV, caused by structural perturbation. These distortion profiles, D(p), can be used as descriptors to evaluate voltage shifts so that the energy density of cathodes can be enhanced. The relaxed octahedral model exhibits a potential shift ∆V = –0.62V compared with the rigid model.
Distortion profiles were also derived for Mn, Co and Ni substituted LFPs. Mn introduction increases this potential shift, whereas Co and Ni can reduce it. The results suggest that the strain and octahedral distortions caused by Fe substitution can improve the energy density of pure LFP.
Compton scattering: decoding the mechanism of potential shift
The work was carried out by an international team of researchers from the United States, Japan, Belgium and Poland. The effort was led by Arun Bansil, University Distinguished Professor of Physics at Northeastern University (Boston) with team members Hasnain Hafiz and Bernardo Barbiellini. Compton scattering experiments were performed at the SPring-8 synchrotron light source in Japan led by Yoshiharu Sakurai (JASRRI) with team members Kosuke Suzuki, Yuki Orikasa, Masayoshi Itou, Kentaro Yamamoto, Ryota Yamada, Yoshiharu Uchimoto and Hiroshi Sakurai. Other scientists involved were Vincent Callewaert (Belgium) and Staszek Kaprzyk (Poland). The study was published in the August 23 issue of the journal Science Advances.
The scientists have developed comprehensive theoretical and experimental spectroscopic descriptors that provide a way to decipher the mechanism of lithiation/delithiation and potential shifts in batteries. Compton and distortion profiles offer a quantitative method to observe the changes in momentum space caused by modification of the crystal structure between electron orbitals of transition metals and oxygen.
The newly developed spectroscopic approach allows us to gain a molecular-level understanding of the relationship between structural distortion, potential shifts and metal substitution on working battery materials. Thus, with this novel method, the group of researchers has tremendously contributed to the material science community with one of the many tools needed for deriving the structural-activity relationships of working battery materials to enhance their performance. Their work proves that data derived from the interaction of photons with materials and clever mathematical ways to interpret and process such data can lead us to see what was thought to be blind to the human eye: electronic orbitals.
A new Quantum Technologies Innovation Centre (QTIC) will be built by the University of Bristol, UK, at a cost of £43m. According to the university, the centre will allow more than 200 academic researchers to work in partnership with industry. QTIC will focus on the development of a range of quantum technologies including secure quantum communications, quantum sensing, quantum simulators and quantum computers.
“QTIC is the world’s first dedicated open access innovation centre facility for developing a broad spectrum of quantum technologies,” says Mustafa Rampuri, who is programme manager for the centre. He adds that the centre will provide “pay-as-you-go incubator labs and office space, access to state of the art equipment, supported by experts in a range of business, technology and manufacturing areas”.
Talent academy
The centre is scheduled to open in 2021 on a site near Bristol’s Temple Meads railway station. It will include a “talent academy”, which will support a range of students – from apprentice technicians to PhD level engineers.
£15m of the money for QTIC will come from the West of England Local Enterprise Partnership and £7m from the University of Bristol. The remaining £21m has been secured from industrial partners including Airbus Defence and Space and Boeing Defence UK.
Supply chain
Paolo Bianco, research and technology co-operation manager at Airbus, says: “We are looking forward to working with QTIC and the University of Bristol on quantum topics to support and establish a supply chain for these technologies, essential for our future ability to bring quantum enhanced platforms to market”.
Smaller companies involved with QTIC include Canada’s D-Wave Systems, which describes itself as “the world’s first quantum computing company”, and KETS Quantum Security. KETS makes systems for quantum cryptography and was founded in 2016 by Chris Erven, Phil Sibson and Jake Kennard of the University of Bristol.
Two independent experiments have verified that the radioactive nucleus nickel-78 is “doubly magic”, as predicted by the nuclear shell model. The nucleus contains 28 protons and 50 neutrons, which makes it an ideal candidate to test whether shell model applies to nuclei with relatively large numbers of neutrons.
In 1949 Maria Goeppert-Mayer pointed out that nuclei with “magic numbers” of protons or neutrons (2, 8, 20, 28, 50, 82 and 126) were more stable than others. This led to the development of the nuclear shell model, for which Goeppert-Mayer shared the 1963 Nobel Prize for Physics. The idea behind the model is that protons and neutrons fill nuclear orbitals in analogy to how electrons fill orbitals in atoms. When a nucleus has a magic number of neutrons, for example, its outer shell of orbitals is completely filled by neutrons. There are relatively large energy gaps between shells and this means that it is difficult to move a neutron from the full shell into the next empty shell – making the nucleus relatively stable.
Perturbed orbitals
Nickel-78 should be doubly magic because it has full proton and neutron outer shells. Protons and neutrons are different particles, and therefore occupy different orbitals. However, they feel each other’s presence via the strong force and this can perturb the orbitals so much that the shell model breaks down and new magic numbers emerge. This is known to occur in some nuclei that have high ratios of neutrons to protons.
Now, international teams working independently at the ISOLDE facility at CERN in Switzerland and the Radioactive Ion Beam Factory (RIBF) in Tokyo have gained important insights into nickel-78 by studying the copper-79 nucleus, which has an extra proton.
Mass measurements
The RIBF team did spectroscopic measurements of copper-79 nuclei in an excited energy state. Their results allowed them to conclude that copper-79 is best described as having one proton in the next shell above the closed 28-proton shell – thus confirming the shell model. The ISOLDE team took a very different approach and made precise measurements of the masses of the copper isotopes copper-75 to copper-79. This allowed them to conclude that copper-79 is best described as a doubly-magic nickel-78 nucleus with one proton in the next shell.
Located on the University of Tokyo’s Kashiwa campus, the institute held a big celebration that was attended by hundreds of researchers including Nobel prize winners. The occasion was even marked by the creation of a bespoke sweet (see image below right).
Marking the occasion.
Building an institute from scratch is no easy task, but in such a short time it has gone on to be one of the leading centres in the world.
That is thanks to its unique approach where astronomers, mathematicians and physicists come together all under one roof to tackle five fundamental questions about the universe: how it began? What is it made of? What is its fate? What are its fundamental laws? And why do we exist in it?
Today I met with IPMU director Hitoshi Murayama, who outlined his plans for the coming decade.
The IPMU is part of Japan’s World Premier International Research Center Initiative (WPI), which began in 2007 with the creation of IMPU and four other institutes. The programme was initiated to attract foreign researchers and also reform the university system in Japan, which many complained was too rigid.
In both regards the IPMU has been a roaring success. The WPI mandates that around 30% of an institute’s researchers come from abroad. But the IPMU instead has around 50%. “It just happened like that,” says Muryama. “But I think that having an equal percentage of Japanese to non-Japanese also makes people from abroad feel more comfortable.”
The IPMU’s 140 researchers publish around 450 papers each year and around 60% of them have international coauthors. This compares to about 10% of papers for most Japanese universities.
Murayama spends around half his time at the University of California, Berkeley. He said that when he began the IPMU he was the only one at the university to hold such a joint position with a foreign institution. Now there are 72. “Initially, I was an anomaly,” he says.
The institute doesn’t just cover theory. It has its owns labs and one project that the IPMU is heavily involved in is LiteBIRD. This is a space-based mission that will attempt to detect B-mode polarization of the cosmic microwave background.
Costing $300m, researchers are hopeful that it will be approved next year by the government with a possible launch slated for 2025.
Indeed, a sign of the IPMU’s collaborative nature is apparent at the daily 3pm “tea time” meeting in which researchers come together to discuss what they are working on and hopefully foster collaborations. Murayama showed me examples of where such discussions have not only led to ideas being exchanged but new avenues of research.
He will be hoping that the next 10 years brings more of the same.
Researchers in the US and the Netherlands have observed auditory responses in the human somatosensory cortex, a region of the brain usually dedicated to processing touch. They measured functional MRI (fMRI) signal changes following a frequency discrimination task, and used multi-variate pattern analysis to validate the results. This finding adds to the growing body of research that challenges the view of sensory-specific cortices, providing valuable insight into cross-modal representations in the brain (Cerebral Cortex 10.1093/cercor/bhx255).
Multisensory processing in the brain is undisputed. What remains an open question, however, is the specificity of responses to one type of stimulation, for example sound, in regions outside of its classically-defined cortical region. Previous research has investigated somatosensory responses (tactile processing) in auditory cortex (sound processing) (J. Neurophysiology88 540). Here, the researchers identified populations of neurons in the somatosensory cortex that preferentially responded to sound.
RSA analysis.
The authors, from Baylor College of Medicine, had two questions: “Does auditory stimulation elicit a specific response in the somatosensory cortex?” and “Do perceptions of sounds correlate with voxel patterns in the somatosensory cortex?” In the scanner, participants listened to sound bursts of the same frequency, intermingled with “oddball” frequencies. Participants also performed a sound-similarity rating task, outside the scanner.
Data analysis
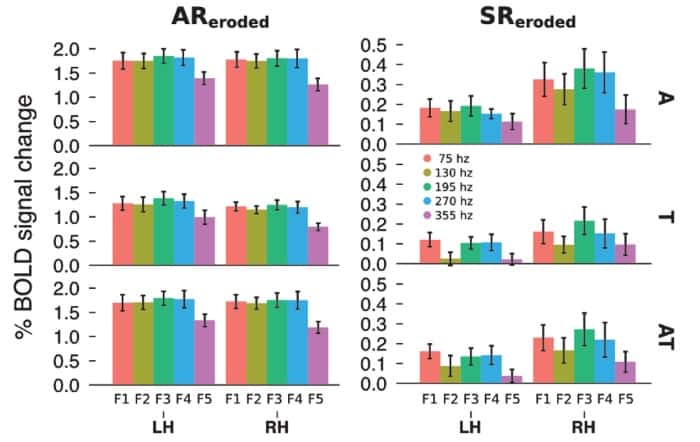
In addition to measuring the BOLD (blood oxygenation level dependent) signal using fMRI, the authors also used a technique known as “representational similarity analysis” (RSA) to characterize the relationship between different frequencies in each cortex, by looking at the activation patterns across multiple voxels. For two different frequencies, for example 75 and 355 Hz, the patterns should be dissimilar. The researchers also applied this method to the offline perceptual rating task.
‘The BOLD signal varied with frequency in the somatosensory cortex, indicating that the responses were beyond spurious noise. RSA confirmed the similarity of similar frequency responses, both in auditory and somatosensory cortices, although the signals were slightly noisier in the latter. This also correlated with the ratings that participants gave offline.
Variations in auditory and somatosensory brain regions.
Key implications
These results indicate that auditory processing is not restricted to the auditory cortex and partially occurs in the region of the brain typically associated with touch. Interestingly, the study also shows that sounds that participants rated as being more similar had similar effects on the somatosensory cortex.
As with most brain research, this work opens the door to several exciting questions, such as to what extent do the auditory-specific populations of neurons in somatosensory cortex encode frequency information? And could the responses be topographically organized?
Studies like these are key to unfurling the complex functional organization of our brain, improving our understanding of sensory responses and how they are encoded. A future investigation by the authors will flip this study around, detailing the effect that touch can have on the auditory cortex.
Writing a popular-science book about animal biophysics is hard work. Authors must read through hundreds of research papers as the subject is so multidisciplinary, and they are unlikely to be experts in the field, which is probably why the thermodynamics of the garter snake or the bite force of the Komodo dragon are not things you would study at school. Indeed, to write this type of popular book, authors must seek out experts in the various fields that contribute to animal biophysics, and then get their heads around the latest research topics that are as arcane and varied as electric-eel batteries and mammal bladder-evacuation time (which is, no matter the size of the animal, usually around 21 seconds, in case you were wondering).
Suffice to say that there is a steep learning curve. I vividly recall my co-author Alan McFadzean saying “You do realize, don’t you Mark, that we will both be doing the equivalent of a Master’s degree every three months for the next year and a half?” as we were about to embark on our own book on this subject. Finally, there is the small matter of sifting and organizing this seething mass of applied physics (and biology and chemistry) and pitching it at the appropriate level for your intended reader.
On both counts of research and writing, Matin Durrani and Liz Kalaugher have done a good to excellent job with their book Furry Logic: the Physics of Animal Life. The beating heart of this type of book is the description of recent advances in the field, which ideally have yielded surprising or amazing insights, and that were previously unknown beyond a small number of professionals. From their main text and acknowledgements, it is clear that Durrani and Kalaugher heard straight from the mouths of many horses – they questioned many a research zoologist on many an obscure subject. For the most part, the resulting descriptions in the book are clear and interesting. If animal biophysics turns your crank, then the stories in the book will engage you from start to finish and you may find it difficult to put it down, even to perform the more mundane, though pressing aspects, of day-to-day biophysics such as eating.
Durrani and Kalaugher both work for IOP Publishing, which publishes Physics World, and have PhDs in physics and materials science respectively. Durrani has been the magazine’s editor for the past 11 years, while Kalaugher has covered environmental science for 10 years. They were inspired to write this book by a 2012 special issue of Physics World on “animal physics”.
Furry Logic is divided into six chapters that relate to six branches of physics – heat, forces, fluid dynamics, acoustics, electricity and magnetism, and light. Each chapter includes the tales of anywhere between four and eight individual animals that use the aforementioned physical phenomena in some way, shape or form. These sections within a chapter are loosely ordered under a pithy subheading, and for the most part this organization succeeds – though occasionally I wished for a more layered structure to make a clearer division between topics. The book’s conclusion is more reflective than the main text, briefly discussing the role of physics in animal structure and capabilities, as well as the reverse: the application of our understanding of animal physics to human technology.
The authors cover a wide range of recent biophysics research on mammals, insects, fish, cephalopods, birds and amphibians. With one or two brief exceptions, they have resisted the temptation to include humans in their list of amazing animals – this is probably wise. (Enough has been written about how special we are.) Their descriptions usually end with a satisfactory conclusion in that the research they report has resulted in new understanding.
Elephants hearing through their feet is a good case in point: an interesting, even astonishing, capability that researchers are only now beginning to appreciate, and which is reported gleefully and clearly in this book. Sometimes we are given a little more depth and historical research, if it provides an interesting backdrop. The broad subject matter makes for something of a scattergun approach – for example, chapter four, which deals with sound, covers everything from peacocks and bats to snakes and elephants to lobsters – but it works.
The level of presentation, with descriptions rather than deep explanations, is suitable for readers with a high-school science background.
The book does not include a bibliography, which is a pity, as it would have helped those of us who would have liked to further pursue a particular story – say that of octopus intelligence, which is highly developed (unusually so for asocial animals, as the authors point out). Sometimes I was left hanging in mid-air, like the bees whose mode of flight is covered in one of the best sections of the book. Maybe the authors could include a bibliography in a second edition.
The light and breezy style makes for easy reading. North American readers will not mind the British-English words and phrases (leg it, nosh, choppers, hanky, lugholes, crisps…) though some may grimace at the good, bad and truly awful puns and wordplay. But this is a minor quibble; the style aids readability without clouding the underlying physics. Furry Logic is a good book for anyone who is curious about the inner workings of snakes, dogs, mosquitoes, bees, ground squirrels, beetles, bats, moths, Komodo dragons, hornets, rattlesnakes, geckos, mantis shrimps, cats, seahorses, bees, peacocks, elephants, lobsters, electric eels, loggerhead turtles, ants, cuckoos, octopods or archerfish.
Matin Durrani and Liz Kalaugher Furry Logic: the Physics of Animal Life 2016/2017 Bloomsbury Sigma £16.99/$27.00hb; £9.99/$17.00pb 304pp
It’s a classic undergraduate physics question: i) write down an expression for the acceleration of a solid cylinder placed on an inclined surface and ii) using the parameters given, calculate the length of time the cylinder takes to travel 2 m. But when you’re on the back deck of a ship in stormy seas, watching the grub screw you’ve just dropped zoom off towards the edge of the deck and wondering if the ship will roll back before the screw is lost in the ocean forever, gratitude for your physics education isn’t really dominating your thoughts.
There’s a good reason that there’s a gap running right around the deck of every ship at floor level – it means that any ocean water that arrives over the side will quickly find its way back out. But when the ship is pitching and rolling, and gravity can’t be trusted to leave things where you put them, that gap is the ocean physicist’s black hole. Anything that goes through it certainly isn’t coming back.
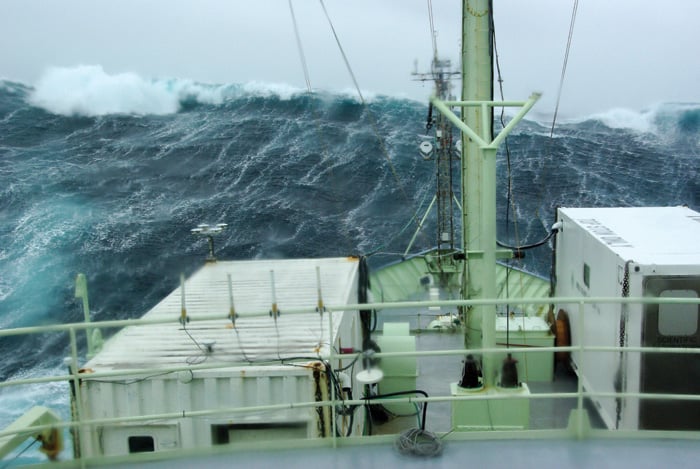
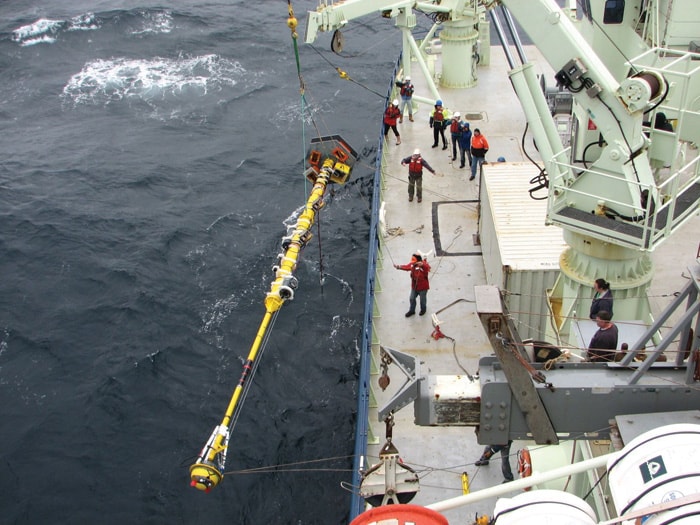
Chasing storms: the RV Knorr faced massive waves in conditions that are ideal for studying ocean bubbles, but not great if you get sea sick. (Courtesy: Ian Brooks)
The oceans are an engine – they take in energy from the Sun, mostly close to the equator, and redistribute it towards the poles. Playing their part in this massive engine, despite their comparatively insignificant size, are bubbles. I study these pockets of gas caused by breaking waves, and the best way to do that is to be out here, in amongst it all. I love working at sea with the rawness, practicality and teamwork that comes with it. Even in an age where giant servers are flooded with satellite data from above and remotely operated underwater vehicles and autonomous buoys roam the seas below, there’s still a place for a ship.
So here we are, in a glorified tin can, dangling instruments over the side on technologically advanced bits of string, because it’s the best way to see the sea. The plumes of bubbles beneath the surface and the foam patches on top are fleeting and still poorly understood, but we know that they matter. Seafarers have looked out at stormy seas for centuries, but it’s only in the past few decades that we have started to understand even the first metre of water beneath the surface. It’s hard to get to, but fascinating to study.
Life on board a research ship is full of reminders that we take a lot for granted on land. At sea, there are nights when we lie awake listening to the thumping from the lab above as the ship rolls, wondering whether our most expensive equipment is playing pinball on the lab floor. We can spend an hour replacing one broken component, because we have to strap down or put away every single tool, screw and container as soon as we let go of it. And we have to chase the water around the shower cubicle as the ship rocks, because “down” is everywhere apart from where you’re standing. But it’s worth working here, bobbing about on the vast boundary between the water and air, because we have access to the heart of Earth’s engine. And even the boundary itself has a huge story to tell.
The lumpy bumpy ocean
You can think of the top of the ocean as a sheet, a 2D surface that never smoothly follows the ellipsoidal shape of the planet. On the very largest scales, the sheet bulges where dense mountain ranges above and below the water surface exert a strong gravitational pull. The great ice sheet of Antarctica also draws water towards itself – it’s thought that as it melts, the bulging water will slosh back northwards, making sea level rise more significant in the northern hemisphere. Trade winds and general ocean circulation are associated with sea surface height anomalies of a metre or so, enough to monitor ocean currents using space-based altimeters. Tides can cause half a metre or so of change in the open ocean, but up to 15 m near some coastlines. Even the low atmospheric pressure in the centre of a large rotating storm causes a bulge in the ocean surface that’s perhaps half a metre in height. Oceans are lumpy bumpy places, although the bumps are sometimes too big for us to see.
But the surface waves are different, because they’re the strongest physical link between the atmosphere and the ocean. Local winds push on the ocean surface, transferring momentum and energy, and generating waves. This is the process of building “wind-sea” – steep waves of different sizes caused by the current conditions. As the wind speed increases, and waves are pushed for a longer time period, over a greater distance, they keep growing in size. The energy in the waves continues to increase until energy loss mechanisms catch up, provide some balance and stop the waves growing. Beyond a wind speed of about 5–10 m/s, a large part of that energy loss comes in the form of wave breaking and the turbulent dissipation that goes along with it. When breaking eventually happens, the wave peaks topple over the front face of the wave, and the 2D surface reconnects with itself, trapping gas inside as it does so.
Life is the bubbles: Helen Czerski working on her buoy while trying not to lose equipment to the rolling sea. (Courtesy: Helen Czerski)
This is the origin of almost all ocean bubbles, and the foam patch we see at the surface (known as a whitecap) is only a small part of the story. Beneath the surface, these small trapped pockets of the atmosphere have a complex existence: some travel downwards for many metres and last for many minutes, and some last for less than a second before rejoining the atmosphere.
Each individual bubble is a tiny object in a vast ocean, but together they influence the upper ocean in four main ways. First, bubbles strongly affect ocean acoustics because air is so much more compressible than water – they generate sound when they form and scatter sound afterwards. Second, bubbles change the colour and transparency of the ocean because they scatter light. Third, they act as small vehicles transporting gases through the ocean surface in both directions. Fourth, if they rise to the surface and burst, they spit tiny liquid droplets up into the sky. The aerosol particles formed in this way scatter light (sometimes causing haze) and may drift high enough to act as cloud condensation nuclei.
All this means that the existence of this simple object has complex consequences: a bubble, after all, is just a trapped pocket of air. But before you can understand all that complexity, you have to know how many bubbles there are and what they’re up to, and even that is tricky.
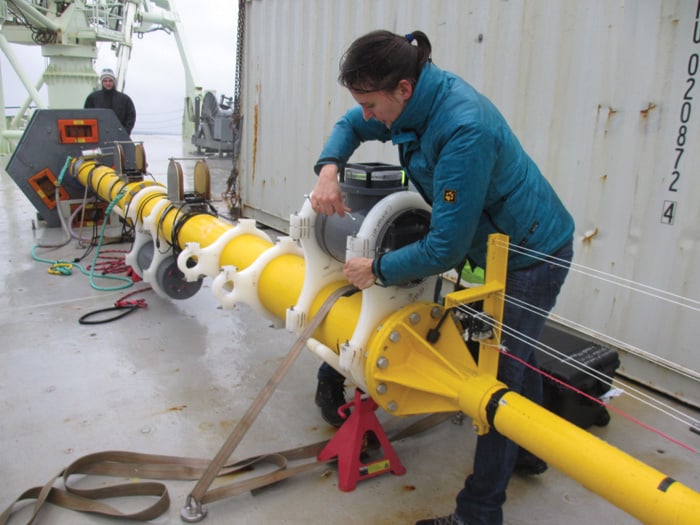
Big yellow buoy: the 11 m-long buoy holding specialized cameras, acoustical resonators and sonar being carefully lowered off the RV Knorr for a stormy session detecting bubbles in the waves. (Courtesy: Helen Czerski)
When stormy seas are ideal The last time I was at sea, in the autumn of 2013, we were in the North Atlantic during storm season. Our main focus was air–sea gas transfer: watching the ocean breathe. About 30% of all the extra CO2 that humans are putting up into the atmosphere ends up in the ocean, largely because it’s soluble and if you increase the concentration gradient, more will dissolve. There’s a constant global exchange of CO2 between atmosphere and ocean, but in the North Atlantic storm season, it’s mostly from the air into the water. Our expedition was funded to test current understanding of different gases moving through the ocean surface, and how that depends on wind speed, wave state, bubbles, the water conditions and the weather, with a specific focus on CO2.
Our home for six weeks was an American vessel, the R/V Knorr, famous in oceanographic circles for being the ship that first sighted the submerged wreck of the Titanic in 1985. The strategy was simple: we would position ourselves in the path of as many storms as we could find, park the ship with its bow into the wind, and ride out each storm while measuring the gigantic gas exchange processes going on around us. And we got lucky – the weather co-operated with enthusiasm.
One of my defining memories of that trip is the chief scientist bouncing into breakfast on a day when very few people were bouncing anywhere, clutching the doorway as the ship rolled around him and delightedly reminding everyone about the average wind speed that morning: “65 knots, gusting up to 70!”. That’s about 120–130 km/h for anyone who likes metric units, and immensely awful for anyone who likes a peaceful life.
Plumes: even shallow spilling breakers produce a significant number of bubbles. (Courtesy: Helen Czerski)
But I was happy too – I’d come to sea to measure bubbles, and bubbles there certainly were. It looked as though the surface of the ocean was blowing away, and under the foam, you could see the huge subsurface bubble plumes. My only worry was about whether my bubble detectors were working properly, but there was nothing I could do about it. They were floating freely away from the ship, on a big yellow buoy, left to their own devices until the storm was over.
The journey of a bubble
There’s no universal method for measuring bubbles at sea, and that’s because the important mechanisms operate over about six orders of magnitude in time (0.1 ms – 100 s) and five in space (0.1 mm – 10 m). Just after a wave breaks, any large bubbles around are smashed apart by the strong turbulence underneath the breaking wave. For the first second, the shear stress associated with the turbulence stretches and distorts the new air pockets, and any bubbles larger than about a millimetre in size are likely to fragment. Bubbles smaller than that will probably remain intact, because surface tension reduces bubble distortion.
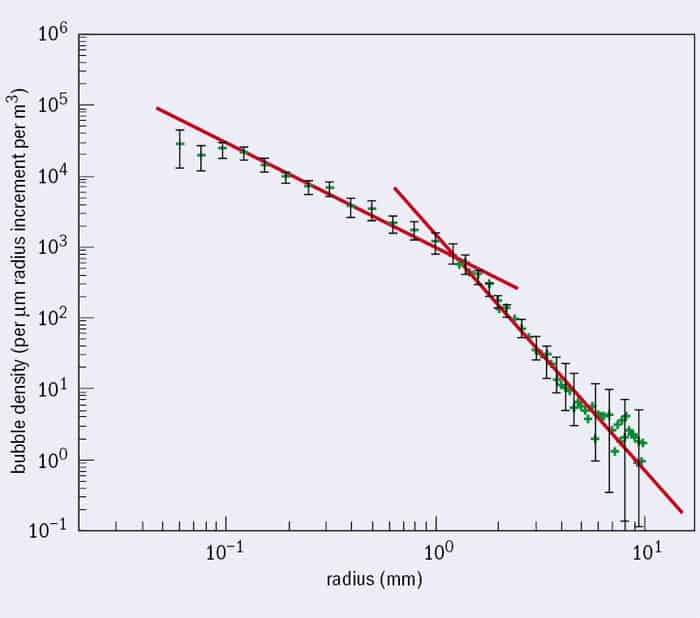
The process of fragmentation is still poorly understood, but it leaves behind a bubble population with a very specific size distribution (figure 1), first identified by Grant Deane and Dale Stokes from the Scripps Institution of Oceanography in San Diego, US, in 2002. There’s a kink in the slope – bubbles larger than about a millimetre are formed by the fragmentation cascade, but the smaller ones have a different size distribution. Those are probably formed by thin sheets of air breaking up into thousands of tiny bubbles – what’s known as “Mesler entrainment”.
1 Bubble size distribution Bubble size distribution as estimated from about 225 images of 14 breaking waves during their acoustic phase. The kink in the slope is caused by different bubble-formation processes. Bubbles larger than about a millimetre are formed by fragmentation cascade, while smaller ones are probably formed by thin sheets of air breaking up into thousands of tiny bubbles. (Adapted by permission from Macmillan Publishers Ltd: Nature418 839, copyright 2002)
The turbulence dissipates quickly, and from now on, the game is just to follow what happens to this initial population. One second after the wave breaks, these bubbles are what you’ve got – the bubbles won’t break apart or join together after the intense turbulence has finished. Ocean bubbles have the odd characteristic of not coalescing – they tend to bounce off each other instead. We’re not entirely clear why this is the case but it’s to do with charge distribution on their surface. This is why you see white foam patches on the ocean but not on freshwater lakes – in the lake, bubbles join together, rise and burst very quickly, leaving no trace. But in the salty ocean, bubbles stay separate and last long enough to form foam.
The fate of the initial bubble population varies. The bigger bubbles will rise quickly to the surface, form those foam patches and burst. The smaller bubbles are just carried along with the water flow, perhaps reaching several metres in depth (the deepest bubble plumes recorded have been during hurricanes, extending around 25 m). They exchange gases in both directions across their surface – especially important for less soluble gases such as oxygen – and are likely to dissolve completely, although a few may find their way back to the surface.
Bubble watching
So when it comes to following all this, apart from the practical difficulties caused by the storm, you need a variety of measurement strategies just to detect the bubbles. For the big bubbles in the young plume, you need high-speed photography to follow them being smashed apart. For the deeper plumes, we use acoustics because bubbles scatter sound in a way that depends on their size. Small-scale acoustic resonators can measure the bubbles in a volume perhaps 20 cm across, while upward-pointing sonar gives you a view of the entire bubble plume shape, usually many metres wide.
This is the combination that I had on the Knorr – a specialized camera 2 m below the surface, acoustical resonators to measure bubble size distributions 4 and 6 m down, and a sonar right at the bottom, 8 m below, looking up towards the surface. On other expeditions, novel optical techniques such as holography, light scattering and diffraction have also played a role. They’ve got the side benefit of providing unexpectedly beautiful pictures of nearby zooplankton, but they’re still limited in the range of bubbles they can measure. The icing on the cake of difficulty is that the detectors for these fragile and fleeting tiny bubbles have to withstand being thumped by (literally) tonnes of ocean.
Tiny but massive: small ocean bubbles play an important global role. (Courtesy: Helen Czerski)
But we’re learning. We know that the biggest bubbles probably stay in the top metre or two, and that these are the most important vehicles for CO2 transfer into the ocean. We’re starting to separate out the effects of turbulence stirring the water and the bubbles themselves, when it comes to how gases are transferred across the surface. We know that bubbles probably don’t matter very much at all for some gases (like dimethylsulphide) and matter a lot for others (CO2). We are getting better at detecting the fraction of ocean covered in whitecaps from satellite images, and connecting this to our knowledge of what’s happening at the surface. We’re starting to understand how to build accurate mathematical models of gas transfer and aerosol production, and to feed this approach into weather and climate models.
There are still huge gaps in our knowledge, though. We still know very little about the structure of bubble plumes, and how they vary as the ocean conditions change. Getting to sea in a ship with enough auxiliary measurements to make sense of the bubble data is a rare treat, and there have only been a handful of research cruises dedicated to understanding these processes.
The single biggest unknown in this field is the effect of natural ocean surfactants: general crud in the water (that word isn’t as facetious as it sounds – it’s commonly called gelbstoff, the German for “yellow stuff”). The surface ocean is full of gel particles, long-chain carbohydrates, lipids, proteins, dust, bacteria, viruses and fragments of anything that has been chucked out by single-celled organisms or broken down from larger components. All of these will stick to bubbles, stabilizing them.
They’ll also be spat upwards in aerosol particles, adding to the diverse particulate population in the atmosphere. But this aspect of ocean chemistry is frustratingly fickle and often varies over tens of metres. If you ask an ocean chemist about the organic material in the water sample you’ve just presented them with, they’ll make a face, suck in their cheeks, and tell you in no uncertain terms that it’s complicated. But when it comes to how long bubbles last, what they transport and how they interact, that chemistry matters. The last few years have seen much better techniques for sampling these surfactants at sea, and I’m hopeful that it will all look a lot less mysterious 10 years from now.
A tapestry of sciences
The oceans feel a very long way from most of us, but the more we learn about it, the more we appreciate how interconnected this giant engine is. Its biology, physics and chemistry are woven together, and even the details like the surface bubbles have a significant role to play. Our current focus is on improving our understanding of the way that this engine works right now, and we’re still only just getting to grips with the basic mechanisms at work.
But models based on this understanding are going to become increasingly important in the future. The ocean currently acts as a huge sink for anthropogenic CO2, but it’s not clear that it will continue to do so at the same rate in the future. Having accurate models of CO2 transport that are based on tested physical mechanisms will make a huge difference to our ability to predict future changes. The aerosols produced by bubbles affect cloud formation, and as ocean biology changes, the aerosols may too. As the extent of summer sea ice in the Arctic Ocean continues to reduce, that newly open ocean will start to see more breaking waves and bubbles, and more aerosol production.
But how will that affect the weather near the pole, and what consequences will it have for those of us living at lower latitudes? A single bubble is a tiny and insignificant entity, but all the oceans of the world produce enough bubbles to influence a planet. Understanding how and why is going to help us manage the interaction between our civilization and our planet. The legions of lost grub screws, abandoned and lonely on the deep ocean floor, are a small price to pay.
This morning I took the train to the Tokyo Institute of Technology, which lies about 10 km south-west of Tokyo.
I met with Hideo Hosono who rose to fame almost a decade ago when he found a new class of superconductors known as iron pnictides.
In a 2008 paper, Hosono and colleagues discovered superconductivity in LaOFeAs at 26 K. The crystalline material comprises layers of lanthanum and oxygen sandwiched between layers of iron and arsenic — and is doped with fluoride ions.
It opened up a new avenue of research in superconductivity – a topic that was getting rather stagnant following the excitement of the cuprate materials in the late 1980s.
While the structure of iron-based superconductors was already published, nothing was known about their physical properties. While Hosono admits that it was initially tricky to synthesis such materials he always thought that they would exhibit superconductivity.
Indeed, the discovery led to a flurry of research including the claim of superconductivity exceeding 100 K in single layers of FeSe films on doped strontium titanate substrates.
Yet despite almost a decade of effort, Hosono says there is more that needs to be done. “There is still interesting physics in these systems that needs to be worked out,” he says. “[Iron-based superconductors] have turned out to be much more complex than the cuprates.”
So what does the future hold for superconductivity with no new materials on the horizon? “If I could predict the future I would,” he says. “But it is impossible to predict what might come next.”
Whatever that might be, the next breakthrough is likely to come from China, which Hosono says is aggressively pursuing research in this area at the expense of the US and Europe where funding is limited.
On top of his research in superconductivity, Hosono has made breakthroughs in other areas too. This includes thin-film transistors (TFT) that can be used in organic light-emitting diodes (OLEDs). He showed me an OLED TV (see image above) that was made with a TFT material he pioneered – indium gallium zinc oxide. Indeed, multiple firms are producing TVs with this material including LG, Samsung and Sony.
So does he have such a TV at home? “I have an LCD,” he says. “I am waiting for the price of OLED TVs to come down before I buy.”
There may still be a glimmer of hope for achieving the most ambitious warming target of 1.5 °C but it requires dramatic strengthening of current pledges. Modelling projections from both the US and a University of Oxford, UK, partnership indicate that meeting the Paris Agreement goal of “well-below 2 °C” means deep near-term curtailing of carbon dioxide and short-lived “super-pollutants”, as well as some degree of atmospheric carbon removal.
Veerabhadran Ramanathan of the Scripps Institute of Oceanography, US, and Yangyang Xu, now at Texas A&M University, focused on the top 1-in-20 low-probability, high impact (LPHI) model outcomes often ignored by other studies. This required a new “unknown” category for climate risk above 5 °C, including existential threats to humanity and widespread species extinctions associated with temperatures not seen on Earth for at least 20 million years.
Avoiding “dangerous” warming, greater than 1.5 °C, is not possible without aggressive fossil fuel reductions and an immediate curtailing of super-pollutants, the authors stress. These include methane, hydrofluorocarbons (HFCs), tropospheric ozone and black carbon, and are already subject to independent regulation due to their impacts on human health.
If global emissions remain unchecked, there is a significant chance warming could reach catastrophic levels by mid-century. Under these conditions three-quarters of the worlds’ population could be exposed to deadly heat stress, and numerous tipping points in the climate system could be reached, bringing irreversible changes.
To stay below 1.5 °C, the Nature Geoscience study, led by Richard Millar, estimates a limit on cumulative global carbon dioxide emissions after 2015 of 200 Gigatonnes of carbon. This represents a marked increase from the IPCC Fifth Assessment Report, which suggested a ceiling of 615 GtC; the total burned already amounts to 545 GtC.
Xu and Ramanathan advised a 2060–70 target for global carbon neutrality, using both energy intensity reduction and decarbonization. This alone would yield a 50% chance of staying below 2°C of warming, avoiding likely catastrophic climate change.
Although the challenge is great, the authors of both studies emphasize that many of the technologies needed already exist. What’s more, a fall in emissions from both the US and China, as well as an increase in renewable energy production, contributed to a near-zero growth rate worldwide in 2015.
In PNAS, Xu and Ramanathan consider the implementation of carbon extraction and sequestration – essential to adequately mitigate LPHI warming. Many technologies are on the horizon, such as carbon capture from bioenergy, but none have been effectively scaled, and the authors warn that “major breakthroughs are needed”.
A complementary report delivered to the UN as part of Climate Week NYC 2017 expanded this “three-lever” mitigation strategy, along with a more detailed analysis of the implications for society. It was produced as part of a wider collaboration, the Committee to Prevent Extreme Climate Change, which Ramanathan chairs alongside Nobel Prize winner Mario Molina and Durwood Zaelke, who leads the Institute for Governance and Sustainable Development.