The best way to predict a good outcome for paediatric patients with osteosarcoma is by performing FDG-PET/CT scans at regular intervals in the first several months after the start of chemotherapy, according to a study published in the January issue of the Journal of Nuclear Medicine.
Researchers from several children’s hospitals and cancer research facilities found that routine images at weeks 5 and 10 and the percentage change in the maximum standardized uptake value (SUVmax) from baseline to week 10 were predictors of a favourable response to standard chemotherapy in combination with bevacizumab. The findings suggest that early changes in treatment regimens before surgical intervention could result in more favourable outcomes for patients.
Barry Shulkin
“This well-organized, clinical therapeutic study allowed us the opportunity to assess the usefulness of FDG-PET/CT imaging in patients with a single uncommon disease treated uniformly on a rigorous chemotherapy protocol and evaluated comprehensively at prospectively identified milestones during therapy,” said study co-author Barry Shulkin from the department of radiological sciences at St. Jude Children’s Research Hospital in Memphis, TN (J. Nucl. Med.59 25).
Osteosarcoma occurrences
While osteosarcoma is the most common primary bone malignancy in children, the disease is quite rare and accounts for only 0.1% of all tumours, according to one previous study. With curative options that include chemotherapy and surgical resection, the chances for long-term survival for these paediatric patients has improved.
As background to this study, the researchers, led by Najat Daw, a paediatric oncologist at MD Anderson Cancer Center in Houston, have been developing a new chemotherapeutic approach to osteosarcoma, incorporating the antiangiogenic agent bevacizumab, which has been used for other paediatric cancers.
“Our molecular imaging group has been particularly interested in evaluating the utility of metabolic imaging in multiple tumour types in children, adolescents and young adults,” Shulkin wrote in an email to AuntMinnie.com. “The challenge was to identify a role for FDG-PET/CT imaging in the evaluation and management of patients with osteosarcoma, if one exists.”
In the study, the researchers prospectively enrolled 34 consecutive patients (median age, 12.2 years; range, 6.8-19.1 years) with newly diagnosed, high-grade, biopsy-proven localized or metastatic osteosarcoma between June 2008 and May 2012.
The 17 male and 17 female subjects initially underwent evaluation with chest CT, MRI and X-rays of the tumour bed. In addition, whole-body FDG-PET/CT (Discovery LightSpeed, GE Healthcare) was performed to create a baseline, with follow-up scans at five and 10 weeks after the start of chemotherapy. Primary tumours were then resected during the 10th week.
Chemotherapy included cisplatin and doxorubicin at the start of the sessions and five weeks later, along with high-dose methotrexate at the third, fourth, eighth and ninth weeks. Bevacizumab was administered three days before the first dose of chemotherapy and then on the first day of the third and fifth weeks of chemotherapy.
The most common locations for the primary tumours were the femur (17 cases, 50%), tibia (nine cases, 26%), and humerus (five cases, 15%). Twenty-five patients (74%) had nonmetastatic osteosarcoma, while the other nine (26%) had metastatic disease at diagnosis.
SUVmax stats
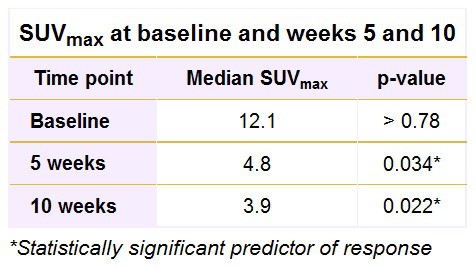
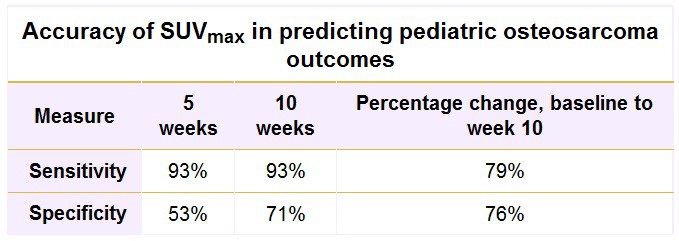
SUVmax proved to be a significant predictor of outcomes at week 5 after the start of chemotherapy and again at week 10. At baseline, SUVmax, however, was not a contributing factor to a patient’s outcome. Paediatric patients with a higher SUVmax at week 5 or week 10 were less likely to respond favourably to chemotherapy.
Consequently, the percentage change in SUVmax from baseline to week 5 (60%, p < 0.001) and from baseline to week 10 (68%, p = 0.021) both significantly predicted a response to treatment. Paediatric patients with a larger percentage decrease in SUVmax were more likely to respond to treatment.
The researchers also calculated receiver operating characteristic (ROC) curves for SUVmax at five and 10 weeks and based on the percentage change from baseline to week 10. Optimum cutoff points for SUVmax were 4.04 at week 5 and 3.15 at week 10, along with a 60.24% decrease from baseline at week 10. Based on those values, the SUVmax parameters achieved high sensitivity.
Regarding negative predictive value, SUVmax at 10 weeks (92%) and the percentage change from baseline to week 10 (81%) were also high.
As for overall survival at a median follow-up time of 3.6 years, 24 (70%) of the 34 patients were still alive. Sixteen patients (47%) experienced adverse events, which included disease relapse, progression, a second malignancy or death from any cause.
Event-free survival
The researchers did not find statistically significant associations between event-free survival and SUVmax at baseline, week 5 (p = 0.11), or week 10 (p = 0.12). There also was no significant association between event-free survival and changes in SUVmax from baseline to weeks 5 or 10 or between event-free survival and percentage changes in SUVmax from baseline to weeks 5 or 10.
“The reason may be the small sample size; statistical significance may become apparent with larger numbers of subjects,” the authors wrote.
Based on the influence of SUVmax and the timing of FDG-PET/CT scans, Shulkin and colleagues are developing a new protocol for the treatment of osteosarcoma. “We intend to perform FDG-PET/CT imaging earlier than in the previous study to further explore the time course of chemotherapy in relation to cell killing,” he said.
The researchers also plan to work with colleagues from the University of Wisconsin to perform a radiomic analysis of the scans.
“We want to determine if nonstandard analyses requiring high computational capacities will reveal additional information about these tumours and their response to therapy,” Shulkin said. “In addition, we are planning to evaluate other radiotracers, principally carbon-11 methionine, for their ability to characterize these tumours for pathways that suggest susceptibility to chemotherapeutic agents not yet studied in osteosarcoma.”
Physicists in Japan say they have a solution to a problem that has puzzled particle physicists for nearly two decades – the anomalous magnetic moment of the muon.
Measurements made over several years at the at the g-2 experimentat the US’s Brookhaven National Laboratory suggest that the muon magnetic moment is significantly larger than predicted by the Standard Model of particle physics. After careful analysis of data related to the decay of the muon to an electron, the statistical significance of this discrepancy is at 3.6σ – which means that it is extremely unlikely to be a fluke.
Beyond the Standard Model
One possible explanation is that particles not described by the Standard Model are involved in the muon decay, and their presence affects the measured value of the muon magnetic moment. Finding evidence for such particles would be a colossal achievement, which is why the new Muon g-2 experiment at Fermilab is gathering data this year.
Now, however, Takahiro Morishima of Nagoya University and Toshifumi Futamase of Kyoto Sangyo University have come up with an alternative explanation of the anomaly. In three preprints uploaded to the arXiv server, the duo calculate that effects due the curvature of space-time could result in an increase in the measured value of the magnetic moment. This effect of general relativity is related to the gravitational field of the Earth.
Muons, but not electrons
While the same physics applies to the electron (which does not have a similar magnetic anomaly), Morishima and Futamase say that the effect does not lead to a boost in the measured magnetic moment of the electron.
The three preprints have not yet been peer reviewed but have already caused a stir on some physics blogs. Particle physicist Tommaso Dorigo writes: “The idea that classical gravitational effects affect its value in a way quite consistent with the observed departure is extremely surprising and exhilarating”.
Mathematical physicist Peter Woit writes, “This sort of calculation needs to be checked by other experts in the field, and provides an excellent example of where you want good peer review”. He adds, “If this is right, it’s a fantastic example of our understanding of fundamental physics at work, with the Muon g-2 experiments measuring something they weren’t even looking for, a subtle effect of general relativity”.
Update: The mathematical physicist Matt Visser of Victoria University of Wellington in New Zealand has posted a preprint to arXiv in which he argues that the effect claimed by the Japanese physicists cannot explain the anomalous muon magnetic moment. Visser says that the Japanese physicists have made an error in their implementation of the Einstein equivalence principle of general relativity. His own calculation suggests that the effect is far too small to explain the muon anomaly.
The ability to replicate the functionality of the human body is the ambitious aim of a lot of robotics research. However, with around 240 mechanical receptors per square centimetre in a human fingertip, reproducing the touch sensitivity of skin poses significant challenges. Wenzhuo Wu from Purdue University in the US told attendees of innoLAE 2018 how they had not just matched the number of receptors per square centimetre, but exceeded it by a factor of more than 20.
Zinc oxide nanowires have attracted a great deal of attention for their piezotronic properties, which modulates electronic transport directly by means of mechanical inputs. The fundamental principle of piezotronics was introduced by Zhong Lin Wang at Georgia Institute of Technology in 2007. The challenge for Wu and colleagues was to fabricate an array of individually addressable nanowire devices that might exploit this piezotronic response and collectively function as smart skin.
As well as drawing on his expertise in understanding and controlling the growth process to ensure well aligned nanowires and uniform height, Wu described how they also adopted a two-terminal device structure. “We remove the gate electrode,” said Wu, describing what they call a “piezotronic transistor”. Previously nanowire transistors have been fabricated using a wrap-around gate on each nanowire, however the piezotronic transistor has only two terminals. “It can be directly controlled by mechanical signals, so that these mechanical signals – like pressure and strain – function essentially as the gate controlling signal to modulate the transport,” adds Wu. “We think it is a powerful design especially for human machine interfacing.”
He and his colleagues in Wang’s team at Georgia Tech produced a device that can detect its own shape change using an array of these strain-gated vertical piezotronic transistors on a flexible polyethylene terephthalate (PET) substrate at a device density of 8464 devices per square centimetre – more than 20 times that of human finger tips. Wu also completed related work for tactile imaging during his PhD research in Wang’s group at Georgia Tech.
The researchers are now looking into how 2D material devices can function as strain-gated transistors. Other groups have looked at graphene, but Wu, in collaboration with his postdoc mentor Wang at Georgia Tech, has investigated single-atomic-layer MoS2, reporting on how the piezophototronic effect in the material may be used for strain-gated flexible optoelectronics back in 2016.
Speaking to nanotechweb.org after his presentation, Wu added, “I think currently there has been a huge amount of fantastic work exploring the fundamental science and concepts of all materials, but in order for the entire community to push it forward and make something impactful for society we must come up with an economic approach or platforms to integrate those nanomaterials holistically into designed structures as pre-designed.” He added, “You need to integrate them at large scale at very low cost so that you can truly make use of the new science and fundamental phenomenon, so manufacturing is I think the next big question.”
Ultrafine aerosol particles smaller than 50 nm in size produced by human activities were previously thought to be too small to affect cloud formation but they do in fact fuel powerful storms and influence weather. This is the new result from an international team of scientists led by Jiwen Fan of Pacific Northwest National Laboratory in the US.
Ultrafine aerosol particles can come from vehicles, industrial processes and wildfire, among other sources. Until now, scientists believed that only relatively large aerosol particles (generally larger than 100 nm) played an important role in the formation of thunderstorm-causing clouds (also known as deep convective cloud systems or DCCs). Fan and colleagues’ work has now turned this idea on its head. It has also revealed that nano-sized particles can in fact “invigorate” storm clouds in a much more powerful way than larger particles.
The researchers obtained their result using a unique data set from the US Department of Energy’s GoAmazon campaign and analysed how ultrafine particles less than 50 nm in size affect thunderstorms in the Amazon rainforest. The study looked at data from an area of the Amazon that is pristine except for the region around Manaus, which is the largest city in the forest (with a population of around two million). Manaus produces a pollution plume that generally follows the northeasterly trade winds and is an important source of particles less than 50 nm in size.
Manaus City
“One of the main difficulties that scientists encounter when studying aerosol-cloud interactions is separating the effect of aerosols themselves from the impact of natural meteorological factors, such as wind, temperature and humidity,” explains Fan. “Because we analysed data for the thunderstorm cases that occurred in a very similar meteorological environment but a varying aerosol environment, we have been able to pinpoint for the first time that the observed storm intensification in this area is mainly caused by ultrafine aerosol particles and not by other factors.”
“The large impact of ultrafine aerosol particles indicates that human activities can drastically boost the power of storms over warm and humid regions, which include tropical and some subtropical areas,” she tells nanotechweb.org. “It also implies that from pre-industrial times to the present day, human activity, such as urbanization and industry may have significantly influenced storm formation in these regions.”
Clouds begin to form as atmospheric moisture condenses around airborne particles, such as aerosols, but when larger particles are not present high up in a warm, humid environment (which is the situation in the region studied in our work), ultrafine particles can then act and form cloud droplets instead, she explains. Although these particles are tiny, there are lots of them and they can form many small droplets on which excess water vapour condenses. This enhanced condensation releases more heat, which in turn makes updrafts much more powerful.
“As a consequence, more warm air is then pulled into the clouds, lifting more droplets higher up into the atmosphere, ultimately allowing clouds to produce more ice and snow pellets, lightning and rain. This newly discovered mechanism, in which the smallest of particles deeply stir convective processes, is much more powerful than the previously proposed mechanism of freezing of droplets in upper levels of the atmosphere for large particles.”
The finding may be a general one, says Fan, and could apply to all other warm and humid regions in the tropics and subtropics. “Ultrafine particles introduced by human activities in these regions could change thunderstorm and precipitation here too. Indeed, a very recent study found increased lightning storms over shipping lanes in the equatorial Indian ocean, where such particles are produced.”
The team, reporting its work in Science DOI: 10.1126/science.aan8461 says that it is now studying how other storm systems might be impacted by human activities and wildfires.
Superconductivity – when a material has zero electrical resistance, therefore zero energy loss, at low temperatures – has enormous potential for energy-efficient electronic devices. A research team in Beijing has now changed thin tin films from insulating to superconducting by tuning the thickness, introducing a level of versatility that could revolutionize the production of microelectronic circuits.
Observations of superconductivity in 2–20 atomic layers of “grey” tin , came as a surprise even to Qi-Kun Xue – whose expertise is focused on this area of research – as well as his team at Tsinghua University, Beijing. Tin occurs in two crystallographic forms in nature – white and grey – and previously only white tin had shown superconducting properties. Single-layer and bulk grey tin remain non-superconducting, so Xue and colleagues found they were able to tune grey tin’s properties from an insulating monolayer to superconducting in a few layers through substrate engineering.
A potential application of the discovery is building highly efficient microchips from a single material. The superconducting wires made of multilayers can be separated by regions of insulating monolayers on the surface of a microchip. Using a single material has advantages for production, and can also improve reliability by reducing interfaces.
In addition, the researchers discovered that the thickness of the lead-tellurium alloy on which the tin layer was grown changed the temperature at which the tin film became superconducting. This allows for extra control over the superconducting state.
The lab at Tsinghua University
Tin pest has its advantages
Grey α-tin is arranged the same way as the carbon-based diamond, while white β-tin has a crystal structure like most other metals. Below 13 °C, white tin slowly transforms to grey tin. “This caused some notorious troubles in the past and the process is termed as tin pest or tin disease,” says Ding Zhang, corresponding author. “What we found is that the grey tin can be scientifically quite interesting.”
Although not observed by Xue, Zhang and colleagues, monolayers of grey tin – called stanene from the Latin name for tin – are also predicted to carry dissipationless spin-polarized current, bringing extreme energy efficiency to new types of digital magnetic memory. Stanene films do not require any protection layer on top because it is resistant to oxidation. Grey tin could also be an ideal system to study interactions between spin-polarized currents and superconductors.
Their next steps are to gain more understanding of the superconducting stanene before investigating applications.
Adam Micolich talks to Physics World about both the quantum and classical side of nanowires that have made them such an interesting area for research, as well as the outlook for the field as the main challenges move from material discovery to applications.
Adam Micolich is an associate professor in the Nanoelectronics Group in the Department of Condensed Matter Physics at the University of New South Wales in Australia. His research specializes in the electronic properties of nanoscale devices, encompassing semiconductor nanoelectronics, quantum devices, ion-implanted plastics as novel conducting materials. Interesting side-topics include the fractal analysis of artwork by Jackson Pollock.
Micolich studied for his BSc and PhD at the University of New South Wales before beginning work there in 2001. He has over 95 refereed research publications in areas ranging from physics to education research, and has recently co-edited a book on nanotechnology research in Australia. He was a member of the Management Committee of the Australian Research Council Nanotechnology Network (ARCNN – now ANN, Australian Nanotechnology Network) 2004-2015, and served on the Editorial Advisory Board for IOP’s Journal of Physics: Condensed Matter until 2016, and is currently on the on the Editorial Advisory Board of Scientific Reports.
He joined Philippe Caroff from the Australian National University and Ming Li from Peking University on Nanotechnology’s focus collection: Inorganic Nanowires for Device Applications, which was completed in December 2017.
Currently there are around 70 operational proton therapy centres worldwide, with a similar number under construction. The original centres required large-scale infrastructures with particle accelerators and large gantries, but smaller "single-room" options are starting to appear. In addition, medical physicists are seeking ways to track precisely the location of proton-beam deposition in real-time, which is important because anatomies change slightly during treatment sessions. Parodi describes one solution being developed by her group, which involves attaching transducers to patients to track acoustic waves generated by the thermal expansion of tissues during treatment sessions.
The principle of this ionoacoustic monitoring was first demonstrated in the 1990s, but interest is increasing due to recent advances in proton beam technologies including the so-called "pencil beams" that can scan tumours with a high degree of precision. One of the really promising aspects is that it could in principle be combined with ultrasound imaging, enabling medical professionals to image the proton beams and the patient anatomy simultaneously. Parodi speaks about the next steps required to translate this research from the lab to a clinical setting. She also believes it is becoming increasingly important for medical physicists to develop a more fundamental understanding of biological processes.
This video is the second in a three-part series profiling pioneering medical physicists. Last week's video featured Bas Raaymakers from UC Utrecht speaking about using magnetic resonance imaging (MRI) alongside radiotherapy. Look out for the final instalment of the series next week. Each video features a medical physicist from the board of Physics in Medicine & Biology, a journal published by IOP Publishing, which also publishes Physics World.
A new wireless optoelectronic photometer comprising an ultrathin flexible injectable probe containing light sources, photodetectors and a miniature power supply could be used to record neural activity in animals as they go about their daily activities. The new device is very different from the cumbersome and movement-restricting fibre-optical-waveguide systems in use today and records fluorescence signals associated with the flux of calcium ions in neurons – for example, in the basolateral amygdala, a deep-brain structure involved in processing emotions.
One of the main goals of neuroscience today is to better understand the connection between neuronal processes and behaviour. Most techniques today to monitor neuronal activity in the brain rely on detecting the fluorescence from genetically-encoded calcium “indicators” (GECIs) in neurons. The problem is that these often rely on using bulky fibre-optical waveguides that are placed on an animal’s head and which prevent it from moving around normally.
A team of researchers led by John Rogers of Northwestern University in the US has now developed an alternative compact photometry system for recording fluorescence signals from deep within the brain. The device contains an ultrathin flexible and lightweight injectable probe containing components for stimulating the brain with light and then recording the fluorescence from the GECIs in neurons. These signals are then sent wirelessly to a receiver, and a detachable transponder, control unit and miniature power supply are also included in the device.
Very thin probe
The technique employed by the researchers is a relatively new one known as optogenetics, which uses light to control and monitor the behaviour of cells in living tissue, usually neurons, that have been genetically modified (using proteins) to become sensitive to light. It has revolutionized neuroscience in recent years, since researchers can now study how neurons behave in real time.
“In our study, we created cellular-scale blue light-emitting diodes and photodetectors and mounted these on thin, filamentary polymer probes that we could insert in the brain,” explains Rogers. “The injectable part of the probe has a maximum thickness of just 150 microns, which minimizes damage to tissue. An ultra-miniaturized wireless control and data communication unit mounted on the head of the animal being studied (primarily mice in our case) allows us to record fluorescence signals correlating to the level of brain activity in a region of interest.”
Mice are less stressed
An essential aspect of the technology is that it is light and there are no trailing electrical wires that can get in the way of the animal. What is more, the devices allow for simultaneous recording from several animals at the same time, which will help in better understanding complex behaviour associated with social interactions, for example.
Rogers and colleagues measured fluorescence signals associated with GECIs in the basolateral amygdala of mice and say that the results they obtained are on a par with those obtained using traditional fibre-optics systems. Calcium-ion flux in neurons is directly related to neuronal activity and the basolateral amygdala is an important region of the brain for processing emotional information. It is especially active in rodents when they are afraid or anxious. As a bonus, the researchers say that the animals in their experiments were less stressed compared to those connected to a traditional fibre-optic system.
Towards more advanced, battery-free systems
“Our wireless system allows us to perform neuroscientific studies that are simply impossible with the type of fibre-optic systems available today,” Rogers tells nanotechweb.org. “Such studies include social interactions and natural movements in realistic 3D environmental enclosures.”
The team, reporting its work in PNAS doi.org/10.1073/pnas.1718721115 says that it is now busy building advanced, battery-free systems that are even smaller and so can be implanted directly under the skin. “We are also integrating other kinds of functionalities, such as electrical sensing and simulation, optogenetics and fluidic delivery, on the same platform,” explains Rogers.
“For instance, adding red LEDs to the injectable probe would allow for simultaneous optogenetic stimulation with redshifted channelrhodopsins (molecules that can be remotely activated with light) and calcium-ion recording from dopaminergic neurons in the ventral tegmental area. This could allow us to study behaviour such as the reward response in animals.”
Nicholas Ouellette likes midges. Yes, these tiny flies are infuriating and can bite, but Ouellette, who’s a physicist by training, is intrigued by how and why these insects form giant swarms, sometimes thousands strong. We know the swarms are composed entirely of male midges, which have long antennae and beat their wings at nearly twice the frequency of the females. Attracted by the high-pitched sounds, the females fly towards the swarm in the hope of reproducing, which makes swarming an elaborate midge-mating ritual.
The sensitivity of midges to sound was allegedly discovered by a Finnish ecologist in the 1960s while out walking in the woods. As he sang local folk songs, the ecologist noticed swarms of these flies being irresistibly drawn into his path, seemingly by the sound of his voice. Ouellette knew, however, that he’d need something more scientific than singing folk songs if he was to study swarming using sound. He therefore got one of the postdocs in his lab at Stanford University – Rui Ni (now at Pennsylvania State University) – to track midges with a microphone and record the beating of their wings.
When Ni and Ouellette blasted the buzzing of swarming midges back at them through a loudspeaker, they noticed some unusual things. If they alternated the level of sound played back through the speaker – loud, soft, loud, soft – the region of highest midge density shifted with the change in volume. And when they played just the sound of a female through the speaker (you can easily spot the females as they lack antennae), the entire male swarm flew over and sat on it.
Fascinated by flocks
Ouellette is one of a growing number of scientists seeking to understand how such "collective behaviour" comes about. Having previously worked on pattern formation and coherent structures in fluid flows, Ouellette became fascinated by biological swarms after noting the unusual patterns formed by flocks of starlings in flight. "It looked to me like turbulence," he recalls, pointing to the large eddies that form in the Gulf Stream as an example of the phenomenon. "They dramatically appear out of the flow itself. So there must be some kind of mechanism that leads to the formation of these kinds of structures in animals."
But swarm scientists are still puzzling over how such a mechanism might work and whether there’s a set of universal laws dictating such collective behaviour across a wide range of biological systems. That’s the nagging question, because while flocking and swarming are common in nature, each species that exhibits such collective behaviour does so just a little bit differently. A flock of starlings, a swarm of midges or a group of fire ants linking together to form floating rafts, for instance, are not quite the same thing.
Even the terminology is woolly. "Many people use the words flocking and swarming interchangeably," admits Ouellette. "But since I work on both, I distinguish them by using ‘flocking’ to mean a group with net, ordered motion and ‘swarming’ to mean collective motion without any overall order or net motion. Much as I try, though, that’s still not standard usage." Nevertheless, Ouellette is convinced there is something universal about all these systems – some aspects that don’t depend on exactly which animal you are studying.
For Chad Topaz – an applied mathematician from Williams College in Massachusetts who works independently of Ouellette on models of locust swarms – it all boils down to three questions. What do the individuals do? What does the group do? And how are those two things related? "These are such simple questions, and yet they are very difficult to answer," Topaz says.
Gaining a better understanding of swarms is not just an intellectual challenge. It could also reap dividends for society by, for example, leading to improved crowd-management strategies for subways, concerts, rallies and other places where lots of people gather. Such work could in addition give scientists a unique approach to designing complex networks that are resistant to failure. An electric power grid, for example, can fail catastrophically if just a single pylon is down, while all it takes for planes to be delayed throughout the US is for a winter storm to knock out one key node in the airline industry’s hub-and-spoke flight network.
"We are not good as human beings at designing controlled and distributed systems," Ouellette admits. Nature, in contrast, seems to have solved this conundrum in flocks and swarms, which don’t have the same choke points. If a few birds fall out of formation as a big flock of starlings migrates, the overall dynamics do not change. There is no central node – no top-down mechanism – and yet a form of controlled order does emerge in such collective systems. "It’s bottom-up instead of top-down control," says Ouellette.
Swarm into action purlieu
Swarming research has been firmly in the wheelhouse of observational biologists for decades, when they would monitor swarm behaviour in the field and carefully write down their observations. It wasn’t until the 1980s, however, that computer graphics specialist Craig Reynolds developed what became the canonical computational model for collective behaviour: the so-called "boids program" – an agent-based simulation that gets its name from "bird-oid" (or "bird-like") objects. The program became a staple in Hollywood, being used to model the movement of groups of computer-generated bats in Tim Burton’s Batman Returns, as well as the movement of combatants in major battle scenes in the Lord of the Rings trilogy.
1 Model behaviour In 1986 the software engineer Craig Reynolds wrote a pioneering computer model of co-ordinated animal motion, such as bird flocks and fish schools, based on 3D computational geometry. He called the generic simulated flocking creatures boids, which is short for “bird-oid” (or “birdlike”) objects. The basic flocking model consists of three simple steering behaviours that describe how an individual boid (green triangle) moves based on the positions and velocities of nearby flock mates (blue triangles within the circle). The boids can (top) steer away to avoid crowding, (middle) steer towards the average heading of local flock mates to create alignment or (bottom) move towards the average position of local flock mates to create cohesion. The program was later used to model the movement of groups of computer-generated bats in various Hollywood films, including Batman Returns.
The basic concept is simple (figure 1). First, treat each individual in the swarm as a dot (or particle) initially moving in a straight line at constant speed. Then programme in a few simple rules governing interactions between those dots. For instance, if two dots move too close together, they must move apart to avoid colliding, but if the distance between them becomes too great, they must get nearer again. When the collection of dots becomes sufficiently dense, a flocking pattern will form. Tweak the rules, and a pattern emerges that resembles a swarm of midges or locusts. Yet another set of rules will give you a pattern similar to a raft of fire ants.
These kinds of models have dominated research into collective behaviour, but Ouellette thinks such an approach is insufficient – making an exact solution well-nigh impossible – given that such systems are highly nonlinear and have anywhere from several hundred to a billion moving parts. But even knowing which pair of variables have a nonlinear dependence isn’t clear since, as Ouellette puts it, "we don’t know what parameters matter in the first place". The bottom line is that the combined effect of all those individuals in a nonlinear system adds up to more than the just the sum of those parts. "You get something other than a simple average over their individual states."
Ouellette considers swarming a classic inverse problem. Scientists have collected huge amounts of data on flocks and swarms, and are now trying to work backward to ferret out the underlying rules. But even if you have the rules, it doesn’t mean you understand how animals behave. "You can say, if I make these modelling rules, it looks kind of like a flock of birds," explains Ouellette. "But there’s a very big divide between that statement and saying ‘Birds behave this way.’ "
His solution? A macroscale, big-picture approach that draws as much from thermodynamics and materials science as it does from particle modelling and statistical mechanics. "I’m starting from a stereotypical physicist’s approach: everything is probably the same stuff in an underlying way if you tease it apart and cast it in the right way," Ouellette says. But rather than turning to computational modelling, Ouellette instead works with actual midges, treating the swarm like a chunk of material – probing it by doing something to it and seeing how it reacts. As he points out: "You don’t test materials by observing them. You do something to the material and measure its response."
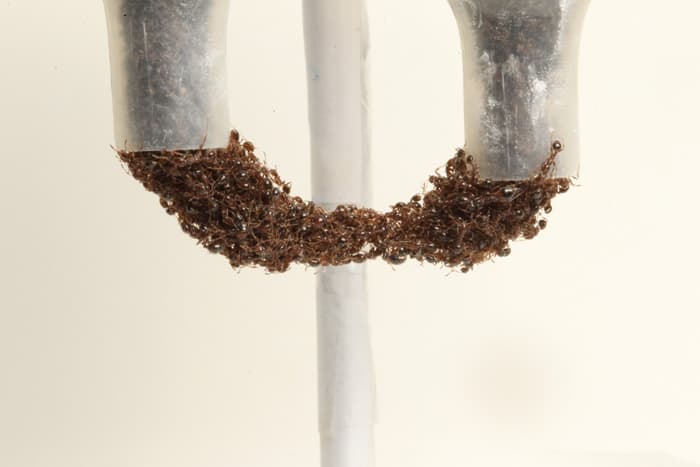
Joint effort: Fire ants work collectively in a group showing behaviour almost like a liquid. (Courtesy: Ant Laboratory, Georgia Institute of Technology)
It’s an approach shared in part by David Hu, a physicist at Georgia Tech in the US, whose lab is justly famous for its experiments with swarms of fire ants. The swarms, which can consist of 100 or more individuals, have both solid and liquid properties. By linking their bodies together, the ants form floating rafts, towers and other solid-like structures, but collectively they also flow like a fluid. One YouTube video from Hu’s lab even shows the ants pouring themselves out of a teapot into a teacup. The lab uses standard materials tools such as rheometers to apply various kinds of forces to the ant swarms to see how they collectively respond (Nature Mater. 15 54).
Midge master
In his lab, Ouellette works with small swarms of non-biting midges Chironomus riparius, which are an ideal choice from a physicist’s perspective as they are so simple. Lacking digestive systems, adult midges don’t eat and instead conserve all their energy for their swarmy mating rituals. What’s more, these particular midges don’t spread disease and, should they escape, they die within a few days.
They are also bred commercially in labs that provide customer support – a surprisingly useful feature if you’re a physicist like Ouellette who’d never dealt with living specimens before.
"The first couple of tries, I’d call them up and say, ‘Okay, everything died again, what did we do wrong this time?’ " he recalls. "And they’d say ‘Well, did you oxygenate the water?’ Because little things like that matter." Eventually, Ouellette mastered the art of breeding his midges, and his experiments began in earnest. Since swarming is triggered by light, he’s fixed up a lamp that switches on automatically for an hour twice a day. Each time the light flicks on, gangs of 25–30 midges swarm for the full hour until it turns off again. "It’s a really robust system," says Ouellette. "Twice a day we get swarms." Pieces of black cloth simulate the terrestrial features that midges like to swarm over, such as stumps or tree roots or small pools of water.
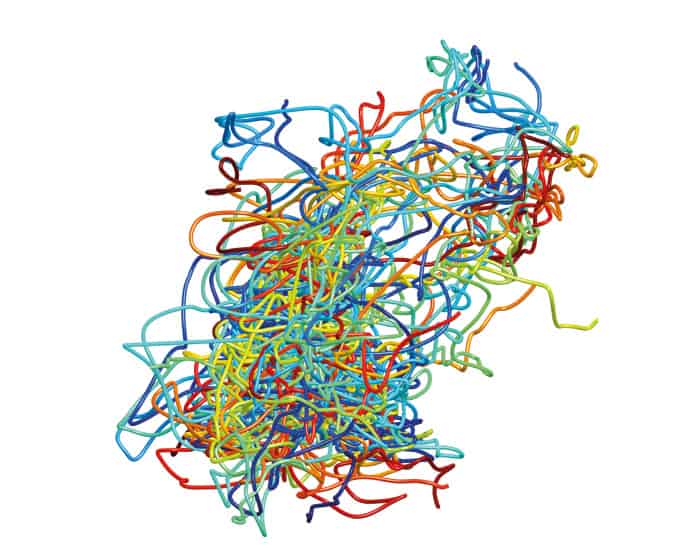
Experiments typically involve manipulating the conditions to see how swarms respond, like blasting those recordings of male or female midges – the changes in volume mimicking the application of an oscillating magnetic field to a material. Another experiment involves placing two black cloths together to draw a swarm and then slowly pulling them apart – the swarm splits into two distinct swarms, exhibiting a property akin to elasticity or mechanical strength in materials. In each case, Ouellette uses high-speed cameras running at 100 frames per second to determine the position, velocity and acceleration of each insect, and uses a particle-tracking computer program to recreate the individual trajectories. Then it becomes a matter of analysing that data in such a way as to extract the large-scale swarm features.
Buzzing around: 20-second clips of the trajectories of 30 midges in one particular swarming event taken by high-speed tracking cameras in Nicholas Ouellette’s lab. (Courtesy: Nicholas Ouellette)
Ouellette’s most recent analysis of the data from his lab-based swarms yielded a result strongly analogous to a liquid vapour-phase coexistence (Eur. Phys. J. Special Topics 224 3271). The core of the swarm is consistently in a condensed phase (like water molecules in liquid form), with a more dilute "vapour" phase around the edges (like water molecules in gaseous form). Individual midges can, however, wander back and forth between the two phases. Such findings are intriguing, but fall short of the ultimate goal of a universal set of rules for swarms.
Craig Tovey, who works with Hu at Georgia Tech modelling swarming behaviour in fire ants, honey bees and other systems, has observed a couple of common principles that show up in multiple cases. First, he has found that the models do not rely on past history to make predictions for the future, depending instead just on current conditions. That not only makes life easier when analysing such systems, but also makes sense biologically since ants, bees, fish, midges and other swarmy creatures do not have long memories. They would naturally respond to cues in their immediate vicinity to determine their next move.
Second, Tovey has also noticed that randomness plays a balancing role in many swarming models. With fire ants, for example, each individual insect travels in a random direction, but eventually the group forms a roughly circular raft. "You’ll get roughly the same number going in different directions to form these circular shapes – without any individual ant knowing what it or the others are doing," he says. That randomness explains how the fire ants can build complicated structures without any of them having any sense of the overall structure of the tower or raft or whatever else they’re building.
Tovey also suggests that evidence of scaling in the data could provide a vital clue to the question of whether a universal set of rules might exist governing swarms. Indeed, Andrea Cavagna and Irene Giardina – physicists at the Institute for Complex Systems in Rome, Italy – have already found evidence of this kind of scaling in their own studies of midge swarms (Nature Phys. 13 914). Unlike Ouellette, they study midges in the wild, where the swarms are much larger (with up to 1000 individual midges), providing a complementary approach. By tracking the midges in 3D with high-speed cameras, Cavagna and Giardina found that as individual midges group together and get larger and denser, they interact more, with the correlations increasing sharply with density. When enough midges gather in sufficiently close proximity, a swarm develops. This observation means that swarming behaviour is an "emergent" property and could therefore be described by scaling laws.
If, for example, the number density of insects in a swarm remains constant as the swarm grows, which is roughly correct for the swarms Ouellette has studied, then there would be a scaling relationship between the number of individual midges and the swarm volume. Such a relationship would be useful as it would then let you predict the volume of a swarm that would be formed by a different number of individuals, which you could, say, use to design an enclosure to hold swarms of a particular size.
"If we were to find a scaling law, that would be a powerful thing for interpreting the data, because it would allow us to make a prediction about how a swarm of different size, for example, would behave, even though we haven’t measured it," says Ouellette. Nevertheless, he is cautious about whether such laws actually exist. "I think the evidence for scaling in swarms is still pretty tenuous," he admits. "A lot more work needs to be done before I would trust scaling in collective behaviour too much."
That hasn’t held back Cavagna and Giardina, who say their experiments found that scaling holds across different swarms of three different species – each with different sizes and densities, recorded on different days over the course of a year. Their analysis, however, doesn’t amount to a true universal class of behaviour, since the existing models do not describe the specific dynamical behaviour of swarming midges. Whatever is regulating how each individual moves and interacts with others in the swarm at the microscopic level remains hidden. "We have found these systems obey these very non-trivial laws, which means we can hope to treat [swarms] with simple models in the same way as is done in physics," says Giardina. "And we also learned that there is still something we have not yet captured in the modelling. That is the next step."
As for Ouellette, he thinks his approach could yield even more progress by connecting the various lines of ongoing swarm research. While he acknowledges there may be some scepticism from certain quarters, he thinks he can win people over to his viewpoint: "If you’re loud enough, people eventually take notice." A bit like buzzing midges in fact.
Once a plastic bag reaches the ocean, how long does it hang around at the surface? And when the bag starts to disintegrate, what happens to it next? Questions like these are notoriously hard to answer, because Earth's oceans are huge, and plastic rubbish is unevenly spread and comes in a variety of shapes and sizes. However, after modelling ocean plastic a study indicates that the ocean surface could be plastic-free within an average of three years if we were to stop plastic entering the oceans tomorrow.
But once this plastic gets to the sea we have very little idea of what happens next. The huge whirlpool of plastic found in the North Pacific Gyre - often called 'the Great Pacific garbage patch' - shows that waste concentrates in some areas. Meanwhile, marine surveys indicate that plastic breaks down and sinks at different rates, depending on the size, density and shape of the piece of plastic. Beyond this very little is known about the fate of plastic entering our oceans, or indeed how much of the plastic we see bobbing the waves today is rubbish from the distant past.
Albert Koelmans from Wageningen University in The Netherlands and his colleagues took a systems engineering analytical approach to create a whole ocean mass balance model of plastic in the oceans. Using estimates of the amount of plastic entering the oceans each year, along with mathematical equations to calculate how quickly plastic fragments and sinks, the scientists gained a global perspective of what happens to the plastic in our oceans.
Their results suggest that 99.8% of all plastic that had entered the oceans since 1950 had sunk below the surface by 2016. For the year 2016, the model predicted that of the 0.309 million tons of plastic in the surface layer, 83.7% was macro-plastic, 13.8% micro-plastic and 2.5% nano-plastic - less than 0.335mm in diameter. If all plastic disposal to the oceans was stopped tomorrow, the model predicts that ocean surfaces would be near plastic-free within three years.
"It is important to emphasize that these figures are averages," said Koelmans. "Small plastics will sink earlier, whereas floating sun-loungers will take much longer to fragment into settleable particles." The findings are published in Environmental Research Letters (ERL) .
Getting a handle on what happens to plastic waste when it reaches the ocean is important if we want to optimise our strategies for tackling the plastic problem in future. "Our model suggests that the response time for plastic in the ocean is actually quite short, which favours strategies to reduce emissions of plastic, over strategies that aim to clean up the plastic that is already there," said Koelmans.
However, Koelmans and his colleagues stress that more data is needed to understand plastic behaviour in the water better. They intend to explore the impact of cleaning up ocean plastic in their next version of the model.



 “We want to determine if nonstandard analyses requiring high computational capacities will reveal additional information about these tumours and their response to therapy,” Shulkin said. “In addition, we are planning to evaluate other radiotracers, principally carbon-11 methionine, for their ability to characterize these tumours for pathways that suggest susceptibility to chemotherapeutic agents not yet studied in osteosarcoma.”