UK hydrogeologists have identified the unsaturated zone, which sits above the water table, to be a major store of nitrate, especially in well-established agricultural regions. The result is a lag potentially spanning decades between nitrate application and its release into drinking water supplies.
Matthew Ascott and colleagues at the British Geological Survey and Lancaster University modelled global nitrate leaching from 1900 to 2000, focusing on the unsaturated zone sandwiched between the soil and groundwater table. They estimated peak global storage of nitrate in the unsaturated zone to be 605–1814 Teragrams (Tg). This could amount to 7–200% of the biologically available nitrogen in soil.
Reactive nitrogen has more than doubled in terrestrial systems since the industrial revolution, largely due to agricultural and industrial intensification. When nitrate enters surface waters eutrophication can result. This can be catastrophic for aquatic ecosystems, reducing oxygen and light availability. Human health is also at risk. Babies are particularly vulnerable to methaemoglobinaemia, a blood disorder that can result from ingesting nitrates; the World Health Organisation recommends a maximum nitrate concentration in drinking water of 50 mg/l.
Traditional nitrogen budgets assume a steady state with no nitrate accumulation over time. Ascott and colleagues’ model, in contrast, indicated that globally nitrate “shows a substantial and continuous increase” in the unsaturated zone.
The team identified three clusters of catchments exhibiting distinct storage behaviours (see image). Cluster 1 saw consistently increasing nitrate storage until 2000, indicative of ongoing development and intensification, as found in Africa, South East Asia and South America. Cluster 2, typical of the US and Europe, exhibited a similar pattern until around 1985, when catchment measures were implemented. Cluster 3 showed no geographical coherence and less predictable storage behaviour. Initially, nitrate storage increased rapidly then plateaued, indicating a shorter travel time through the unsaturated zone.
Although cluster 3 basins would likely respond quickly to changes in catchment management, clusters 1 and 2, which account for a majority of the globe, showed a lag between nitrate entering the system and emerging in springs and extraction sites.
“The time lag between the soil zone and groundwater means that it may take decades for the impact of the change in management to actually be seen in groundwater,” said Ascott. To date, few nitrate pollution studies consider lags in the unsaturated zone. Ascott hopes the study will “provide a step towards integrating this process into policy” on an international scale.
Gravitational-wave signals from binary supermassive black holes could be lurking in data being gathered by the Gaia space telescope. That is the claim of a team of astronomers led by Christopher Moore at the University of Cambridge, who have proposed how Gaia’s astrometric measurements could reveal gravitational waves with extremely low frequencies. The researchers hope to analyse the data in a few years when the astrometric measurements are released by the Gaia team.
The earthbound LIGO and Virgo detectors have famously observed several gravitational waves (GWs) in recent years. Most of these ripples in space–time came from merging pairs of black holes weighing in at tens of solar masses. We know that much larger supermassive black holes (at millions or billions of solar masses) exist and could form binary systems that broadcast GWs. However, the frequency of these GWs would be extremely low – well below the minimum frequency that can be detected by LIGO and Virgo.
Billion stars
Since its launch in 2014 by the European Space Agency, Gaia has been measuring the apparent positions of around a billion stars. In the early 2020s, it will release at least 80 readings for the positions of each star over 5–10 years, giving scientists a vast amount of data. Moore and his team realized that ultralow-frequency GWs would cause the apparent positions of distant stars relative to Earth to oscillate in subtle yet characteristic patterns.
Moore’s team explored this idea by simulating a mock set of Gaia data and injecting it with their predicted GW effects. Even after compressing the data by a factor of a million to reduce the required computational power, the team managed to recover the injected effects. The researchers are now confident that they are ready to begin analysis on Gaia’s data once it is released.
The properties of a hypothetical 4D material have been simulated in experiments done by two international teams of physicists. One team used light to emulate the 4D quantum Hall effect (QHE) while the other did it with ultracold atoms.
The quantum Hall effect has been the subject of several Nobel prizes and occurs in very thin conducting layers that are essentially 2D in nature. When such materials are cooled to near absolute zero and subject to a strong magnetic field, the electrical conductance is quantized and can change only in discrete steps. The QHE is a universal property of 2D conductors and can be seen in a wide range of materials – even when the samples are disordered.
Theoretical novelty
While the QHE does not occur in 3D materials, in 2001 physicists predicted that it could also occur in systems with four spatial dimensions. But nature only has three spatial dimensions, so the idea of the 4D QHE had been a theoretical novelty – until now.
Mikael Rechtsman of Pennsylvania State University and colleagues built their 4D QHE system from an array of optical waveguides. The waveguides are closely-spaced tubes that are etched through a single piece of glass using a powerful laser (see figure). By carefully positioning the waveguides in the array, the team created extra “synthetic dimensions” that emulate a 4D material.
Current of light
In their system, light played the role of electrical current and the team showed that its transmission though the lattice was much like what occurs in a 4D QHE.
Meanwhile at the Max Planck Institute for Quantum Optics in Munich, Immanuel Bloch and colleagues created similar synthetic dimensions using a 2D array of ultracold atoms trapped by crisscrossing laser beams. Bloch’s team began with a regular square array of atoms. Then they applied additional laser beams in the plane of the array that were offset from the array’s symmetry axes. This created a complicated superlattice in which the atoms moved as described by the 4D QHE.
Both teams included Oded Zilberberg of ETH Zurich, who developed the theoretical basis for creating a 4D QHE in special 2D systems.
Quasicrystal devices
Rechtsman believes that the 4D QHE simulations are more than just esoteric curiosities and could have practical applications. He points out that quasicrystals – materials that are crystalline but have no repeating unit cells – can have “hidden dimensions”. Their structures, he says, “can be understood as projections from higher-dimensional space into the real, 3D world”, adding that this higher-dimensional physics could form the basis of new types of photonic devices.
The journey to the Fukushima Daiichi nuclear-power plant is a truly sobering experience. When we visited the infamous site in September 2017 our scientific curiosity was dampened by the deserted villages we passed along the way. It was clear from the belongings left behind that the inhabitants had moved out in a hurry following the disastrous earthquake, tsunami and nuclear accident that took place in March 2011. Around 470,000 people had to be evacuated from this region, 154,000 of whom had to leave because of the damaged power plant. With vegetation covering houses and cars, nature has now taken over these abandoned settlements.
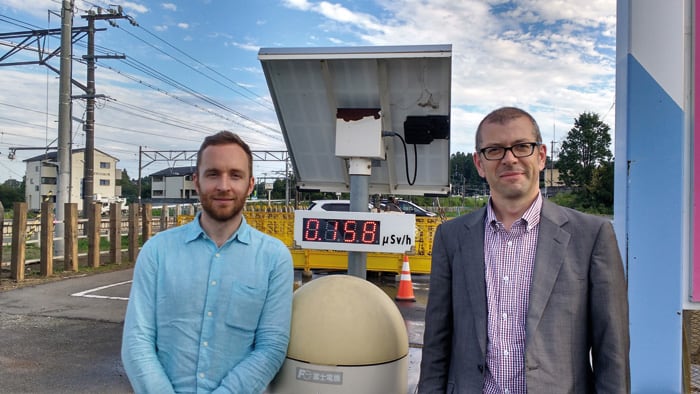
These villages are being slowly decontaminated – with some even declared safe – and roadside solar-powered radiation dosimeters have been installed to give the public confidence that things are on track. But despite this, we got the sense that official information remains mistrusted. Combined with the fear of radiation and a lack of jobs, past residents are reluctant to return and the villages they once lived in remain deserted.
We watched these empty houses pass by from a bus operated by TEPCO (the Tokyo Electrical and Power Company, which runs the reactors) as we were driven the 8.5 km from the security checkpoint to the Fukushima Daiichi plant itself. Upon entering the site, we passed large tanks of contaminated water and vast treatment plants designed to remove the radionuclides from the water that is used to cool the remains of the reactor cores. There were numerous large diggers and trucks, many so contaminated that they have themselves become radioactive waste. Then, as we descended a small hill overlooking units 1–4 of the plant, we saw for ourselves the destruction and large-scale construction work being carried out.
Measured approach: Bruce Drinkwater (right) and Rob Malkin by one of the many solar-powered dose meters located around Fukushima prefecture. This one, in Naraha, shows 0.158 µSv/h at a distance of 13 km from the damaged reactors. (Courtesy: Bruce Drinkwater)
Disaster zone
It is worth recalling the cause of this disaster. On the afternoon of 11 March 2011, a massive 9.1 magnitude earthquake occurred roughly 70 km off the east coast of Japan. The fourth most powerful earthquake of modern times, it created a giant 15 m tsunami that hit the Fukushima Daiichi plant about an hour later. While the plant’s four reactors are 12 m above sea level, the emergency diesel generators that supply back-up power to the cooling systems are only 5 m above the water line. At this lower level, the power of the tsunami was more apparent – large storage drums were distorted by the impact of immense waves, and the emergency power supply and cooling systems of three reactor units were disabled.
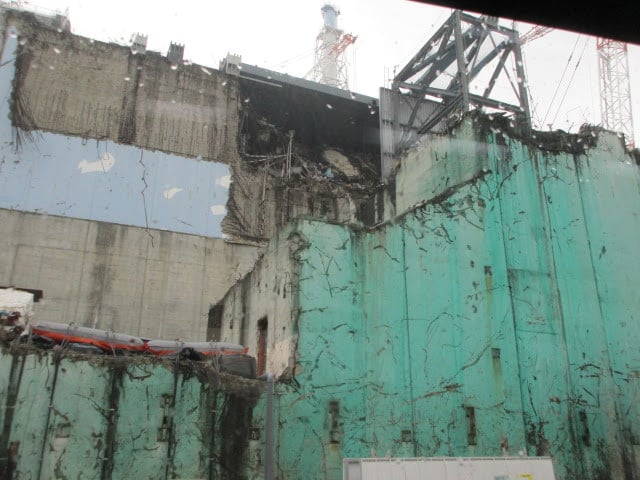
Units 1 and 3 subsequently suffered meltdowns, and powerful hydrogen explosions caused extensive damage to the 1 m-thick reactor building walls. Unit 2 also suffered a meltdown but avoided a hydrogen explosion. As for unit 4, which was undergoing maintenance at the time, a hydrogen explosion was caused by gas flowing from unit 3 into the unit 4 reactor.
While the decommissioning process will involve many stages, the first – a comparatively easy task – involves removing used fuel from the spent fuel pools located towards the tops of the reactor buildings. This was completed at unit 4 in 2014. The next task is to remove melted fuel debris, but this can only happen once its location and condition is firmly established.
Explosive event: The upper side of the unit 3 reactor building at Fukushima Daiichi was damaged by a hydrogen explosion. This area housed the spent fuel pool and the fuel handling machines. (Courtesy: TEPCO)
This is why we were in Japan. Our trip was part of a UK–Japan project to create new technology for exploring the hostile environment within the damaged reactors. Our part in this effort is to design new radiation-resistant ultrasonic imaging systems that will help provide more detailed information on the reactors’ current conditions, and allow the long and difficult decommissioning process to really begin. The work is being carried out in collaboration with Hiroshige Kikura and colleagues at Tokyo Institute of Technology, who are researching the robotic systems needed to venture into the inner reaches of this challenging and complex environment.
Our TEPCO bus parked between the badly damaged buildings of units 2 and 3, where the radiation levels for our visit peaked at 270 mSv/h (the annual limit in Japan is 50 mSv). Typical radiation exposure varies widely depending on where you live, but in the UK it is 2.7 mSv per year on average (though the average in Cornwall is much higher, at 6.9 mSv per year). Naturally, we were not permitted to leave the vehicle and were advised not to stay long.
To get a view of what a nuclear-power plant is supposed to look like, we also travelled to the north-west coast of Japan for a tour of the Tsuruga plant, which was untouched by the 2011 earthquake and tsunami. Located on a peninsula bordered by tranquil beaches, the region is a picturesque holiday destination and the power plant lies partially hidden by forest-covered rocky terrain surrounding it on three sides. A 1.5 km tunnel took us through this mountainous interior of the peninsula, and we emerged next to the gleaming white-painted reactor buildings of the plant.
This site has two reactors: a pressurized water reactor (PWR) and a boiling water reactor (BWR). PWRs are the most common type of reactor found around the world and use pressurized water as a coolant to extract heat from the nuclear fuel. BWRs are also in widespread use, particularly in Japan, and operate at a lower pressure, which allows the coolant to boil and the resultant steam to drive the electricity generation turbines directly. The PWR is still operational, though like most nuclear reactors in Japan, is currently offline and waiting for politicians to decide about the future of nuclear power in the wake of the earthquake and tsunami. The BWR that we had come to see is in the early stages of decommissioning and, crucially for us, is of a very similar design to Fukushima Daiichi’s reactors.
Inside a reactor’s heart
Gaining access to the BWR was, quite rightly, not a quick procedure. After exchanging business cards and taking lunch with our hosts, the Japanese Atomic Power Company (JAPC), we attended a briefing that left us in some suspense as to exactly what we were going to be allowed to see as it was given mostly in Japanese. A JAPC bus then delivered us to the security and safety check point where we were issued with entry passes, relieved of our shoes and checked in radiation scanners. At this point, we were also given personal dosimeters, which record total radiation exposure and ensure that nuclear-power-plant workers and visitors stay within strict annual dose limits. Next came a new outfit: light blue socks, gloves, hair net, helmet and even thermal underwear, topped with a light blue boiler suit as the outer layer. A second radiation check, some standard-issue blue shoes and, finally, the preparation process was complete. We passed through an airlock and crossed the threshold into the most tightly controlled area on the site – the reactor building itself.
The interior of the building was hospital-like in its cleanliness and the only sound was a low, persistent hum of machinery. We were led along a network of large and deserted concrete corridors that surround the primary containment vessel (PCV) – a concrete and steel structure enclosing the reactor vessel that is designed to contain any radioactive material in an accident. A very ordinary lift (amusingly almost identical to one in our university department) took us to the PCV’s entrance and, with no ceremony at all, we were ushered into the giant inverted-light-bulb-shaped containment vessel.
The height we entered at was level with the bottom of the reactor pressure vessel (RPV) where the control rod mechanisms are located. These rods control the nuclear reaction by absorbing neutrons, and are inserted and withdrawn by electrical drivers from below the pressure vessel. Standing on the metal grating floor, we were immediately struck by the engineering complexity: pipes and valves and all manner of fixtures and fittings clutter the space, with large painted markers of 0°, 90°, 180° and 270° the only way of maintaining a bearing.
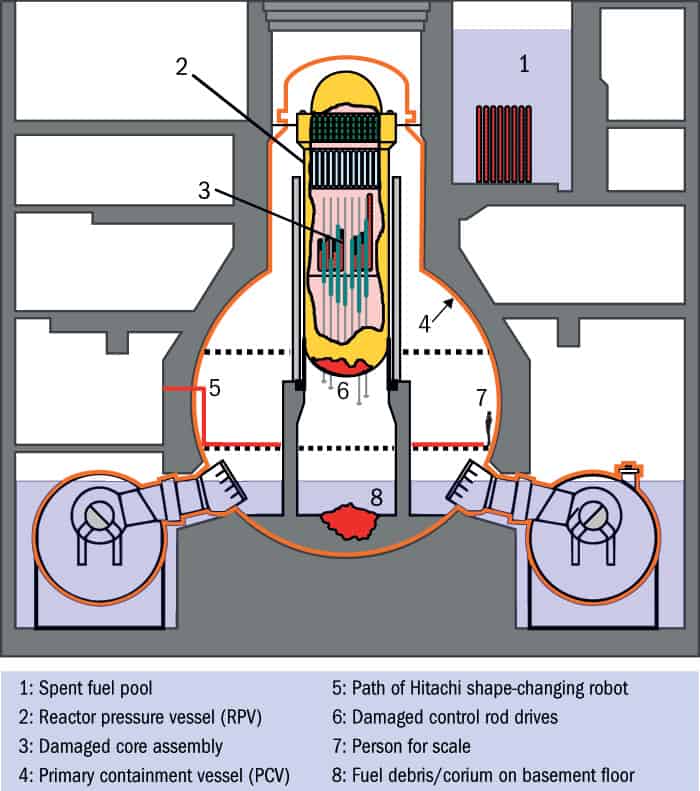
A spiral staircase bought us to the concrete basement of the PCV. At Fukushima Daiichi (figure 1), this is where the fuel from the exploded reactors now rests as a lava-like mess known as corium – an unpleasant mixture of radioactive fuel, the remains of various metals and the products of the chemical interaction between the fuel and the concrete. The 10 m thick concrete floor and the metal shell below are the final barriers stopping that radioactive fuel leaking into the environment.
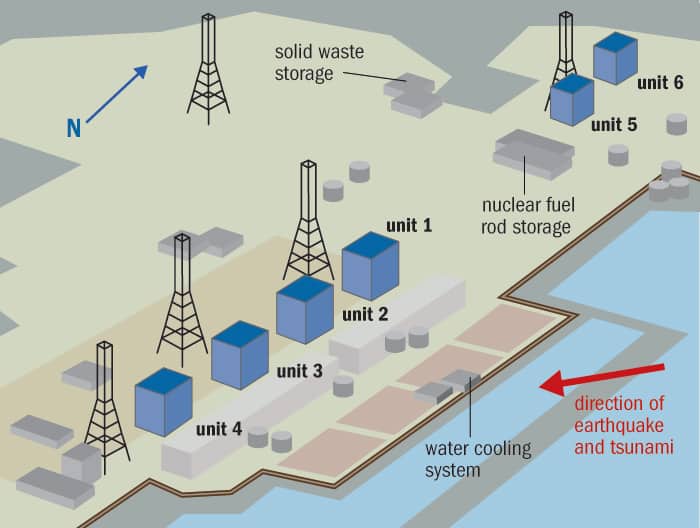
1 The flooded vessel Schematic of the reactor pressure vessels at Fukushima Daiichi. In the now-flooded concrete basements of these vessels, fuel and other debris await clean-up, but the area is far too radioactive for human access and even robots are destroyed in a short time.
We were now at the bottom of this light-bulb-shaped container where more pipes and other metalwork fill much of the space, providing a rather claustrophobic environment. The RPV itself sits on a 4 m diameter hollow concrete cylinder known as the pedestal, which we could just about see beyond the tangle of pipes. After clambering over large earthquake isolation dampers, there in front of us was a small opening looking into the interior of the pedestal – an uncluttered space compared with the complexity surrounding it. We had arrived at our destination. This is what Fukushima Daiichi’s units 1–3 would have looked like a few seconds before the disaster. And as the pedestal sits directly below the RPV, it is thought that much of the fuel and other debris caused by the meltdown may be contained in this hollow space, although recent images seem to show that some has spewed out of the small openings. After the accident, the PVCs were flooded with water up to a depth of 6 m to cool and moderate the ongoing reactions.
Deploy the robots
To date, a number of shape-changing robots, crawler robots and more recently a submersible robot, have been sent to explore the highly radioactive areas of the Fukushima Daiichi’s reactor buildings. However, access to the pedestal area itself is limited and the extremely high radiation levels near the fuel make it particularly challenging. The crawler robots enter the PCV through a 10 cm diameter tube known cryptically as X-100B. From here they are lowered about 2 m onto the metal grating floor of the PCV’s access level – the equivalent level at which we had entered Tsuruga’s PCV. From videos recorded by the first robots, it was quickly established that this floor has been damaged by heat but is mostly intact apart from a gaping hole through which the molten fuel fell. During the most recent deployment in late 2017, a submersible robot, known as Mambo, was lowered through openings in the metal grating floor, into the water below, to explore the lower regions of the PCV outside the pedestal.
The robots tell us that the radiation dose levels around the metal grating floor are 10–20 Sv/hr. Enough to kill a human in a few minutes, they’re operating in a world in which even specially designed robots and cameras don’t last long because of radiation damage to electronics and cabling. Outside the PCV, radiation levels are high relative to background, but low enough to conclude that the PCV has done its job and contained the fuel. Meanwhile, from the robots’ videos and images, we know that the uranium fuel melted through the bottom of the stricken RPVs and fell into the concrete basement. In some simulated scenarios, the fuel fell in a single large lump, while in others it was sprayed much more widely. However, the true state of the 200 tonnes of uranium is largely unknown, apart from the lower floor images, which show some molten material outside the pedestal.
To survey the location and condition of the fuel, and then help with the eventual removal process, our research group is developing an ultrasonic array imaging technique. Our imaging arrays are made up hundreds of small piezoelectric elements, each acting as an emitter and receiver of ultrasonic waves. In the imaging mode, the arrival times of the return echoes are used to map the 3D scene in front of the device – much like how bats use echolocation to hunt their prey and avoid flying into objects. More elements and larger arrays produce better images, but in the reactors’ space and with the access limitations, the system must be unusually compact – roughly as small as a coffee mug.
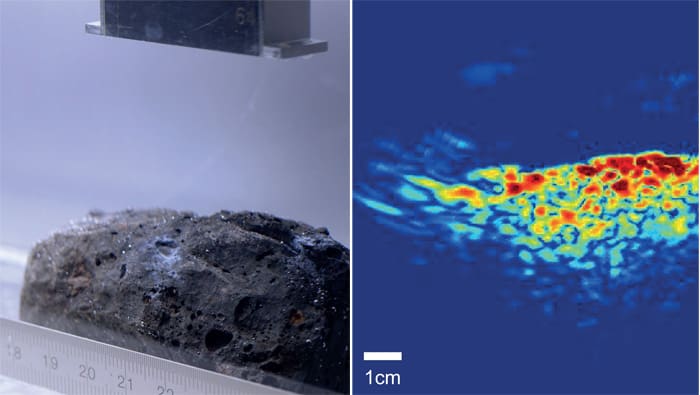
2 Sounding out the damage Bruce Drinkwater and Rob Malkin’s technique uses ultrasonic imaging to characterize structures and materials. (a) Imaging using a 2.5 MHz array of a sample of steel making slag, used as a simulant of the heterogeneous fuel debris expected within the reactor pedestal. (b) An ultrasonic image of the specimen showing surface features. (Courtesy: Rob Malkin)
Ultrasonic devices have two major advantages over optical camera systems in this kind of environment. First, the piezoelectric ceramics that they are made from are naturally radiation tolerant, which means that these devices can get much closer to the fuel, for example in the pedestal area, where the radiation levels are expected to be extremely high. Second, they can form images even in water that has been made optically opaque by fine particulates, a problem already encountered by the Mambo submersible robot.
Our imaging system will combine a reasonably standard sonar array for robot navigation and a novel high-frequency array for detailed materials characterization (figure 2). This second system will use the angular reflectivity and frequency spectral features of the ultrasonic echoes to distinguish the various materials that could be present. For example, metallic objects will produce high-amplitude short-duration echoes, whereas porous material such as corium will cause reduced amplitudes and more diffuse scattering. In some cases, it might also be possible to send the ultrasonic waves inside the debris and start to get a picture of its internal structure. Given the current uncertainties, whatever is discovered will be extremely valuable in planning the next steps and allowing decommissioning to begin in earnest.
Fukushima’s future
Our visit to Japan gave us a real sense of what lies lurking in the flooded depths of the damaged Fukushima Daiichi reactors. It is without doubt one of the most challenging environments imaginable. We hope our ultrasonic measurement systems, when mounted on specialist robots, will help form a definitive picture of exactly what state the damaged reactors are in, as only once this picture has become clear can the long process of fuel removal and decommissioning really begin. For us, there is still more research to be done over the next few years, but there is a real prospect that the systems we are developing will be manufactured and sent into the damaged reactors. In some ways, we feel a bit like the scientists and engineers preparing to launch a satellite into space – on the one hand excited, but on the other aware that, once the system is deployed, much of what happens is out of our hands.
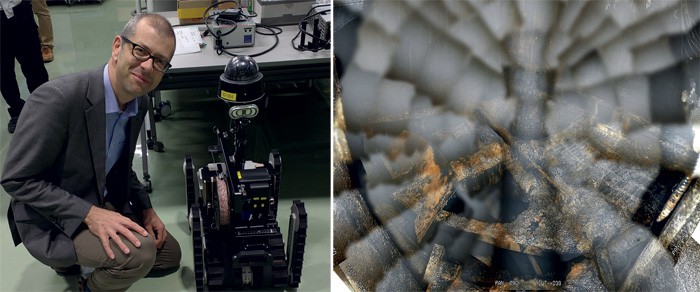
Robot mission: (left) Bruce Drinkwater with an experimental robot designed for traversing rubble. (right) Inside unit 2, the pedestal area walkway directly underneath reactor pressure vessel. This image from one of the robots shows potential deposits of molten fuel. (Courtesy: left Bruce Drinkwater; right TEPCO)
The decommissioning of the Fukushima Daiichi nuclear plant is a multi-faceted science and engineering challenge, in which progress can be made only by scientists and engineers, in academia and industry, working together across national and subject boundaries. So big is the challenge that it will be around for the next 30 years, if not more.
Timeline of a disaster
11 March 2011 Earthquake strikes 70 km off east coast of Japan, causing the emergency shutdown of Fukushima Daiichi and loss of mains power
Fukushima Daiichi is hit by a 15 m tsunami, disabling emergency cooling generators
12 March 2011 Explosion and radiation leak at unit 1
13 March 2011 Sea water injected into units 1 and 3
14 March 2011 Explosion at unit 3
Sea water injected into unit 2
15 March 2011 Explosion at unit 2
Fire and explosion at unit 4
17 March 2011 Helicopters pour water on units 3 and 4
16 December 2011 All reactors are in a state of “cold shutdown”
The design of block copolymers that self-assemble into various shapes has proved an attractive approach for nanoscale periodic patterning that can cover large areas. However, various approaches that aim to control the alignment of these patterns often require several hours of annealing and can introduce defects, as well as limiting the block copolymer materials that can be used. Now, researchers have shown that a mismatch in the coefficient of thermal expansion in the block copolymer substrate and an applied top coat can provide a shear stress that aligns patterns over large areas with few defects after mere minutes of annealing.
Order means little without control. When Sam Nicaise – now a postdoctoral researcher at the University of Pennsylvania – and colleagues led by Karl Berggren at MIT in the US started looking at ways to control block-copolymer self-assembly, they joined a throng of researchers who had tried working with viscous flow, electromagnetic fields and gradient annealing with similar aims.
Block copolymers combine two or more different types of organic string molecules. In a way that resembles the phase separation of immiscible oil and water, block copolymers can microphase separate, leading to the self-assembly of nanostructures.
“We had a hunch – we thought maybe we could provide shear stress with a top coat,” says Nicaise. Conventional block-copolymer films are bare but research was starting to suggest that adding a top layer might make it possible to make the self-assembled patterns align. Nicaise and his colleagues thought they might be able to take the approach further, not just asserting alignment but controlling the direction of alignment as well.
Other groups had added oils and organic top coatings to the block copolymers. “If you come from a chemical engineering and rheological perspective that looks at the flows as a function of time and temperature, soft top coats are the first step,” suggests Nicaise. “We come from electrical engineering – so we come from a different perspective.”
Instead he and his colleagues opted for inorganic silicon dioxide, which brought two advantages. Silicon dioxide can tolerate higher temperatures, so by going to higher temperatures they could increase whatever shear stress is caused by a mismatch in the coefficient of thermal expansion between the layers. It also makes the structures compatible with industry processes, which generally use high temperatures.
The hunch paid off. The top coat cracked, but the researchers found that shear stresses exerted on the block copolymer followed the cracks and the alignment followed the direction of the stress. As a result, cracks could be artificially scribed on the surface to control the direction of alignment.
The stresses generated exceeded 100 kPa – orders of magnitude larger than those required for the shear alignment of block copolymers. In addition, the MIT researchers only annealed their films for 10 minutes. Other approaches to aligning block copolymer self-assembly require hours of annealing – timescales that can cool industry interest. As Nicaise puts it, “To see it ordered after annealing in just a few minutes – that’s really exciting.”
The researchers
Cheap models
The most common theoretical models for block-copolymer systems are either field-based or particle-based, which can be computationally expensive and time-consuming to calculate. Instead, the MIT researchers used a larger numerical approach based on finite elements, and this is able to capture the stresses inside the system.
Nicaise emphasises how useful the simplicity of their viscoelastic analysis is. His co-worker from the Alexander-Katz Group at MIT, Karim Gadelrab, who worked on the modelling side of the project, is enthusiastic about how much more quickly it can run simulations to capture the temperature-dependent mechanical properties of the block copolymer film and inorganic layers. “It gives an example of how researchers can use a less expensive technique to look at what patterns they can get with the block copolymers,” says Nicaise.
Opportunities for further development
As someone who has been looking at array fabrication and these kinds of films for nearly a decade, Nicaise sees a lot of room for improving the technique so that the alignment covers larger areas. At present, the alignment is best close to the cracks and the film remains well aligned within around 100 micrometres of the crack. In this respect it has potential for being a useful local patterning approach. “I am hoping some researchers can pair it with other techniques for shear alignment such as laser annealing for local annealing,” adds Nicaise.
That said, there are other advantages. While viscous flow and electromagnetic field approaches to impose alignment on block copolymer self-assembly are based on the properties of the polymers themselves – such as the dielectric coefficient or magnetic permeability – the shear stress from the top coat stems from the materials of the top coat and substrate, allowing more freedom in the polymers that can be used.
Nicaise suggests that fabricating chips with features below 10 nm is a possible application of the approach. In addition, by leaving the top coat on, it may be possible to stack several layers of scribed films and anneal them in one go, providing an approach to accompany other methods to produce 3D structures. There is also the possibility of working with how the block copolymer self-assembly interacts with nanolithographically patterned topographical templates.
Researchers at North Carolina State University have developed a mathematical model for computing radiation treatments that could substantially reduce side effects, while delivering the same results as conventional radiotherapy (Phys. Med. Biol.63 015036).
Most radiotherapy treatments are fractionated, with patients receiving the total radiation dose split into multiple treatments delivered over several days or weeks. Such fractionated regimes reduce radiation-induced cell damage, because if the same physical dose is delivered in multiple fractions, it allows healthy cells to recover between treatments. Current clinical protocols stipulate that patients receive the same dose in each treatment session; but this regime may not always be optimal.
“Different doses, carefully planned to minimize side effects, can be just as effective,” explained Dávid Papp, assistant professor of mathematics at NC State University. “However, the extent of this benefit has never been assessed. The algorithms we use now to determine the best personalized treatments don’t work when computing treatments with different dose distributions in different fractions.”
Papp developed and tested a “spatiotemporal fractionation” approach, in which different dose distributions are delivered in different fractions. By hypofractionating parts of the tumour while delivering approximately uniform doses to the surrounding tissue, such treatments can reduce the radiation dose to healthy tissue while maintaining effectiveness against the tumour.
In a proof-of-concept study, Papp and colleagues tested the plan against model slices of five different liver tumours, each representing a unique tumour size or location, to allow comparisons with actual clinical treatments.
“We wanted to see what the quantitative benefits of such a new protocol would be,” said Papp. “How much can you reduce the radiation’s effect on the liver while making sure that the tumour receives a consistent and effective dose? A reduction of 20% would reduce side effects enough to warrant a change in everyday clinical practice.”
The computed spatiotemporal plans reduced the liver dose by 13 to 35%, without compromising other clinical goals. Papp has now begun work on refining the model to make it more robust, with a view toward in vivo testing.
“Conventional radiation treatments don’t necessarily achieve maximum benefit,” Papp says. “Our protocol, by delivering a high single-fraction dose to parts of the tumour during each fraction and a consistent lower dose to the liver and other healthy tissue, could reduce patient side effects substantially while maintaining the same effectiveness as conventional treatments.”
Researchers at the University of Pittsburgh have measured neural firing in the motor cortices of two tetraplegic subjects using intracortical electrodes (electrodes implanted directly into the brain). The subjects used a brain-computer interface (BCI) to control a neuro-prosthetic robotic arm and attempted to reach and grasp an object in space. The presence of the object altered the subjects’ cortical activity and adversely affected BCI performance, since calibration and decoding were performed prior to the task.
In this study, the group added a simple online scaling factor to their BCI model, improving subjects’ control of the robotic arm. Their research provides a generalizable BCI control method and explores neural changes in the motor cortex, furthering the development of human and machine interaction (Scientific Reports7 16947).
The development of BCIs to control prosthetic appendages is extremely important. For example, the use of robotic exo-skeletons enables heavy lifting in industry; while in healthcare, BCIs could provide a way for patients who have lost the use of their limb(s) to regain control and independence. Linking robotic arms to the user’s brain is an ongoing field of research, but it is hindered by difficulties in understanding how the brain operates during a motor task at the neural population level.
In this work, the researchers quantified the differences in neural firing during robotic grasping with and without an object, and improved subjects’ performance in the task by correcting for these neural changes online.
Training and scaling
The researchers implanted intracortical microelectrode arrays that can record from neural populations into each subject’s motor cortex (M1). Prior to the task, they used virtual reality to train the BCI decoder, such that it could correctly interpret the neural activity from the subject, and communicate with the neuro-prosthesis. The subjects performed a calibration reaching task in virtual reality to train the decoder.
Two subjects then performed three tasks in a real environment: reaching and grasping a cylindrical object; reaching to same position and closing the hand in the absence of an object; and an object transport task, whereby they had to pick up the object, move it across a 20 cm zone and place it on the other side, as many times as possible.
The team calculated a scaling factor to correct for changes in motor cortical activity during the task, equivalent to the mean neural firing rate over the previous 300 ms of recording divided by the neural firing rate during calibration.
Online correction improves BCI performance
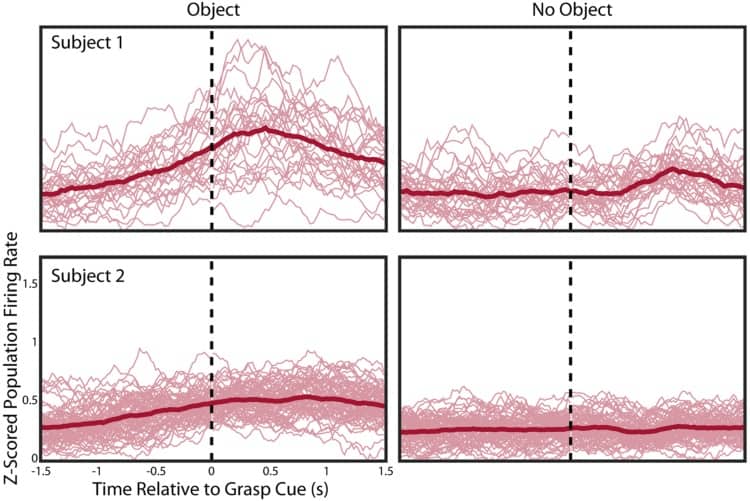
The presence of an object during the grasping task decreased BCI control, leading to poorer subject performance. This was caused by a steady increase in population firing rate in the motor cortex, as measured using the intracortical electrodes, as the robotic arm moved closer to the object.
Neural population firing rates.
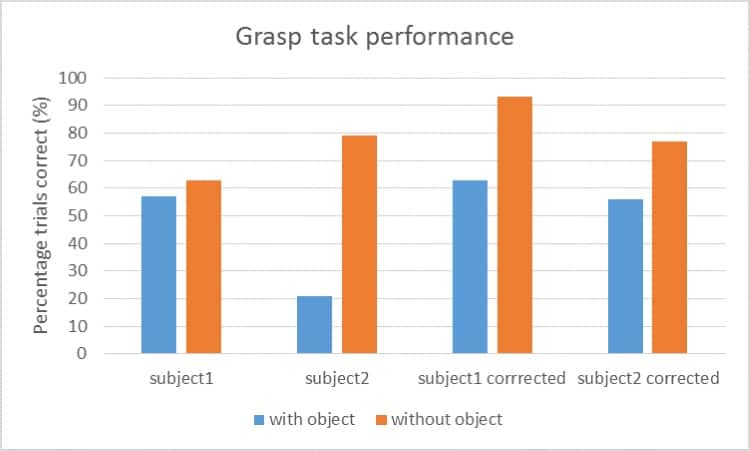
The researchers then used their scaling factor to correct for this performance drop, by dividing each channel of the microelectrode array by the scaling factor. This quick, online correction improved both subjects’ performance. They both also showed significant improvement in the object transport task after the correction.
Grasp task performance for both subjects.
Implications
It is unknown why neural firing increases in M1 when grasping an object – it may be that object information, planning and execution is encoded in nearby brain regions. However, the interaction of objects and motor control has not been studied in depth. The authors also suggest that the use of a prosthetic arm may have affected the neural firing – this could be compared to natural arm movement to see if there is similar sensitivity.
In this study, the researchers provide a generalizable online adjustment to improve BCI control, and pave the way for exploring mechanisms relating to motor cortex/object interaction.
Volcanoes could intensify their activity as the climate warms, increasing their threat to the aviation and agricultural industries. That’s according to a study published in Earth-Science Reviews.
Claire Cooper of the University of Leeds, UK, together with collaborators from Leeds and the University of Cambridge, warns that the likelihood of large volcanic eruptions could increase as climate warms and glaciers retreat. Such eruptions release ash clouds that can damage jet aircraft, reduce crop yields, and harm animals and humans that breathe in the particles.
As glaciers reduce in size, the land around them “rebounds” since it is no longer weighed down by ice. In turn, the pressure on any underground magma chambers reduces, allowing more rock to melt. This increased volume of magma enhances volcanism above.
Volcanic eruptions may affect the climate in many ways, from causing warming by releasing greenhouse gases to, more often, cooling by emitting reflective compounds. Such global cooling events place enormous strain on agriculture by shortening growing seasons and reducing the amount of sunlight reaching the ground.
Volcanic ash clouds have more direct effects too. They cause respiratory problems for animal and human populations over huge areas, and have the potential to cause major damage to jet engines, grounding flights across whole continents. The 2010 eruption of the Icelandic volcano Eyjafjallajökull closed European airspace for more than a week, causing £1.1 billion of losses to the airline industry. The eruption of Bali’s Mount Agung in November 2017 also disrupted flights in and out of the island. If global climate continues to warm, these incidents could become more frequent as volcanism increases.
Volcanoes could represent a new, yet potentially devastating, component of the challenges the planet faces if the climate continues to warm.
NASA should dedicate nearly a quarter of its Earth science budget towards better ways of observing the Earth. That is according to a new decadal survey for Earth observation that was released on 5 January by the National Academies of Sciences, Engineering and Medicine (NASEM). In the report, NASEM calls for a number of missions to launch in the coming decades to improve weather forecasts as well as better predict sea-level rises and other concerns, such as droughts and earthquakes.
Covering the period 2017 to 2027, the 700-page report, has been co-chaired by Waleed Abdalati, a former NASA chief scientific advisor, and William Gail, cofounder and chief technology officer of Global Weather Corp. It provides recommendations for space-based observations for the three US agencies that are involved with Earth measurement responsibilities – the United States Geological Survey, the National Oceanic and Atmospheric Agency and NASA.
While Abdalati and Gail emphasize continuity with the previous 2007 decadal survey, they highlight that the world has dramatically changed since then with individuals, businesses and communities now depending more than ever on satellite-based observation. “Earth information from space is an integral component of our daily lives and an integral component of how we live more broadly,” says Abdalati. He adds that the US military, for example, depends on satellite-based observation “to the tune of $2bn”.
The report highlights research areas to be tackled in three major categories of missions dubbed “designated”, “explorer” and “incubation”. Designated projects, which are the most expensive, include missions that would study aerosols as well as surface deformation and change. An example of a former designated mission is the Gravity Recovery and Climate Experiment (GRACE) , which launched in 2002 to measure gravitational anomalies. Gail says that GRACE has spawned a “huge revolution in our ability to understand the Earth”, and explains that the 2017 survey directs GRACE to go up to next level for refined gravitational anomaly measurements. These could be especially helpful for measuring drought and aquifer depletion, in addition to ice changes.
Explorer is a new funding line comprising of medium-priced missions capped at $350m. The report recommends explorer missions to take atmospheric-wind measurements involving Lidar and also to monitor carbon dioxide in the atmosphere. Incubation, meanwhile, focuses on programmes around $20m that would study the planetary boundary layer, surface topography and vegetation as well as advanced measurements for atmospheric winds. These capacities are “not ready for prime time”, according to Abdalati, but with investment will mature over a decade to eventually provide critical measurements.
Gail adds that the essence of the decadal surveys is that they appreciate the interconnections that make up the Earth system, pointing out that fine-scale convection determines cloud feedbacks that ultimately impacts global climate. “Satellites give us a global view and a lot of times these interconnections are multiscale,” he says. “So being able to do the global scale and connect that to the fine scale is critically important.”
Although precision medicine is coming along in leaps and bounds, targeted drug delivery to tumours remains a huge challenge. A variety of nanomaterials, including ligand-conjugated liposomes, exosomes, inorganic nanoparticles and immunoliposomes, can be used to deliver specific drugs but the problem is that it is difficult to maintain the bioactivity of these therapeutics. What is more, they must be oriented in the correct way to efficiently target a cell population of interest. A team of researchers at Xiamen University in China has now developed a biomimetic theranostic ligand-targeted nanoplatform based on bio-functionalized liposome-like nanovesicles (BLNs) containing protein/peptide ligands that overcomes all these problems.
Personalized, or precision, medicine will replace the traditional and outdated “one size fits all” medical approach to one that will be safe, precise and tailored to each individual. Precision oncology or precision medicine of cancer aims to match the most accurate and effective treatment to each patient.
Researchers led by Gang Liu at the Innovation Center for Molecular Imaging and Translational Medicine at Xiamen University say they developed their BLNs to selectively target a wide spectrum of specific cell populations as well as tumour tissue thanks to appropriately-designed protein probes on their surface. “These ligands can be affibodies, single-chain antibodies or nanobodies,” explains Liu. “In our study, and as a proof of concept, we genetically engineered nanovesicles displaying human epidermal growth factor (hEGF) or affibody ligands that target tumour cells.”
Ligands maintain their good bioactivity
The researchers began by engineering natural hGEF or affibody ligands so that they could be guided to the cellular surface. They then triggered a process that caused giant plasma membrane vesicles to bud from the cell surface in a way that is very similar to how exosomes – tiny membrane-bound spheres – are excreted from cells. These vesicles help in the formation of nanoscale BLNs functionalized with protein ligands that are oriented in the right direction to better target tumour cells, says Liu.
“And that is not all: we inserted the protein probes into vesicular membranes using intracellular biosynthetic routes rather than by chemical conjugation techniques,” he adds. “This allows the ligands to maintain their good bioactivity because it avoids vulnerable biomacromolecules from being lost through non-specific covalent linking processes.”
Better than liposomal doxorubicin
The team tested nanovesicles containing affibody ligands on two types of tumour cells and BT474 tumour xenograft models, and found that those loaded with the widely-used anti-cancer drug doxorubicin were much better anti-cancer agents than the clinically approved liposomal doxorubicin.
“Doxorubicin-loaded nanovesicles displaying affibody targeting moieties can be more effectively bound and taken up by HER2-overexpressing tumour cells via a mechanism called specific receptor-mediated endocytosis,” explains Liu. “As a result, enhanced Dox accumulation in HER2-overexpressing tumours substantially improves the antitumour efficacy resulting from BLN targeting delivery, and importantly, also significantly reduces the Dox distribution in major vital organs, which is a problem for many antitumour therapies.”
Even though BLNs might be limited when compared to some synthetic nanocarriers, such as block copolymer micelles (because they may be difficult to purify or reproduce), they could still make good nanoplatforms for producing a wide range of ligand-targeted nanovesicles, he adds.
“They could also be adapted to design analogue vehicles for drug-targeted delivery to a wide range of specific cell populations and tissues by engineering the appropriate protein probes on the BLN surface.”