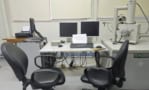
Skip to the content

Free weekly newswire

Sign up to receive all our latest news direct to your inbox.

Physics on film

physicsworld.com's multimedia channel features exclusive video interviews with leading figures in the physics community.

Visit our multimedia channel to see the latest video.

Share this

Blog

Satellite images show the effect of the L’Aquila earthquake

lquila.jpg
Earthquake shockwaves (credit: IREA-CNR)

By Michael Banks

Researchers have released the first satellite images showing the effect of the L’Aquila earthquake that struck central Italy earlier this month.

Measuring 6.3 on the Richter scale, the earthquake killed over 290 people with an epicentre only a few kilometres away from the Gran Sasso National Laboratory located between L’Aquila and Teramo, which is best known for studying the properties of neutrinos and searching for dark matter.

Scientists at the Instituto per il Rilevamento Elettromagnetico dell’ Ambiente in Napoli have now started analysing data taken from the Environmental Satellite (Enivsat) operated by the European Space Agency (ESA).

Launched in 2001, Enivsat carries ten instruments for Earth observation, which can measure, for example, sea surface temperatures and the amount of sunlight transmitted, reflected and scattered by the Earth’s atmosphere.

Enivsat’s on board radar can detect changes in the Earth’s surface with millimetre accuracy. Data taken just after the earthquake on 6 April and compared to an image made a few months before show a set of nine fringes originating a few kilometres from L’Aquila.

Each fringe on this ‘interferogram’ represents a ground movement of 2.8 cm, meaning the ground moved by 25 cm at the centre of the earthquake a few kilometres from L’Aquila.

The results from Envisat have also been confirmed by the movement of five GPS receivers located around the affected area that were moved as a result of the earthquake.

ESA is also making the satellite’s data taken in the L’Aquila region freely available for scientists to analyse, which is available to download here.


TrackBack

TrackBack URL for this entry:
http://www.iop.org/mt4/mt-tb.cgi/2988

Comments (1)

  • 1 Earthquake Nov 11, 2009 10:18 AM

    i want to know what software to analyze this satellite data.this is like topography earth surface.this layout it's very good but i think this layout need to add notes about colour meaning or grid layer.thanks