Deep learning could hold the key to making sense of proton collisions generated in the world’s premier particle accelerator. That is the message from physicists in Europe and the US who have shown how an algorithm developed for language translation can efficiently filter out noise from data taken by detectors at CERN’s Large Hadron Collider. The algorithm could give physicists the best chance of discovering exotic new particles once the LHC has been upgraded.
The LHC slams protons together at incredibly high energies in order to generate a range of massive particles. This could include hypothetical particles not described by the Standard Model of particle physics – the discovery of which is a primary goal of the collider.
The LHC actually collides bunches containing billions of protons in order to ensure a reasonable chance that at least one proton from one bunch will interact with a proton in the other bunch. One major challenge in interpreting collider data is distinguishing the particles produced by (sought-after) head-on collisions from those resulting from glancing blows. The latter, known as pile-up, mainly consist of pions that end up dotted around the detector and make it harder to establish the presence of any new particles.
Pile-up is set to become a particular problem in the next few years as the LHC’s collision rate is ramped up. From 2027, the High-Luminosity LHC set to generate around 200 pile-up events per bunch collision, about an order of magnitude more than it was turning out five years ago.
Tracing back
Physicists have devised several ways to focus on interesting collisions. One simple approach is to consider the tracks left by charged particles as they travel through a detector, and only keep events with tracks that trace back to head-on collisions – originating from what is known as the primary vertex.
A more sophisticated alternative known as PUPPI does this as well as sifting through neutral particles produced in the collider. It does so by establishing the provenance of the charged particles around each neutral particle and then calculating the probability that the latter originated at the primary vertex given its relationship with the former.
In the latest work, Benedikt Maier of CERN, Siddharth Narayanan at Flagship Pioneering and colleagues set out to achieve the same end using machine learning. Whereas PUPPI relies on step-by-step calculations to directly establish whether certain particles originate from the primary vertex, the algorithm in this case – an advanced type of neural network that the researchers dub PUMA – learns the relationship between particle properties and collision origin after being trained with a dataset comprising multiple input-output pairs.
This is not the first artificial neural network devised to try and deal with the problem of pile-up at the LHC. In 2017, for example, Matthew Schwartz of Harvard University in the US and colleagues reported having designed a so-called convolutional neural network to clean-up the output from the ATLAS and CMS detectors expressed in the form of images – the intensity of each pixel representing particles’ energy distribution. By teaching the network to associate images of all neutral particles with the corresponding ones showing just neutral particles from the primary vertex, they found that the algorithm could then generate cleaned-up images when fed fresh noisy data at its input.
Transformer algorithm
According to Maier, however, this and other machine-learning-based methods rely on results from PUPPI as part of their input. PUMA, in contrast, removes pile-up simply based on raw detector data. It does so using an algorithm known as a transformer, which was designed to convert a phrase in one language to the equivalent phrase in another language. Re-purposed for particle physics, it instead transforms data representing a series of particles from a collision event into a sequence of numbers between 0 and 1 – the probabilities that each respective particle comes from the primary vertex.
Whereas other machine translators tend to focus only on a word’s nearest neighbours when working out the meaning of a string of words, transformers also account for links between words spaced further apart. They do so by analysing a process known as attention, which involves representing a word as a vector of features, multiplying that vector by certain matrices and then combining the outcome of those calculations with the equivalent from another particle via the dot-product function.
PUMA, which stands for Pile-Up Mitigation using Attention, does likewise by encoding each particle as a vector comprising parameters such as particle type, energy and angle. It then uses the attention process to generate a new set of vectors that reflect each particle’s relationship with the other particles, and feeds these vectors into a simple neural network that distills the information into one numerical value per particle – the origin probabilities. By training the network using input vectors tied to known binary probabilities, the difference between the calculated and expected outputs can be used to iteratively tweak the attention matrices so that in future the algorithm can recognize whether or not fresh raw data correspond to particles from the primary vertex or from pile-up.
Detector snapshots
The researchers trained their network with 200,000 “detector snapshots”, which they generated using a simulation of the CMS produced by the DELPHES computer program. Each snapshot comprises the remnants of one main proton collision and around 140 glancing blows. This amounts to about 5000 particles per snapshot and therefore one billion input vectors and associated probabilities overall. They then used further simulation data to compare the performance of PUMA with classical algorithms such as PUPPI. In particular, they focussed on transverse momentum – which is zero when the colliding protons fly towards one another and should remain so after the collision once all extraneous particles have been removed from the data.
The researchers found that calculations of net transverse momentum based on PUMA pile-up removal got closer to the best-case scenario – simulated samples without pile-up – than did those based on removal by the other pile-up algorithms. They now plan to test PUMA using real data from one specific sub-detector to be installed in CMS. However, Maier points out that, for all its improvement over rival schemes, the new algorithm remains significantly at odds with the best-case scenario. “It is for future research to see what is missing still in the model,” he says.
Matteo Cacciari of Université Paris Cité in France, who was not involved in the latest research, welcomes the “excellent results”, pointing out that by design machine learning makes use of a much wider range of information than conventional techniques. But he adds that it is also harder to understand exactly where this and other neural networks get their “discriminating power” from, making it difficult, he argues, to spot any unwanted biases in the algorithm. “In science it’s always better to understand something as extensively as possible,” he says.
Two researchers in China have shown how unwanted quantum tunnelling in field-effect transistors (FETs) could be suppressed by controlling the lattice orientations of materials used in the devices. Using machine learning to analyse thousands of candidate orientations, Ye-Fei Li and Zhi-Pan Liu at Fudan University in Shanghai identified two stable configurations that minimize tunnelling. Their research could allow further device miniaturization, which is limited by the negative effects of tunnelling.
FETs are key components of most modern computers and electronics. In many existing designs, a silicon semiconductor channel is covered by insulating silicon dioxide and then by a gate electrode. The channel’s conductivity is controlled by the gate electrode, which applies a voltage perpendicular to the current flow through the channel. By varying the voltage, the current in the channel can be switched on and off.
As manufacturing techniques have improved, FETs have steadily reduced in size. This is famously described by Moore’s law, which says that the number of transistors that can fit on a computer chip doubles roughly every two years. However, as FETs approach nanometre channel lengths, quantum physics looks set to wreak havoc with further miniaturization.
Tunnelling carriers
One problem is that the insulating layer that separates the gate from the channel will become so thin that charge carriers can quantum mechanically tunnel between the gate and channel – thwarting the FET’s operation. So minimizing tunnelling at this interface will play an important role in further miniaturization.
Silicon and silicon dioxide have different crystal structures. This means that atoms at the interface between the two materials can adopt a range of different structures depending on the relative orientation of the silicon and silicon dioxide crystals. Some of these interface structures will encourage tunnelling, while others will suppress it.
In their study, Li and Liu examined how tunnelling is affected by interface structure. Using machine learning, they generated close to 2500 possible structures, and assessed how appropriate they would be for use in FETs. They found that only 40 configurations repeated themselves every nanometre, which was their target length for a channel. Of these, only 10 structures were energetically stable. When the ability to suppress tunnelling was considered, only two candidate structures remained.
The duo hopes that their findings will allow engineers to further shrink FETs, while minimizing the effects of tunnelling. They also point out that their approach is general and can be applied to materials beyond silicon and silicon dioxide so it could help improve the designs of transistors made of other semiconductors such as gallium nitride and silicon carbide.
Female scientists are less likely than men to be authors on papers despite having contributed towards the work. That is according to a new study published today in Nature by researchers in the US, who say that the findings may help to account for differences in the observed output of male and female scientists.
It is well documented that fewer female scientists are named on scientific papers than men and have fewer patents than their male counterparts. But it is not well understood if this is due to a disparity in actual contributions or more about how much recognition different scientists receive for their work. This is a difficult question to answer, however, given how hard it is to study the absence of names in author lists – in essence, data that is not there.
To combat this issue, the authors, led by economist Julia Lane from New York University, looked at the administrative records from the Institute for Research on Innovation and Science at the University of Michigan. This included 128,859 individuals who worked on 9778 research teams from 2013 to 2016.
They examined 39,426 journal articles and 7675 patents produced by these teams, finding that despite making up about 48% of the workforce, women comprise only 35% of the team members who are named as authors. Furthermore, by considering data on the job titles of individuals, the researchers found that women are less likely to receive authorship credit at every stage of their career.
Since our findings suggest that there is a remarkably strong gap at all levels and in all fields, it may result in young women leaving science
Julia Lane
The study also analysed data from surveys of scientists and found that female scientists are more likely to report being excluded from authorship on a paper that they had directly worked on. Out of 2660 survey responses, 43% of women reported experiencing this, compared with 38% of men.
Developing standards
The patterns occurred consistently across all scientific disciplines. The paper compares “potential authorships”, or the set of individuals working on a team one year prior to the publication of an article by that team, with “actual authorships” – the set of individuals who were listed as authors on those articles. In the physical sciences, for example, the share of actual female authorships was found to be some 14 percentage points lower than their share of potential authorships.
These disparities could help to explain why there are fewer women in senior scientific positions. “There is evidence in other fields that if workers are not given a voice they tend to exit,” Lane told Physics World. “Since our findings suggest that there is a remarkably strong gap at all levels and in all fields, it may result in young women leaving science.”
The researchers believe that there are several factors that could lead to the observed disparities in attribution. This includes differences in propensity towards self-promotion as well as lab principal investigators lacking explicit and consistent rules for determining who qualifies for co-authorship.
The authors therefore suggest that funding agencies and universities could consider developing explicit standards for co-authorship and encourage team members to speak up if they think contributions are being overlooked.
Study co-author Britta Glennon from the University of Pennsylvania also says that principal investigators could receive training as lab managers. “[They] are not trained to pay attention to this kind of aspect of managing a lab – and attribution is part of lab management,” she adds.
How much is enough? How much is too much? These are questions that cut to the heart of a complex issue currently preoccupying senior medical physicists when it comes to the training and continuing professional development (CPD) of the radiotherapy physics workforce. What’s exercising management and educators specifically is the extent to which the core expertise and domain knowledge of radiotherapy physicists should evolve to reflect – and, in so doing, best support – the relentless progress of artificial intelligence (AI) and machine-learning technologies within the radiation oncology workflow.
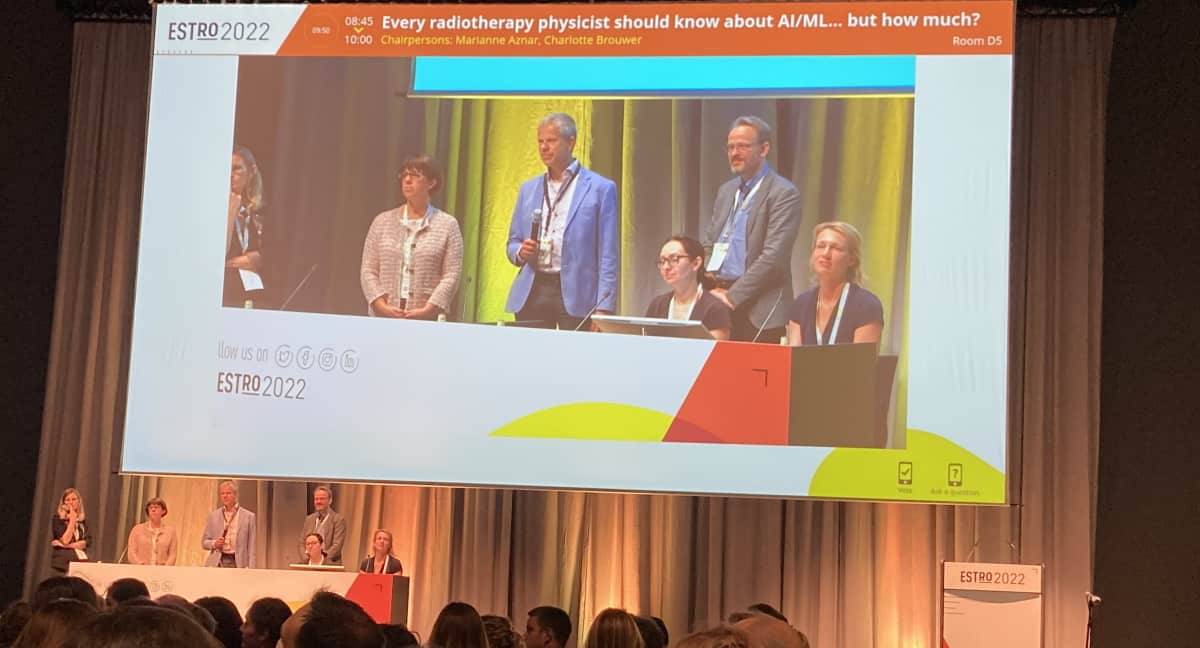
In an effort to bring a degree of clarity and consensus to the collective conversation, the ESTRO 2022 Annual Congress in Copenhagen last month featured a dedicated workshop session entitled “Every radiotherapy physicist should know about AI/machine learning…but how much?” With several hundred delegates packed into Room D5 at the Bella Center, speakers were tasked by the session moderators with defending a range of “optimum scenarios” to align the know-how of medical physicists versus emerging AI/machine-learning opportunities in the radiotherapy clinic.
Just the basics or just the opposite?
Kicking off the debate was Wilko Verbakel, a senior medical physicist and associate professor at Amsterdam UMC in the Netherlands, who posited a light-touch response to the session’s headline question. The priority for medical physicists, he argues, is to work closely with the manufacturers of machine-learning software to surface more technical information – with a focus not on the algorithms, but rather on the data used for training and implementation of those algorithms.
“What we need to know – just the basics,” explained Verbakel. “[That means], what type of data [are] used for training the machine-learning algorithms? Where [do] the data come from geographically? And is the distribution of patient data well chosen for the patient population in your own centre?” He concedes, though, that the manufacturers can – and should – do a lot more to share the data used to train their proprietary algorithms. “In any case, we must test performance [of the machine-learning model] on our own datasets and ask how well does it compare.”
Pitch perfect: Speakers at ESTRO 2022 make their case on education and training requirements to support AI/machine-learning innovations in radiotherapy. From left to right (standing): Charlotte Robert, Cristina Garibaldi, Wilko Verbakel and Carsten Brink. (Courtesy: Joe McEntee)
A contrasting take – arguing that every radiotherapy physicist should also be a fully skilled data scientist – was elaborated by Charlotte Robert, an associate professor of medical physics at the Gustave Roussy Cancer Campus in Villejuif, France. Robert’s position acknowledges that AI and machine-learning technologies are already pervasive within today’s radiotherapy workflow, with applications spanning synthetic image generation, autocontouring, accelerated dosimetry, automated patient QA and real-time plan adjustment, among others.
When commissioning AI/machine-learning software, notes Robert, it is therefore vital for medical physicists to understand the technical specifications of new products in order to implement robust methodologies for solution acceptance. “This is really important for you to do your job properly,” she explained, “[as is] proposing intelligent data sets to test the algorithm under exhaustive conditions with the objective of identifying outliers.”
More broadly, Robert advocates the creation of tailored education programmes – for example, dual-skill training courses, starting at Master’s level – that integrate the granular detail and subtleties of AI/machine learning into the core medical physics curriculum. “The positive aspects of this change will enable many new skills in programming, data management and data engineering to stay in the loop,” she added.
Education, education, education
When the talking stopped, a show-of-hands audience vote suggests the consensus view of ESTRO delegates lies somewhere along a continuum between the positions elaborated by Verbakel and Robert (whose presentations opened and closed the workshop respectively). A case in point is the pitch presented by Cristina Garibaldi from the European Institute of Oncology (IEO) in Milan, Italy, advocating integration of AI-oriented education and training as standard for national medical physics curricula across Europe.
The medical physics expert (MPE), argues Garibaldi, has a pivotal role to play in driving the safe and efficient clinical implementation of AI/machine-learning technologies. “What is especially important,” she noted, “is for the MPE to have a basic knowledge of all the workflows for the development and application of machine-learning models. [In other words], data selection and management; model selection and regularization; model training; and finally model validation.”
At the same time, cross-disciplinary collaboration underpins successful exploitation of AI/machine learning in the clinic. Owing to their skills in mathematics, computing and statistics, adds Garibaldi, MPEs are in a position to act as a bridge between radiation oncologists, software vendors, data scientists and engineers. In this way, she noted, “While most clinical MPEs will not be involved in developing AI solutions [per se], they will need to understand how machine-learning models are configured, how to validate their performance, and how to design appropriate QA tests.”
Garibaldi, for her part, heads up the taskforce – working under the auspices of ESTRO and the European Federation of Organizations for Medical Physics (EFOMP) – that earlier this year unveiled a new core training curriculum for MPEs in radiotherapy. The revamped guidance addresses a host of emerging clinical applications, among them MR/RT, FLASH radiotherapy and personalized treatments, as well as AI-enabled automation and methods for advanced quantitative data analysis in machine learning.
The broadened scope of the ESTRO/EFOMP document reflects the fact that AI fundamentally changes the day-to-day practice of MPEs, while providing a framework for European countries to shape their national training and CPD programmes in response to the latest technology innovations in AI/machine learning. Garibaldi concluded: “To overcome the weakness of limited AI knowledge, potentially threatening the role of MPEs, AI should be integrated in medical physics education programmes through dedicated teaching and training courses in hospitals.”
The last word, though, goes to Carsten Brink, professor of medical physics at the University of Southern Denmark in Odense, who argued that “a bit more than the basics, enough so you can communicate with an independent expert” is how the medical physics community should address its current knowledge gap in AI/machine-learning technologies.
“Should all of us be skilled in data science – I don’t think so,” Brink concluded in his take-home message. “We have a huge tradition of collaborating between different knowledge bases – oncologists, medical physicists and so on. And why are we collaborating? Because we are utilizing each other’s skills – so don’t spend all your time becoming a full data scientist.”
AI in Medical Physics Week is supported by Sun Nuclear, a manufacturer of patient safety solutions for radiation therapy and diagnostic imaging centres. Visit www.sunnuclear.com to find out more.
The golden death mask of the pharaoh Tutankhamun is one of the most famous historical artefacts in the world. The shining visage of the young king dates back to around 1325 BCE and features blue strips that are sometimes described as lapis lazuli. Yet rather than being the semi-precious stone favoured in ancient Egypt, the striking decoration is in fact coloured glass.
A coveted and highly prized material deemed worthy of royalty, glass was once viewed on a par with gemstones, with examples of ancient glass going back even further than Tutankhamun. Indeed, samples excavated and analysed by archaeologists and scientists have enabled a better understanding of how and where glass production began. But surprisingly, ancient glass is also being studied by another group of scientists – those who are finding safe ways to store nuclear waste.
Next year the US will start to vitrify parts of its legacy nuclear waste currently housed in 177 underground storage tanks at the Hanford Site, a decommissioned facility in Washington state that produced plutonium for nuclear weapons during the Second World War and Cold War. But the idea to transform nuclear waste into glass, or vitrify it, was developed as far back as the 1970s, as a way to keep the radioactive elements locked away and prevent them from leaking out.
Nuclear waste is typically classified as being low, intermediate or high level, depending on its radioactivity. While some countries vitrify low and intermediate-level waste, the method is mostly used to immobilize high-level liquid waste, which contains fission products and transuranic elements with long half-lives that are generated in a reactor core. This type of waste requires active cooling and shielding because it is radioactive enough to significantly heat both itself and its surroundings.
Before the vitrification process, liquid waste is dried (or calcined) to form a powder. This is then incorporated into molten glass in huge smelters and poured into stainless steel canisters. Once the mixture has cooled and formed a solid glass, the containers are welded closed and readied for storage, which nowadays takes place in deep underground facilities. But the glass does not just provide a barrier, according to Clare Thorpe, a research fellow at the University of Sheffield, UK, who is studying the durability of vitrified nuclear waste. “It’s better than that. The waste becomes part of the glass.”
The glass does not just provide a barrier. It’s better than that. The waste becomes part of the glass
Clare Thorpe, University of Sheffield, UK
However, there have always been question marks over the long-term stability of these glasses. How, in other words, can we know if these materials will remain immobilized over thousands of years? To better understand these questions, nuclear-waste researchers are working with archaeologists, museum curators and geologists to identify glass analogues that might help us understand how vitrified nuclear waste will change with time.
Ingredient sweet spot
The most stable glasses are made from pure silicon dioxide (SiO2), but various additives – such as sodium carbonate (Na2CO3), boron trioxide (B2O3) and aluminium oxide (Al2O3) – are often incorporated to change the properties of the glass, such as viscosity and melting point. For example, borosilicate glass (containing B2O3) has a very low coefficient of thermal expansion, so does not crack under extreme temperatures. “The UK and other countries, including the US and France, have chosen to vitrify their waste in borosilicate glass before it’s stored,” explains Thorpe.
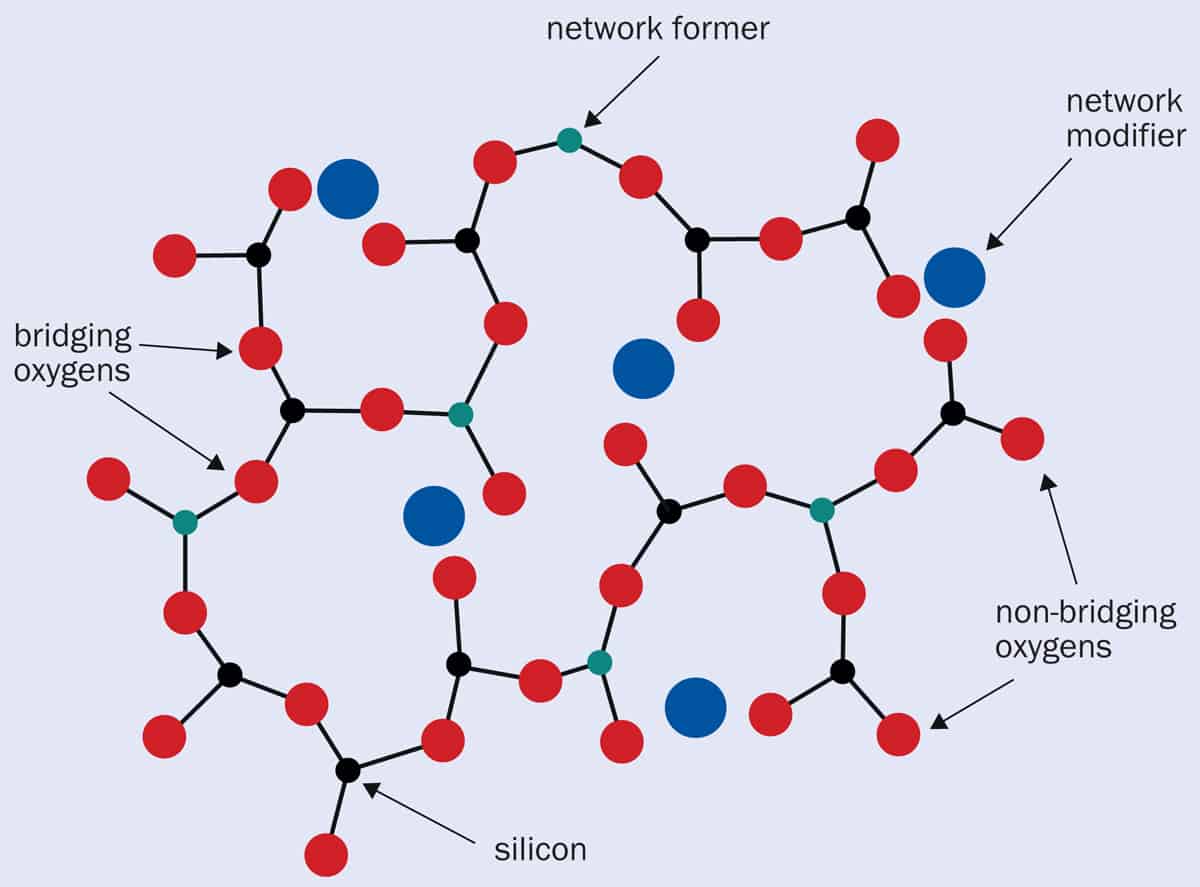
When elements such as those from additives or nuclear waste are included, they become part of the glass structure as either network formers or modifiers (figure 1). Network-forming ions act as a substitute for silicon, becoming an integral part of the highly cross-linked chemically bonded network (boron and aluminium do this for example). Meanwhile, modifiers interrupt the bonds between oxygen and the glass-forming elements by loosely bonding with the oxygen atoms and causing a “non-bridging” oxygen (sodium, potassium and calcium incorporate this way). The latter cause weaker overall bonding in the material, which can reduce the melting point, surface tension and viscosity of the glass overall.
1 Formers and modifiers When an additive is incorporated into a glass mixture, the ions either become part of the highly cross-linked network, replacing the silicon (black dots) as network formers (green dots), or act as glass modifiers (blue dots) that loosely bond with the oxygen (red dots) and disrupt the glass-forming bonds, creating “non-bridging” oxygens. (Adapted from Clinical Applications of Biomaterials 10.1007/978-3-319-56059-5_2)
“There’s a certain sweet spot where you get the right amount [of waste additives] to form a very durable glass,” explains Carolyn Pearce from the Pacific Northwest National Laboratory in the US, who is studying the kinetics of radionuclide stability in waste forms. “If you add in too much, you start pushing the system to form crystalline phases, which is problematic, because then you have multi-phase glass, which is not as durable as a homogeneous single-phase glass.”
Pearce says the waste at Hanford contains “virtually every element in the periodic table in some form or another” and is stored as a liquid, sludge or salt cakes, which makes it more difficult to predict the most stable glass composition. “There’s a lot of modelling that goes into designing the glass-forming elements that will be added. They’ll characterize what’s in the staging tank waiting to go in the facility, and then design the composition of the glass based on that chemistry.”
The use of vitrification for nuclear waste is supported by the stability of natural glasses that have been around for millennia, such as igneous glass, fulgurites (also known as “fossilized lightning”) and glass in meteorites. “In theory, radioactive elements should be released at the same rate as the glass itself dissolves, and we know that glass is highly durable, because we can see volcanic glasses that were made millions of years ago still sitting around today,” says Thorpe. But it isn’t easy to prove that vitrified waste will survive the 60,000 to millions of years necessary for radioactive waste to fully decay – iodine-129, for example, has a half-life of more than 15 million years.
When glass is in contact with water or water vapour, it begins to very slowly deteriorate. First, the alkali metals (sodium or potassium) leach out. The glass networks then start to break down, releasing silicates (and also borates in the case of borosilicate glass) that subsequently form an amorphous gel layer on the glass surface. This becomes dense over time, creating an outer “passivation” layer that can also contain secondary crystallized phases – compounds that form from the surface recrystallization of material that has been released from the bulk glass. At this point, further corrosion is limited by the ability of elements to migrate through this coating.
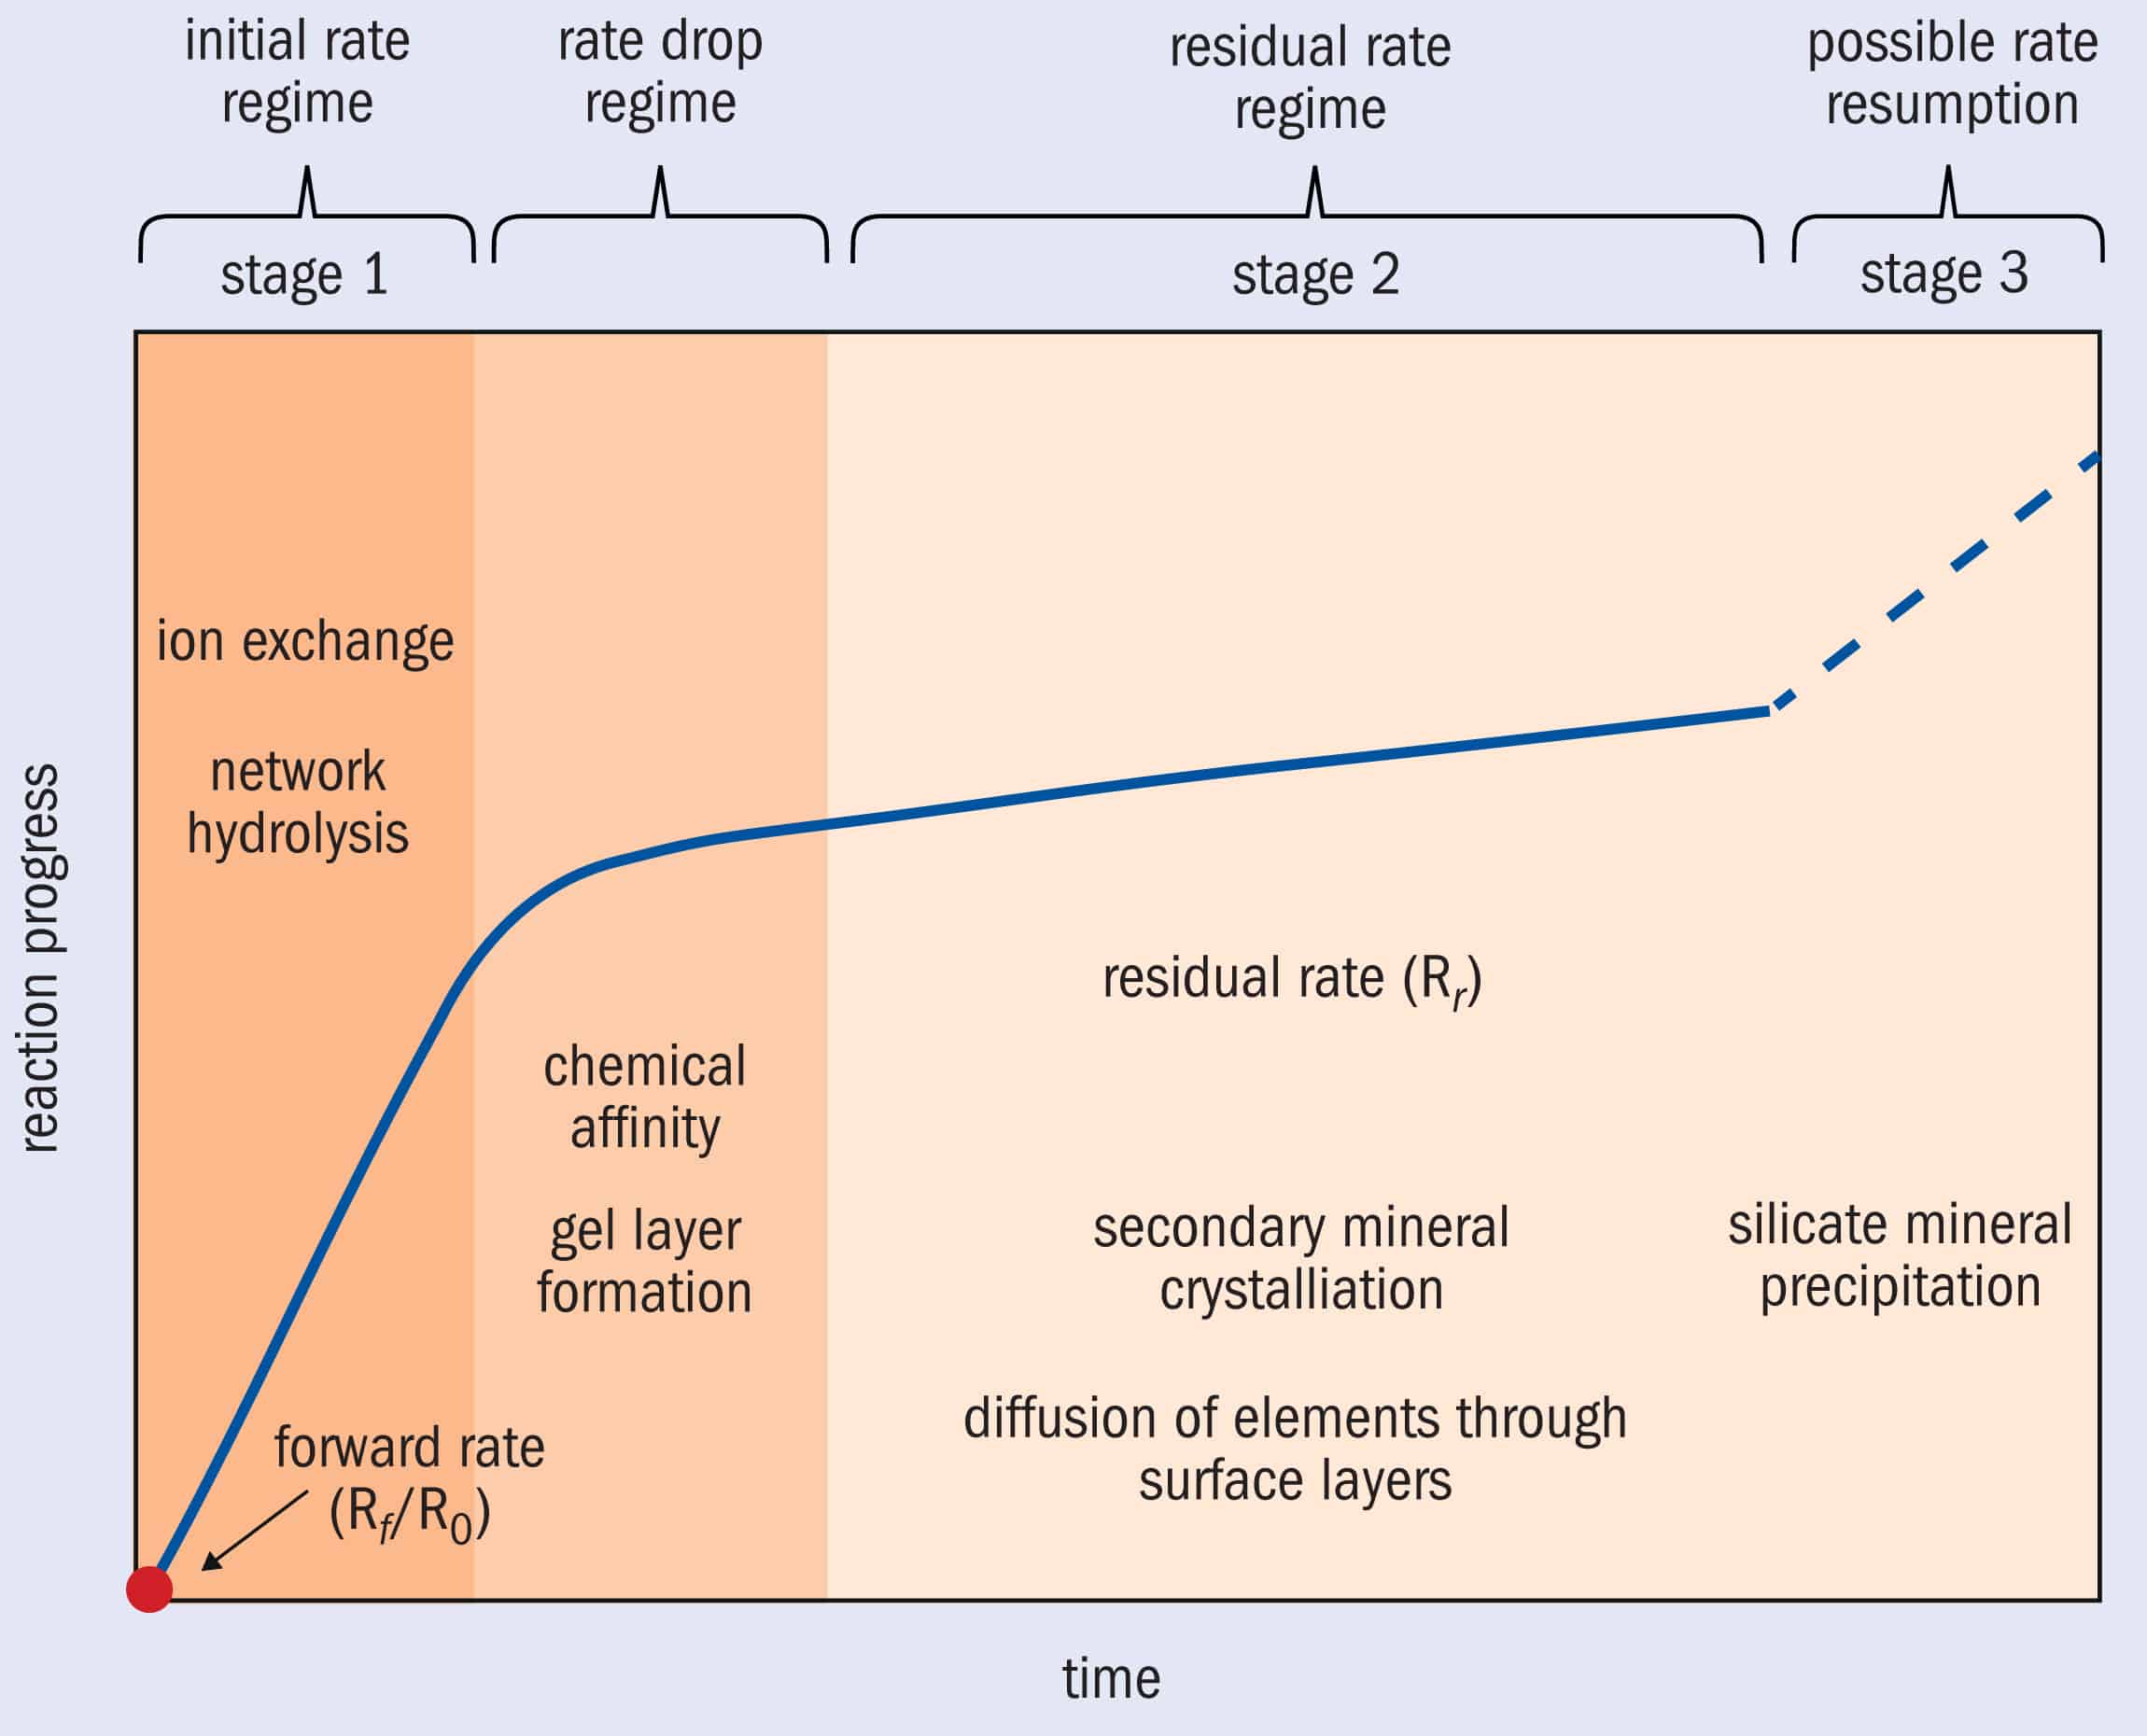
But if conditions change, or certain mineral species are present, the passivation layer can break down too. “Studies have highlighted elements of concern that could be involved in something called rate resumption, which is where some of the secondary mineral precipitates – particularly iron and magnesium zeolites – have been implicated in the rate of glass dissolution speeding up,” explains Thorpe (figure 2).
2 Stages of corrosion Glass corrosion occurs in three stages. Stage 1 – The “initial rate regime” involves H3O+ ions diffusing into the glass, displacing network-modifying alkali ions. At the same time, hydrolysis of the glass network releases silicon and other network-forming ions if present. The “rate drop regime” begins once sufficient silica has been freed to form an amorphous gel layer on the glass surface. Stage 2 – The gel “passivation” layer – which densifies over time and can crystallize into secondary mineral phases – slows the rate of dissolution as the ions have to diffuse through it to corrode the glass. This “residual rate regime” can continue indefinitely. Stage 3 – Finally, “rate resumption” occurs if conditions change or certain mineral species are present, such as iron, and the passivation layer breaks down. (Adapted from original by Clare Thorpe)
One of the methods Thorpe and Pearce use to understand these mechanisms is accelerated testing of newly formed glass. “In the laboratory, to speed up the reaction we [flatten] the glass to increase the surface area, and we increase the temperature, typically up to 90 °C,” says Thorpe. “This is really effective for ranking glasses – saying this one’s more durable than this one – but not great for determining the actual dissolution rate in a complex natural environment.”
Instead, researchers have turned to analogue glasses already in existence. “Borosilicate glasses have only been around for about 100 years. We have some data on how they behave long term, but nothing stretching out to the kinds of timescales that we need for thinking about radioactive waste storage,” says Thorpe. Natural glasses are not always a suitable comparison as they tend to be low in alkali elements, which are commonly found in nuclear-waste glasses and will impact their properties – so the other option has been archaeological glasses. While their compositions are not identical to waste glass, they do contain a variety of elements. “Just having these different chemistries really allows us to look at the role that this plays in terms of alteration,” says Pearce.
Glass from the past
Before discovering how to create glass, humans used natural glass for both its strength and beauty. One example is the pectoral, or brooch, found in the tomb of Tutankhamun. Placed on the chest of the mummy, it contains a piece of pale-yellow natural glass shaped into a scarab beetle at least 3300 years ago. The glass came from the Libyan desert, with recent research attributing its formation to a meteorite impact 29 million years ago. Scientists reached this conclusion because of the presence of zirconium silicate crystals within the glass, which come from the mineral reidite that is formed at high pressure (Geology47 609).
“The earliest production of glass on a regular basis is around 1600 BCE,” says Andrew Shortland, an archaeological scientist at Cranfield University in the UK. “The most spectacular glass object of all, without doubt, is the death mask of Tutankhamun in the Cairo [Museum] catalogue.”
Over the last century archaeologists have disagreed over where glass was first manufactured on a large scale, with northern Syria and Egypt both being prime candidates. “I’d say that at the moment it is too close to call,” says Shortland. The glasses excavated are soda-lime silicate glasses – not too different to the glass we still use in our windows. These were produced using silicate minerals with a “flux” containing soda (Na2CO3), which lowers the melting point to an attainable smelting temperature, and lime (CaCO3) to make the glass harder and chemically more durable. “The silica in these early glasses comes from crushed quartz, which was used because it’s very clean, very low in iron, titanium and other things that colour the glass.”
The problem of glass corrosion is familiar to archaeological conservators who aim to stabilize glass when freshly excavated or stored in museums. “Moisture, obviously, is the worst thing for glass,” says Duygu Çamurcuoğlu, senior objects conservator at the British Museum in London. “If not looked after well, moisture will start attacking and dissolving the glass.” Çamurcuoğlu explains that the beautiful iridescent surface archaeological glasses display is often made up of nearly 90% silicate because other ions, particularly the alkali ions, will have been removed by corrosion.
Archaeological analogues
The key to using archaeological glasses as an analogue for vitrified nuclear waste is having a good knowledge of the environmental conditions the objects have experienced. Trouble is, that gets harder the older the glass is. “Something that’s 200 years old might actually be more useful,” explains Thorpe, “because we can pin down exactly the full climate records.” By comparing archaeological samples to vitrified waste, Thorpe and colleagues are able to validate some of the mechanisms they are seeing in their accelerated high-temperature testing, thereby confirming whether or not they have similar processes and minerals forming, and that there’s nothing they’ve overlooked.
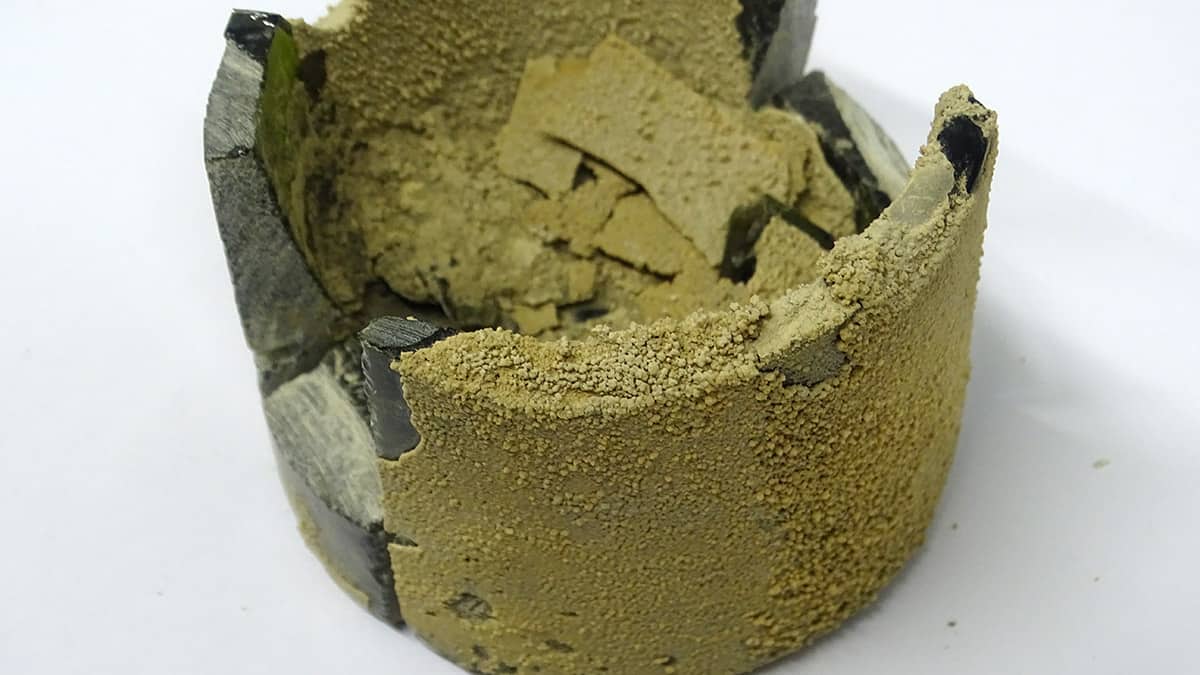
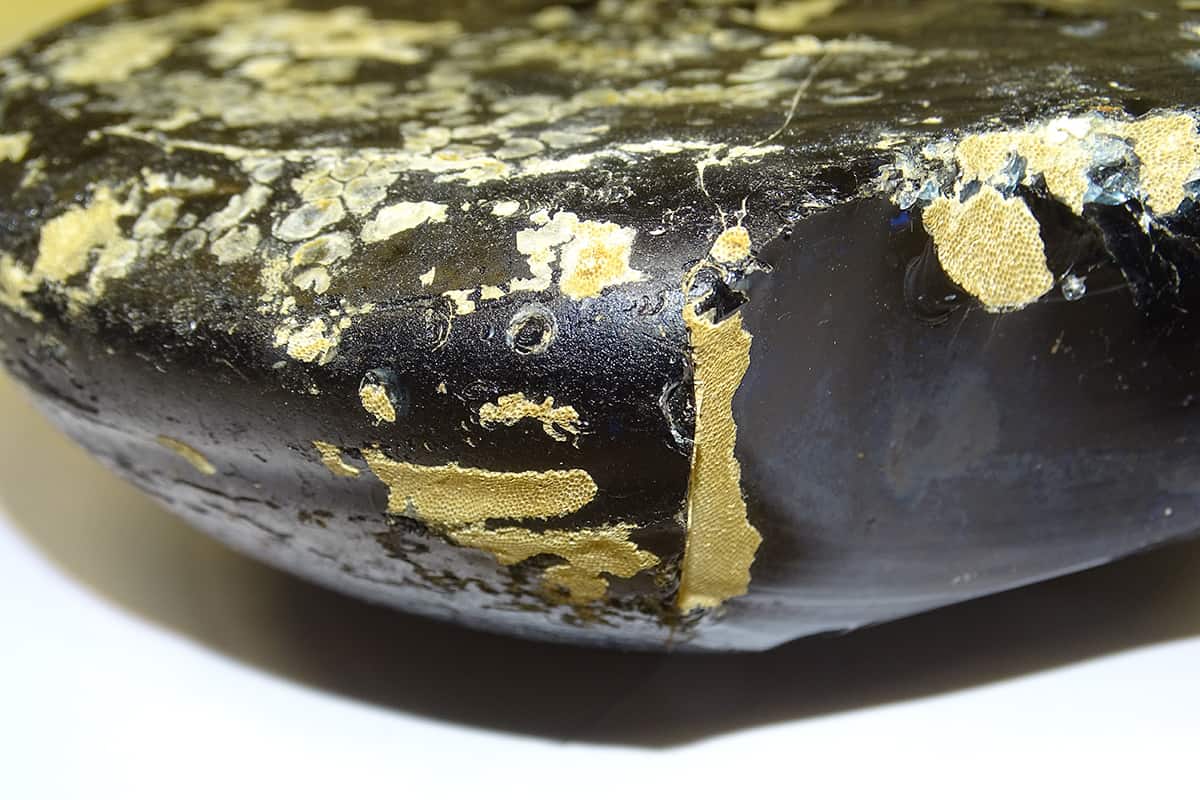
(Courtesy: Dr Clare Thorpe)Calculating corrosion These and many more 256-year-old glass ingots were found in a shipwreck off the coast of Margate, UK. We have 200 years of records of the local water temperatures and salinity, which makes it easier to use as a comparison to nuclear waste glasses. (Courtesy: Dr Clare Thorpe)
In Shortland’s experience, the precise local environmental conditions can make a big difference to the length of time glass survives. He remembers using scanning-electron microscopy to analyse glass from the Late Bronze Age city of Nuzi, near Kirkuk in Iraq, originally excavated in the 1930s. “We noticed that some of the glass was perfectly preserved, had beautiful colour, and was robust, while other pieces were weathered and gone completely.” But, he explains, the samples were often found in the same houses in nearby rooms. “We were dealing with micro-environments.” A minor difference in the amount of moisture over 3000 years created very different weathering patterns, as they found (Archaeometry60 764).
Of course, the sort of glass artefacts found in Nuzi or elsewhere are much too precious to be given to nuclear-waste scientists for testing, but there are many less-rare pieces of archaeological glass available. Thorpe is looking at several well-characterized archaeological sites where material may provide useful analogues, such as slag – the silicate-glass waste product formed during iron smelting. Slag blocks had been incorporated into a wall at the Black Bridge foundry, a site within the town of Hayle in Cornwall, UK, constructed around 1811 (Chem. Geol.413 28). “They’re fairly analogous to some of the plutonium-contaminated material when they are vitrified,” she explains. “You can be sure that they’ve been exposed to either the air or the estuary that they’ve sat in for 250 years.” She has also investigated 265-year-old glass ingots from the Albion shipwreck off the coast of Margate, UK, where there are comprehensive records of water temperatures and salinity dating back 200 years.
Thorpe and others have also been considering the impact of metals on glass stability. “We’re very interested in the role of iron as it’s going to be present because of the canisters [holding the vitrified waste]. In the natural analogue sites, it’s present because a lot of the time the glass is in soil or, in the case of the slags, surrounded by iron-rich material.” The worry is that positive iron ions, leaching from the glass or surroundings, scavenge negatively charged silicates from the glass’s surface gel layer. This would precipitate out iron silicate minerals, potentially disrupting the passification layer and triggering rate resumption. This effect has been seen in a number of laboratory studies (Environ. Sci. Technol.47 750) but Thorpe wants to see it happening in the field at low temperatures because the thermodynamics are very different to accelerated testing. So far, they don’t have evidence that this is occurring with vitrified nuclear waste and are confident that with or without the presence of iron, these glasses are highly durable. But it is still important to understand the processes that might affect the rate at which corrosion happens.
A biological challenge
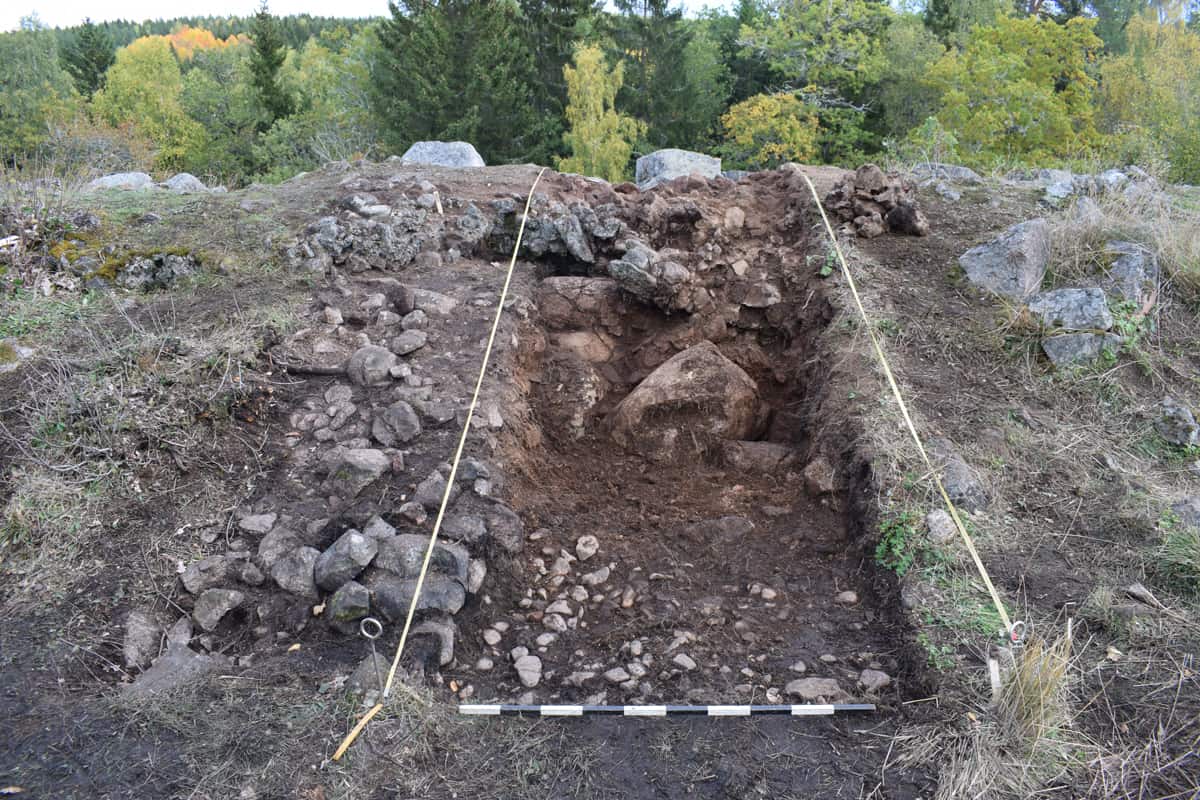
An analogue glass that Pearce and colleagues have been studying comes from the Broborg pre-Viking hillfort in Sweden, which was occupied around 1500 years ago. It contains vitrified walls that Pearce thinks were purposefully constructed, rather than being the results of accidental or violent destruction of the site. The granite walls were strengthened by melting amphibolite rocks that contain largely silicate minerals, to form a vitrified mortar surrounding the granite boulders. “We know exactly what’s happened to the glass in terms of what temperatures it’s been exposed to, and the amount of rainfall, through records in Sweden going back those 1500 years,” says Pearce.
Glass walls An archaeological dig at the Broborg pre-Viking hillfort in Sweden has revealed walls fortified by melting silicate-containing rock to form a glass mortar around the granite. (Courtesy: Mia Englund, The Archaeologists)
Using electron microscopy to study the Broborg glass, the researchers were surprised to find the surface exposed to the environment covered in bacteria, fungi and lichens. Pearce’s team is now trying to understand the implications of such biological activity on the glass’s stability. The site contains several different glass compositions and they found that samples with more iron showed more evidence of microbial colonization (possibly due to the larger number of organisms able to metabolize iron) and more evidence of physical damage such as pitting.
While it seems as though certain organisms can thrive in these harsh conditions, and may even extract elements from the material, Pearce explains that it’s also possible that a biofilm provides a protective layer. “The bacteria like to live in relatively unchanging conditions, as all living organisms are engaged in homeostasis, and so they try to regulate the pH and the water content around them.” Her team is now trying to determine what role the biofilm plays and how that relates to the glass composition (npj Materials Degradation5 61).
Living layer Scanning electron microscopy of the naturally created glass used to fortify walls at the Broborg pre-Viking hillfort in Sweden reveals that the exposed surface of this glass is covered in micro-organisms, with more microbes where the iron content is higher. (Courtesy: Bruce Arey, PNNL)
The key problem faced by those looking to create the most stable nuclear-waste glasses is that of longevity. But for archaeological conservators trying to stabilize deteriorating glass, they have a more urgent challenge, which is to remove moisture and therefore stop the glass from cracking and shattering. Archaeological glass can be consolidated with acrylic resin, applied on top of the iridescent corrosion layer. “It’s actually [part of] the glass itself, so it should be protected,” says Çamurcuoğlu.
Despite how long we’ve been using glass, there is still a long way to go in fully understanding how its structure and composition impacts its stability. “It amazes me that we still can’t guess the melting temperature of a glass from its composition entirely accurately. Very small amounts of additional elements can have huge effects – it really is a bit of a dark art,” muses Thorpe.
Her work at Sheffield will continue, with some projects handed down to her that have been running for over 50 years. The Ballidon Quarry in Derbyshire, UK, for example, hosts one of the longest running “glass burial” experiments in the world. The aim is to test the degradation of archaeological glasses under the sort of alkaline conditions that vitrified nuclear waste will experience, alongside waste encased in cement (J. Glass Stud.14 149). The experiment is intended to run for 500 years. Whether the university itself will last that length of time remains to be seen, but as for the nuclear waste they are working to protect us from, it certainly will endure.
Optical-resolution photoacoustic microscopy: Maximum amplitude projection (MAP) images of the mouse-ear, close-up views of the regions in the green dashed boxes, and cross-sectional B-mode images of the regions shown by the blue dashed lines. (Courtesy: CC BY 4.0/J Kim et al Light. Sci. Appl. 10.1038/s41377-022-00820-w)
Photoacoustic imaging is a hybrid technique used to acquire molecular, anatomic and functional information from images ranging in size from microns to millimetres, at depths from hundreds of microns to several centimetres. A super-resolution photoacoustic imaging approach – in which multiple image frames of the target are superimposed to achieve extremely high spatial resolution – can localize very small targets, such as red blood cells or droplets of injected dye. This “localization imaging” method significantly improves the spatial resolution in clinical studies, but is achieved at the expense of temporal resolution.
A multinational research team has used deep-learning technology to dramatically increase image acquisition speed without sacrificing image quality, for both photoacoustic microscopy (PAM) and photoacoustic computed tomography (PACT). The artificial intelligence (AI)-based method, described in Light: Science and Applications, provides a 12-fold increase in imaging speed and a more than 10-fold reduction in the number of images required. This advance could enable use of localization photoacoustic imaging techniques in preclinical or clinical applications that require both high speed and fine spatial resolution, such as studies of instantaneous drug response.
Photoacoustic imaging uses optical excitation and ultrasonic detection to enable multiscale in vivo imaging. The technique works by shining short laser pulses onto biomolecules, which absorb the excitation light pulses, undergo transient thermo-elastic expansion, and transform their energy into ultrasonic waves. These photoacoustic waves are then detected by an ultrasound transducer and used to produce either PAM or PACT images.
Researchers from Pohang University of Science and Technology (POSTECH) and California Institute of Technology have developed a computational strategy based on deep neural networks (DNNs) that can reconstruct high-density super-resolution images from far fewer raw image frames. The deep-learning based framework employs two distinct DNN models: a 3D model for volumetric label-free localization optical-resolution PAM (OR-PAM); and a 2D model for planar labelled localization PACT.
Principal investigator Chulhong Kim, director of POSTECH’s Medical Device Innovation Center, and colleagues explain that the network for localization OR-PAM contains 3D convolutional layers to maintain the 3D structural information of the volumetric images, while the network for localization PACT has 2D convolutional layers. The DNNs learn voxel-to-voxel or pixel-to-pixel transformations from either a sparse or a dense localization-based photoacoustic image. The researchers trained both networks simultaneously and, as training progresses, the networks learn the distribution of real images and synthesize new images that are more similar to real ones.
To test their approach, the researchers used OR-PAM to image a region-of-interest in a mouse ear. Using 60 randomly selected frames, they reconstructed a dense localization OR-PAM image, used as the target for training and the ground truth for evaluation. They also reconstructed sparse localization OR-PAM images using fewer frames, for input into the DNNs. The imaging time for the dense image was 30 s, whereas for a sparse image using five frames, it was just 2.5 s.
The dense and DNN-generated images had higher signal-to-noise ratio and visualized vessel connectivity better than the sparse image. Notably, a blood vessel that was invisible in the sparse image was revealed with high contrast in the DNN localization-based image.
The researchers also used PACT to image the mouse brain in vivo following injection of dye droplets. They reconstructed a dense localization PACT image using 240,000 dye droplets, plus a sparse image using 20,000 droplets. The imaging time was reduced from 30 min for the dense image to 2.5 min for the sparse image. The vascular morphology was difficult to recognize in the sparse image, whereas the DNN and dense images clearly visualized the microvasculature.
A particular advantage of applying the DNN framework to photoacoustic imaging is that it is scalable, from microscopy to computed tomography, and thus could be used for various preclinical and clinical applications on different scales. One practical application could be diagnosis of skin conditions and diseases that require accurate structural information. And as the framework can significantly reduce the imaging time, it could make monitoring of brain haemodynamics and neuronal activity feasible.
“The improved temporal resolution makes high-quality monitoring possible by sampling at a higher rate, allowing analysis of fast changes that cannot be observed with conventional low temporal resolution,” the authors conclude.
AI in Medical Physics Week is supported by Sun Nuclear, a manufacturer of patient safety solutions for radiation therapy and diagnostic imaging centres. Visit www.sunnuclear.com to find out more.
Glass technologies have shaped the modern world. This video explores the cultural legacy of glass and some of its latest applications.
From bottles and windows, to spectacles, camera lenses and the fibre optics that underpin the Internet – glass influences many aspects of our lives. Yet despite its familiarity, glass still contains mysteries. Where exactly was the first glass manufactured? Why does this liquid-like material remain stable for so long? And why does a cooling liquid turn into a hard glass at all, when no distinct change in structure takes place?
White able-bodied heterosexual men working in science, technology, engineering and maths (STEM) are uniquely privileged and experience a wide range of advantages at work compared with other groups.
That is the finding of an analysis of survey data from more than 25,000 STEM professionals in the US. It also found that those advantages tend to be most pronounced compared with lesbian, gay, bisexual, transgender and queer (LGBTQ) black women, Latin American and Native American women, and people with disabilities.
Previous work has revealed that minority racial and ethnic groups, women, people identifying as LGBTQ, and those with disabilities face systematic disadvantages when working in STEM. But much of this has focused on a single aspect of inequality such as race or gender.
It is also often assumed that white, heterosexual and able-bodied men have an advantage over other groups, but little research has directly tested this idea. To do so, Erin Cech, a sociologist at the University of Michigan, analysed data from the STEM Inclusion Study, which surveyed the US-based membership of 21 STEM professional societies and organizations between 2017 and 2019. The survey included questions regarding demographics as well as work experiences and rewards.
Cultural change
Cech split the respondents into 32 intersecting demographic groups covering gender (men and women), race (Asian, Black, Latinx and Native American/Pacific Islander, and white), disability status (with and without disabilities), and LGBTQ status (LGBTQ and non-LGBTQ).
She then examined their experiences of social inclusion, harassment and professional respect as well as their average salary, opportunities for career advancement and intentions to stay in STEM.
LGBTQ black women with disabilities were found to have the most negative outcomes in all but one category. They experienced worse work-related treatment than other groups and were less likely to be planning to remain in STEM careers.
On average, LGBTQ Latinx and Native American/Pacific Islander women with disabilities had the lowest salaries. White able-bodied heterosexual men were the most advantaged group in all categories.
Getting white able-bodied heterosexual men onboard to diversity and equity goals as reflexive allies is critical to moving the needle
Erin Cech
Further analysis showed that the differences cannot be explained by factors such as education level, work commitment, family responsibilities and STEM subfields. The privileges come simply from being white, male, heterosexual and able-bodied.
Cech told Physics World that she was struck by the range of their privilege. “It’s not just a matter of [them] experiencing more inclusion with colleagues, but those advantages are evident in professional respect, career opportunities, desire to stay in their STEM long-term and even salary,” she says.
Cech says that reversing this inequality must be multifaceted, covering areas such as educational structures, support for students and STEM professionals, hiring and promotion practices, and organizational policies.
“Getting white able-bodied heterosexual men onboard to diversity and equity goals as reflexive allies is critical to moving the needle,” she adds. “[Those] who are willing to reflect on, and have open dialogue about, these forms of privilege can go a long way in making structural and cultural change in organizations and STEM professions.”
Incorporating ventilation images into radiotherapy plans to treat lung cancer could reduce the incidence of debilitating radiation-induced lung injuries, such as radiation pneumonitis and radiation fibrosis. Specifically, ventilation imaging can be used to adapt radiation treatment plans to reduce the dose to high-functioning lung.
Positron emission tomography (PET) and single-photon emission computed tomography (SPECT) scans are the gold standard of ventilation imaging. However, these modalities are not always readily available and the cost of such exams may be prohibitive. As such, researchers are investigating the feasibility of alternatives such as MR or CT ventilation imaging.
CT ventilation imaging (CTVI) uses a treatment planning 4D-CT scan to estimate ventilation in the lungs. Conventional CTVIs rely on deformable image registration (DIR) of the inhalation and exhalation respiratory phases of a 4D-CT and the application of a ventilation metric to estimate ventilation. The key benefit of this approach is that CT images are typically available from exams performed for treatment planning, thus reducing the clinical time and the costs associated with nuclear medicine ventilation imaging.
Researchers at the University of Sydney recently investigated the use of machine learning as an alternative to DIR-based methods for producing CTVIs. They successfully generated CTVIs from breath-hold CT (BHCT) image pairs within 10 s, using a laptop computer and without the need for DIR or ventilation metrics. Their achievements, described in Medical Physics, produced performance measures comparable with conventional DIR-based methods.
Lead author James Grover of the ACRF Image X Institute and colleagues examined inhale and exhale BHCT image pairs and corresponding Galligas (Ga-68 aerosol) PET image sets for 15 lung cancer patients enrolled in a previous CTVI study. They selected Galligas PET as the reference imaging modality as it offers higher resolution and sensitivity than SPECT ventilation, thereby providing high-resolution images to train the deep-learning algorithm.
Grover and colleagues trained a 2D U-Net style convolutional neural network to produce axial CTVIs, which were then assembled to provide a 3D ventilation map of the patient’s lungs. The input training images consisted of exhalation, inhalation and average BHCT images. The neural network established relationships between these axial input BHCT images and axial labelled Galligas PET images. The team employed eightfold cross-validation to measure the robustness and increase the validity of the results attained by the neural network.
The researchers qualitatively assessed the neural network-produced CTVIs by visual comparison with the Galligas PET ventilation images. They report that the CTVIs tended to systematically overpredict ventilation within the lung when compared with the Galligas PET images. Each axial CTVI slice presented a smoothness among regions of low, medium and high ventilation, which caused difficulties in predicting small pockets of high and low ventilation within the lung. In the coronal and sagittal planes, ventilation maps showed distinct jagged edges in the superior–inferior direction.
For quantitative analysis, the team calculated the Spearman correlation and Dice similarity coefficient (DSC) between each patient’s CTVI and Galligas PET image. The DSC measured the spatial overlap between three equal lung sub-volumes, corresponding to high-, medium- and low-functioning lung, as defined by ventilation.
The mean Spearman correlation across the 15 patients was 0.58±0.14 (ranging from 0.28 to 0.70), while the mean DSCs over high-, medium- and low-functioning lung were 0.61±0.09, 0.43±0.05 and 0.62±0.07, respectively, with an average DSC of 0.55±0.06. The team note that these results are comparable to prior studies on CTVI generation.
The researchers believe that the lower correlations seen for some patients are in part due to the use of a small patient dataset to train the neural network. They suggest that use of a 3D neural network would increase the Spearman correlation and DSC, as the model would be able to learn from a full patient volume instead of individual slices.
“We are planning to acquire patient ventilation images using a whole-body PET scanner to have the highest quality ground truth with which to develop the CTVI algorithms,” says Paul Keall, director of the ACRF Image X Institute. “We also hope to expand our investigations of CTVIs beyond lung cancer radiotherapy to use CTVI as a decision aid for surgical planning and early biomarker investigations across a range of respiratory diseases.”
AI in Medical Physics Week is supported by Sun Nuclear, a manufacturer of patient safety solutions for radiation therapy and diagnostic imaging centres. Visit www.sunnuclear.com to find out more.
Evidence for a new type of subatomic particle could be lurking within the gravitational waves produced by some merging black holes, according to calculations by physicists in the US and the Netherlands. John Stout at Harvard University and colleagues have studied a process whereby a cloud of hypothetical ultralight bosons could form around a black hole, creating a “gravitational atom”. They reckon that if such a black hole were in a merging binary pair, the presence of the ultralight bosons would be revealed by “kinks” frequencies of the emitted gravitational waves.
Gravitational waves produced by merging pairs of black holes were first observed in 2015 by the LIGO observatories and since then many more signals have been spotted. The theory of gravitational-wave production is robust, so any deviations between theory and observation could point to new physics beyond the Standard Model of particle physics.
For example, deviations could be caused by the existence of ultralight bosons, which are not part of the Standard Model. These are hypothetical particles with extremely low masses that would couple extremely weakly to regular matter. Ultralight bosons are believed by some to be promising candidates for dark matter, but according to current theories, they are not necessarily abundant throughout the universe – making them particularly challenging to detect.
Black hole superradiance
Stout and colleagues believe that evidence for ultralight bosons could be revealed by an effect called black hole superradiance. In this hypothetical scenario the number of ultralight bosons surrounding a black hole is amplified by the black hole’s rapid rotation. This would create a cloud of ultralight bosons surrounding the black hole in which the particles would occupy specific orbits, much like the electron clouds surrounding atomic nuclei.
In their study, Stout’s team explored a scenario where one black hole in a binary pair is such a gravity atom. As the black holes orbit each other, the cloud of ultralight bosons would experience a periodic perturbations from the gravitational field of the other black hole – and as the black holes spiral towards each other, the frequency of the perturbation would increase.
Fleeing bosons
At first these perturbations would cause transitions within the cloud, promoting ultralight bosons to higher-energy orbits. However, as the frequency increases, particles would start to be ejected from the clouds – in a process like atomic ionization. These ejected particles would carry energy away from the black-hole system. Stout and colleagues reckon that this energy loss could happen suddenly and surpass the energy lost by the binary pair to gravitational waves. As a result, the effect of the fleeing superlight bosons would be imprinted within the gravitational-wave signal from the black-hole pair.
They have calculated that this ionization would cause kinks in frequency evolution of gravitational waves emitted by the black-hole binary. If detected in real gravitational wave signals, this would not only provide a unique signature of the ultralight boson cloud, it would also contain direct information about its mass and energy states.
Unfortunately, these kinks cannot be observed by current gravitational-wave detectors such as LIGO and Virgo. However, the team predicts that the signature could be easily detected by the upcoming LISA space observatory, now scheduled for launch in 2037.