Recently, I had a fantastic conversation with David Leckrone, an astrophysicist who spent 33 years working on NASA’s Hubble Space Telescope. Much of that interview is featured in today’s episode of the Physics World Weekly podcast, where Leckrone explains what it was like when he and his colleagues realized that the telescope suffered from spherical aberration –and how they saved the mission from disaster.
Unfortunately, the interview is too long for all of it to be included in the podcast, so I have decided to present Leckrone’s scientific highlights in a standalone clip. Enjoy this insider’s view on the comet Shoemaker-Levy 9 impact of Jupiter and other Hubble triumphs of discovery.
A phenomenological model devised by scientists at the University of Twente in the Netherlands sheds new light on the behaviour of metals cooled by liquid nitrogen – and specifically the somewhat counter-intuitive classical observation that insulated metals cool down faster than their bare counterparts (Cryogenics).
“Our model and the related understanding of the low-temperature physics are novel,” says Srinivas Vanapalli, head of Twente’s Applied Thermal Sciences Laboratory. In addition to the fundamental insights, Vanapalli and his PhD student Sahil Jagga reckon that their findings will make it possible to design faster and more efficient cryogenic cooling systems.
A significant barrier to rapid cool-down in cryogenic systems is the evolution of a vapour film between the liquid-nitrogen coolant and the stainless-steel tubing that connects the cryogen bath to the cryogen storage tank. This phenomenon – known as the Leidenfrost effect – results in a low heat transfer rate and inefficient usage of precious coolant.
Now, Vanapalli and Jagga say they have come up with a workaround that addresses this problem while simultaneously optimizing the associated workflow. Their data-driven model is the result of a systematic set of quenching experiments on copper cylinders coated with different thicknesses of low-conductive epoxy. During these experiments, the researchers evaluated the heat flux (W/m2) and cool-down time of cylinders in both saturated – that is, just about to boil – and subcooled liquid nitrogen.
The researchers found that an early transition between two liquid-nitrogen boiling regimes – from film boiling (as seen with the Leidenfrost effect) to the so-called nucleate boiling regime – is a major driver of enhanced cooling, as it promotes the formation of cold spots between the liquid and insulating layer. “In terms of the underlying physics,” explains Vanapalli, “coating the tube with an insulating material increases the liquid–solid contacts at the surface to yield a more efficient cooling process.”
The utility of the University of Twente model is that it predicts the right coating thickness of the cylinders, since coatings that are too thin or too thick will slow the cooling rate. According to Vanapalli, theirs are the first results to show that the optimum coating thickness depends not just on the thermal properties of the coating material, but also on the thermodynamic state of the liquid nitrogen – in other words, whether it’s saturated or sub-cooled.
Previous studies elsewhere have sought to evaluate the effect of insulating coating thickness at the minimum film-boiling temperature – the point where the vapour film between liquid and solid surface collapses – but the microscale mechanisms in play have proved frustratingly elusive. The Twente researchers also note that, until now, scientists seeking to optimize the thickness of the insulation coating in a way that minimizes cool-down time relied exclusively on empirical investigation – essentially trial and error.
Cold science, hot stuff
More widely, Vanapalli notes that there are commercial drivers in play, since liquid-nitrogen cooling finds diverse applications within research and industry. These applications include cryopreservation of biological samples in “biobank” repositories; studies of high-temperature superconductivity; whole-body cryotherapy in professional sports; and quenching of tool-steels for improved hardness and durability, to name just a few.
With this in mind, Vanapalli and Jagga plan to scale their new model to cover a range of coating materials, as well as other cryogenic liquids such as argon, hydrogen and helium. Two main inputs will be needed: the thermal properties of the coating material and critical heat flux data for specific pairings of metal surfaces and cryogenic liquids. “As a next step, we will acquire experimental data with argon and hope that the cryogenics community will contribute for other fluid–surface pairings,” Vanapalli says. “Ultimately, the aim is to translate this effort into an open-access web tool to benefit cryogenic system designers.”
The research is sponsored by Dutch funding agency NWO-TTW within the CryoOn project.
Ultrasound imaging uses the reflection of waves to image soft tissues within the body. However, soft tissues have inherent inhomogeneities that can distort the incident and reflected propagating waves. Consequently, wave speed fluctuations and multiple scattering events lead to inevitable blur in the resulting images. To resolve this problem of image quality degradation, researchers have employed the adaptive focusing approach, which can compensate for image distortions caused by uneven interfaces or tissue inhomogeneities.
Conventional adaptive focusing methods are based on a dominant scatterer – an artificial reference point from which the signal to be optimized is reflected. However, it is not always straightforward to generate a reference point that accounts for all the imperfections of a heterogeneous medium. In addition, conventional adaptive focusing methods that correct for aberrations to optimize the image quality are often based on the assumption that these aberrations do not change over the entire field-of-view. In reality, the extent of image distortions can vary as a function of imaging depth inside a biological tissue.
To overcome these limits for ultrasound imaging, several acoustic imaging groups have developed methods to estimate and compensate for the time delays of emitted and reflected signals (as sound waves travel through different tissue depths) and mapped the speed-of-sound distribution to enable reconstruction of an image. But a more general approach that could be extended to any type of wave was not previously available. Now, researchers at the Institut Langevin (ESPCI Paris, PSL University, CNRS), led by Alexandre Aubry, have developed a universal matrix approach for wave imaging, using a multi-sensor network.
In collaboration with SuperSonic Imagine, the researchers published their imaging method – a reflection matrix approach for quantitative imaging of scattering media – in Physical Review X in early June. A week later, they published the experimental proof-of-principle of their theoretical results in PNAS. In this latter study, the researchers showed that their mathematical formalism can correct for aberrations that are inevitably present in in vivo images of the human body.
CNRS and SuperSonic Imagine researchers (left to right): William Lambert, Laura Cobus, Thomas Frappart, Mathias Fink and Alexandre Aubry. (Courtesy: Alexandre Aubry)
A novel approach
The novelty of the team’s work is that, unlike adaptive focusing methods, the reflection matrix approach is not limited to a single isoplanatic patch (area over which aberrations are spatially invariant). Instead, their approach retrieves the transmission matrix which connects any point inside the tissue with an array of external ultrasound sensors, to tackle more rigorously the challenges induced by random scattering media in medical ultrasound applications.
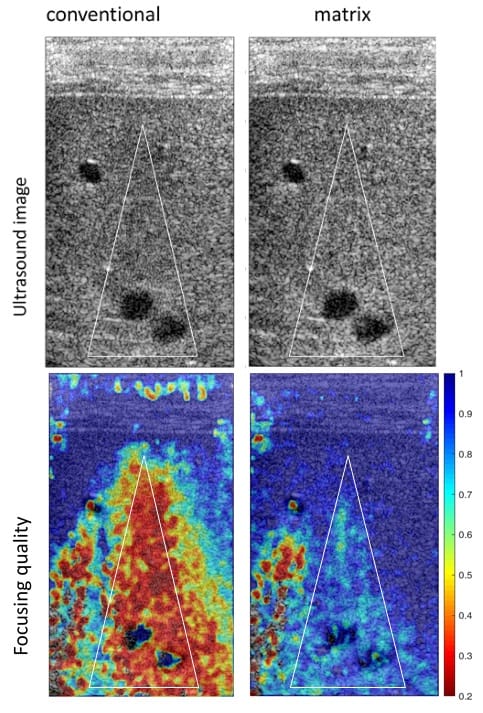
Application of reflection matrix approach in imaging of the liver enhances the image resolution. (Courtesy: Alexandre Aubry)
This new technique records the amplitude and phase of the tissue response, i.e., the ultrasound signal reflected from the tissue. Then, by using a position-dependent matrix, elements corresponding to the angle of rotation of the imaging plane and signals emitted/reflected by each transducer in the array can be accessed to link each sensor and image voxel.
As a random distribution of unresolved scatterers makes adaptive focusing more challenging, the reflection matrix approach considers the reflectivity of the medium to be continuous and random. Thus, the reflection matrix can be projected to each isoplanatic patch separately and therefore distinguish and resolve aberrations in multiple fields-of-view.
Finally, the team applied their aberration correction technique to ultrasonic data recorded from the calf of a healthy human volunteer. This in vivo imaging experiment confirmed that the distortion matrix approach can be extended to cases in which the speed-of-sound distribution in the medium is unknown, as the matrix can correct for complex position-dependent distortions.
The researchers tested and confirmed their theoretical developments using one particular type of wave. However, they believe that the potential of this work goes beyond ultrasound imaging as it can be applied to all fields of wave physics. Aubry notes that his group’s work on broadening the application of the distortion matrix approach to optical microscopy will shortly be published in Science Advances.
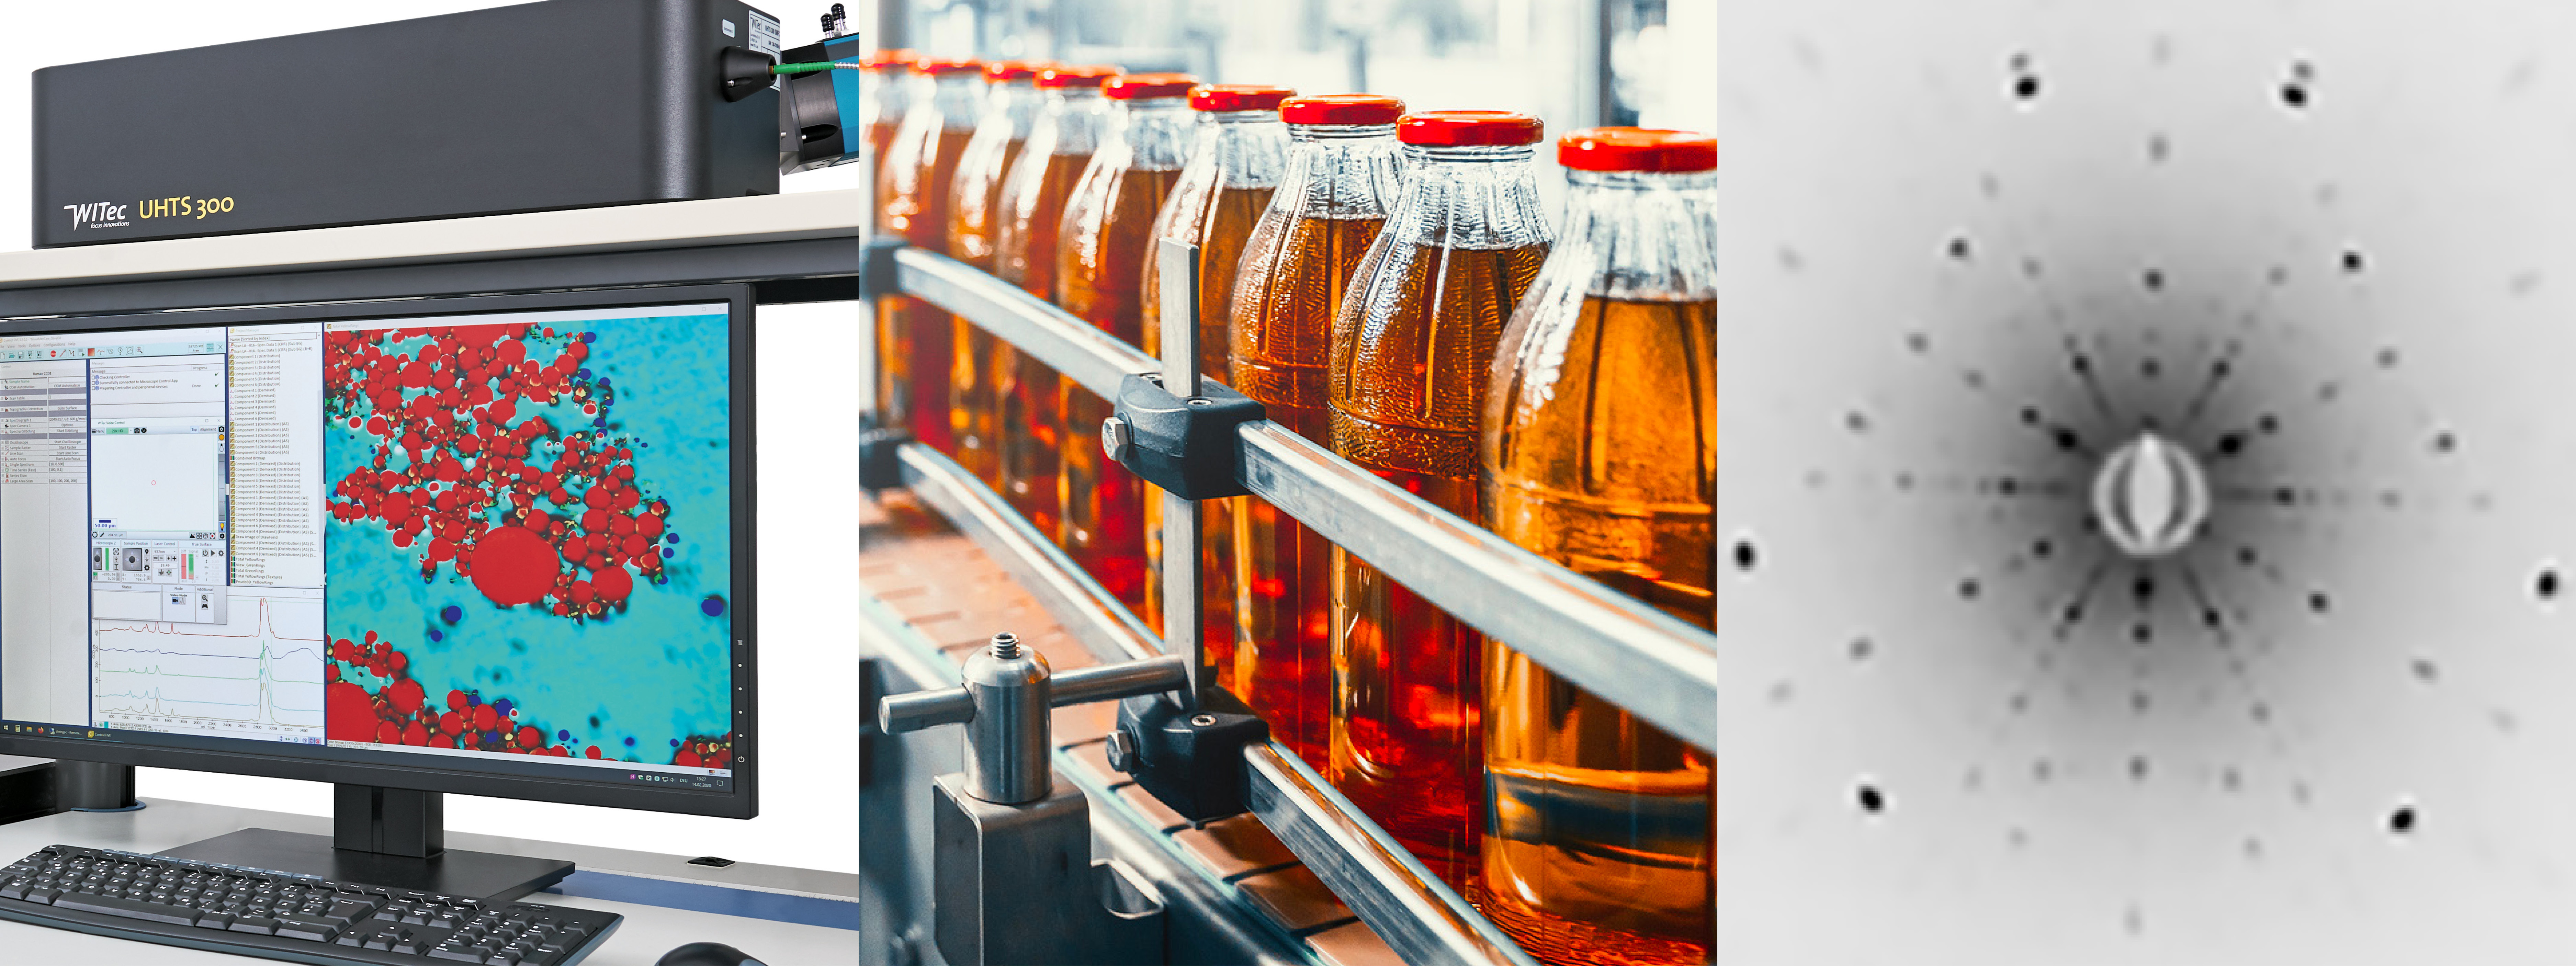
Innovation in action: (left to right) WITec’s UHTS300 Raman spectrometer system (Courtesy: WITec); Ocean Insight’s spectral tools are used in a wide range of areas including food processing (Courtesy: Ocean Insight); Photonic Science and Engineering’s Laue tool used to study sapphire (Courtesy: Photonic Science and Engineering).
This time we are featuring white papers from WITec, Ocean Insight, and Photonic Science and Engineering.
Studying semiconductors
Raman spectroscopy is a long-established, non-destructive technique for studying solids, liquids and gases that involves measuring how light scatters inelastically off the component molecules. In Correlative Raman Imaging of Semiconducting Materials – the latest application note from WITec – you can find out how confocal Raman microscopy, which combines Raman spectroscopy with confocal microscopy, is a great way for characterizing semiconducting materials. The document shows how it can reveal the chemical composition of a sample, identify possible contaminants and even visualize strain fields in 3D volumes. Confocal Raman microscopy can even be combined with atomic-force microscopy or scanning-electron microscopy to allow semiconductors to be comprehensively investigated.
Innovative insights
Navigating today’s industrial landscape is an ongoing challenge for manufacturers, with dynamic regulatory issues, emerging technologies and global competition placing a premium on innovation and creativity. Manufacturers are therefore constantly looking for better ways to manage their supply chains, reduce waste and off-specification product, and increase production yields, which is where spectrometers, cameras and multispectral sensors come in. In its latest white paper Unlocking the Unknowns of Industrial Sensing, Ocean Insight shows how it offers robust, scalable sensing tools to help users unlock the unknowns of industrial applications especially in industrial sensing – from measuring colour and spotting defects to testing samples and sorting and grading products. Machine learning and custom algorithm development capabilities add another layer of insight, the paper adds.
Cleverly orientated
Laue diffraction is a powerful method for investigating crystal orientation. UK firm Photonic Science and Engineering has now developed a special Laue tool that fires an intense, polychromatic “white” beam onto a single crystal material positioned behind a very-low-noise CMOS detector. A back-reflection geometry records as many Bragg reflections as possible within a single exposure, delivering a “misorientation” value against the primary reference axis. In Laue Crystal Orientation System used in Micro-Diffraction Experiment you can find out how this technique has been used at the European Synchrotron Radiation Facility in Grenoble, France, and elsewhere, to study semiconductor detectors, sapphire substrates, laser or gamma scintillation materials, ceramics and metal alloys.
Adding multi-walled carbon nanotubes (MWCNTs) to a common refrigerant can reduce a domestic refrigerator’s power consumption by nearly 30%, according to researchers at the University of Johannesburg in South Africa. Such a huge energy saving would be particularly welcome in low-income countries where electricity blackouts are frequent and refrigerators often have to run off expensive generators.
A conventional refrigerator works by pumping a refrigerant around a closed system. The refrigerant expands from a liquid to a gas, and then contracts to become a liquid again – a process that requires electrical energy, which is acquired by cooling the surroundings on the cold side of the system. This heat is then released on the hot side when the gas condenses back into a liquid.
Many domestic, and indeed industrial, refrigerators use a chemical called R134a as their refrigerant. Also known as tetrafluoroethene, R134a has the chemical formula CF3CH2F and belongs to the hydrofluorocarbon family of refrigerants. Although it is non-flammable and boasts a low ozone depleting potential (ODP) compared to chlorofluorocarbons and hydrochlorofluorocarbons (both of which were phased out in the 1990s), it does have a high global warming potential (GWP). For this reason, other refrigerants are being sought to replace it.
Replacing R134a with a R600a/MWCNT mix
In this work, researchers led by Daniel Madyira studied an alternative refrigerant called R600a, or isobutane. This chemical has a low GWP as well as a low ODP and is starting to replace R134a in new refrigeration units, especially domestic and light commercial systems such as fridges, freezers and drink dispensers.
To improve the cooling efficiency of their R600a, the researchers dosed it with 0.4 g/L to 0.6 g/L MWCNTs in a mineral oil lubricant. They then removed R134a and its compressor oil from a household refrigerator (which was manufactured to work with 100 g of R134a) and fed their new R600a/MWCNT mix into the inlet of the fridge’s compressor.
Performance tests by the University of Johannesburg team revealed that the fridge cooled faster when running on R600a/MWCNTs and had a reduced evaporation temperature of –11 °C after 150 minutes. “This is lower than the –8 °C for R134a,” Madyira explains. “It also exceeds the ISO 8187 standard, which calls for –3 °C at 180 minutes.”
29% less energy consumption
The Johannesburg team found that their modified appliance consumed 29% less energy than one using R134a – a figure that Madyira calls “a significant energy gain for users, especially low-income households”. He adds that both the reduction in energy consumption and the resulting improvement in cooling performance are due to the nanoparticles, which “not only improve the refrigerant’s thermal conductivity but also reduce friction and wear on the fridge’s vapour compressor,” he tells Physics World. The reduction in friction, in turn, enhances the heat transfer rate and reduces the pumping power required by the compressor for effective operation. Previous work by other groups also showed reduced energy use when refrigerants made with water or ethylene glycol were dosed with MWCNT particles in a similar fashion.
Don’t try this at home
Despite the potential boost to cooling efficiency, Madyira advises against simply replacing the refrigerant in your fridge with R600a. Instead, a trained refrigeration technician should do the job – not least because R600a, unlike R134a, is flammable. Also, while some refrigerator manufacturers have begun to commercialize appliances that use R600a, they use no more than 150 g of the material in a domestic fridge. In their work, Madyira and colleagues used between 50–70 g to stay within safety parameters.
Another barrier to do-it-yourself replacement is that the mineral oil used in the compressor needs to be mixed in the right concentrations, with a magnetic stirrer or sonic bath used to agitate and homogenize the ingredients before adding them to the compressor. The main challenge in this step, Madyira explains, is to overcome coagulation of the particles before adding the oil to the compressor – a task that requires careful preparation.
The researchers, who describe their work in Energy Reports, say they will now test different types of nanoparticles to determine whether they reduce power consumption in vapour compression refrigeration systems. “We will be continuing to conduct tests on various other types of refrigerants to see if the same performance benefits reported for R600a can be duplicated,” says Madyira. “We also need to further analyse the durability of the nanoparticles we tested.”
Four female physics students have been awarded a new fellowship that seeks to promote diversity in physics. The Bell Burnell Graduate Scholarship Fund, awarded by the Institute of Physics (IOP), which publishes Physics World, aims to encourage diversity in physics by supporting students to do a PhD in the subject.
The new fund aims to help students from groups currently under-represented in physics, including female students, black and other minority ethnic students, people with refugee status and students from disadvantaged backgrounds. It was set up in 2018 after astrophysicist Jocelyn Bell Burnell -- a former IOP President -- donated £2.3m to the IOP. The cash was the money that Bell Burnell received after being awarded the 2019 Special Breakthrough Prize in Fundamental Physics for her role in the discovery of pulsars in the 1960s.
To study for a PhD requires considerable commitment, but some students also face additional challenges and barriers that require them to demonstrate even more resilience if they are to succeed
Rachel Youngman
The first awardees of the fund are astrophysics PhD students Joanna Sakowska from the University of Surrey and Tracy Garratt from the University of Hertfordshire as well as physicist Katarina Mamic from the University of Lancaster and medical physicist Kiri Newson from the University of Hull. The host university or institution will now pay at least 50% of the full costs of their doctoral programme with the scholarships providing support for course fees, living costs as well as any additional funding to support accessibility including support for carer responsibilities.
“These four talented and deserving students are embarking on exciting opportunities in physics research that might otherwise have been denied them,” says Rachel Youngman, deputy chief executive of the IOP. “To study for a PhD requires considerable commitment, and physics is certainly no exception, but some students also face additional challenges and barriers that require them to demonstrate even more resilience if they are to succeed.”
The awardees were chosen by a panel chaired by Helen Gleeson, a soft-matter physicist from the University of Leeds. “The competition was very tough, with a large number of eligible students who could benefit from sources of funding such as this,” says Gleeson. “The successful applicants are embarking on exciting research projects, and we are looking forward to them inspiring others in their ambassadorial role.”
Researchers in China have used an imaging approach known as X-ray ghost imaging (XGI) to obtain spectral images of an object using a single-pixel detector. This technique could find applications in a host of different fields, including biological and medical imaging, materials science and environmental sensing.
Unlike conventional cameras, ghost imaging does not directly capture an image of an object. Instead, it reconstructs the image from the correlations between the light that the object reflects or transmits and a series of “speckle patterns” used to illuminate it. In classical ghost imaging, these patterns are produced by two beams: one that encodes a random pattern that acts as a reference, but which doesn’t directly probe the sample, and another that passes through the sample. The two beams both acquire partial information about the object, but neither one alone can form a complete image.
Modulating mask
In their work, researchers led by Ling-An Wu and Li-Ming Chen of the Institute of Physics, Chinese Academy of Sciences, Beijing, began by modulating an X-ray beam using the patterns in a 2-inch square mask made of gold and placed about 45 cm from the X-ray source. They then passed the resulting structured beam through their sample, which was located about 1 cm away from the mask. Since the sample is so close to the mask, the pattern of X-rays projected through the sample is the same as the pattern in the mask itself – a prerequisite for ghost imaging in this work. This orientation also ensures that the resolution is practically the same as the 10 μm pixel size of the mask.
To block unwanted radiation, the researchers inserted a 3-mm-thick square aperture made of copper between the object and the detector. To collect their data, they placed a “bucket” spectrometer (comprising a sensor, signal amplifier, digital pulse processor and specialized software) 25 cm behind this aperture.
Wide range of different X-ray energies
The 5 × 5 mm2 sensor efficiently and simultaneously detects a wide range of X-ray energies (from 3 to 45 keV) as they are transmitted through the sample with a resolution of 1.5 keV, Wu and colleagues say. The key component of this single-pixel detector is a 1-mm-thick cadmium telluride diode that produces current pulses proportional to the energy of the incident X-ray photons. These analogue intensity signals are then converted to digital pulses of different heights. Next, the output signals are reshaped and amplified, before being processed to produce an energy spectrum.
After recording all this spectral information, the researchers built up X-ray ghost images of the sample by measuring the correlations between different intensities of light transmitted by the object through the mask. This is known as second-order correlation, and is a routine technique in ghost imaging.
The technique is the first demonstration of energy-selective X-ray ghost imaging, where spectral and intensity information can be obtained at the same time without affecting each other, Wu says. The X-ray source the Beijing group employed is also simpler than the synchrotron radiation sources used in previous studies. “Our source is a conventional table-top X-ray tube that emits polychromatic rays of a much lower intensity,” she explains. “The key component in our experiments is, in fact, our specially-fabricated etched gold modulation mask. With modern micromanufacturing techniques, we can etch most of the patterns in the mask as designed. We characterized ours using scanning electron microscopy, from which we confirmed that the pixel size was indeed 10 μm.”
Attractive for medical imaging
Since X-ray ghost imaging can be performed with much lower levels of radiation than traditional X-ray imaging, it should be attractive for medical imaging and analysing in vivo samples, she tells Physics World. “The technique acquires images according to the spectral fingerprint of the object, so different tissue layers can be distinguished more easily and without damage.”
Other application areas include analysing mineral ores and archaeological samples, she adds.
The Beijing team’s members, who report their work in Chinese Physics Letters (which is published jointly by IOP Publishing and the Chinese Physical Society), say they now plan to analyse real biological samples and other materials. “Analysing the X-ray signals from stellar objects is also another possibility,” Wu adds.
A new closed-loop microscopy technique that can detect chemical compositions at the nanoscale and at high sensitivity has been unveiled by Rohit Bhargava and colleagues at the Beckman Institute for Advanced Science and Technology at the University of Illinois. Their design relies on a piezoelectric material that responds to the voltages produced when a sample is probed by a cantilever. Their approach could enable researchers to precisely measure the spectra of a wide range of nanomaterials, including molecular-scale biological samples.
Based on atomic force microscopy (AFM), AFM-IR involves firing an infrared (IR) laser at a sample, then measuring the resulting thermal expansion using the sharp cantilever tip of an AFM. This is a very useful measurement because the thermal response of a material is characteristic of its chemical composition.
AFM-IR is now widely used to study the spectra of nanomaterials, but still faces a major challenge in dealing with unknown sources of vibrational noise in the cantilever, which can overwhelm the signal. This had been addressed by placing samples on specialized substrates or using specialized sample preparation methods – but these solutions tend to limit the versatility of the technique.
Less noise: chemical signal produced by a 4 nm thick polymer film collected using previous deflection AFM-IR detection (top) compared to the new null-deflection approach. (Courtesy: Beckman Institute for Advanced Science and Technology)
Closed-loop system
In their study, Bhargava’s team addressed the noise issue by placing a piezoelectric material under the substrate, which changed shape when a voltage was applied to it. In this case, the voltage was determined by the movements of the cantilever. Therefore, the change in shape of the piezoelectric offset the expansion of the irradiated sample, creating a closed-loop system that eliminated the cantilever’s movement. This meant that the chemical composition of the sample could be measured by monitoring the voltage applied to the piezoelectric, while any noise-inducing vibrations were minimized.
With a standard, commercial AFM-IR instrument, Bhargava and colleagues used their closed-loop approach to measure the composition of a 100 nm-thick acrylic film placed onto a glass substrate. Then, they repeated the measurement using a gold substrate. In each case, their results agreed well with spectroscopic measurements made with other techniques. The team also created accurate maps of localized infrared absorption in a 4 nm-thick acrylic film when applied to silicon, with little contribution from effects outside the closed loop. Since glass and silicon are both popular choices of substrate for nanomaterials researchers, the demonstrated versatility of the approach could remove the need for strict preparation measures.
Bhargava’s team now hopes that the sensitivity of their closed-loop approach will allow AFM-IR to analyse a far more diverse range of materials, with far smaller volumes. If applied, it could allow researchers to probe materials including the complex mixtures present in cell membranes, and behaviours including the deformation of protein molecules.
When astronomer Edwin Hubble realized that the universe is expanding, it was the greatest cosmological discovery of all time. The breakthrough acted as a springboard to learning about the age of the cosmos, the cosmic microwave background (CMB) radiation, and the Big Bang.
Hubble was the right man in the right place at the right time. In April 1920 his fellow astronomers Harlow Shapley and Heber D Curtis famously debated the size of the universe, and the nature of spiral nebulae, at the Smithsonian Museum of Natural History in the US. Within four years, Hubble had the answer for them.
Using the 100-inch (2.5 m) Hooker Telescope at Mount Wilson Observatory in California, Hubble was able to identify Cepheid variables – a type of star whose period-luminosity relationship allows accurate distance determination – in the spiral nebulae, which allowed him to measure them as extragalactic. The finding meant the Milky Way was not the entire universe, but just one galaxy among many.
Soon, Hubble had discovered that almost all of these galaxies are moving away from us – their light is redshifted via the Doppler effect. These observations were seized upon by the Belgian cosmologist Georges Lemaître, who realized that they implied that the universe is expanding. Independently, both Hubble and Lemaître derived a mathematical relationship to describe this expansion, subsequently known as the Hubble–Lemaître law. It says that the recession velocity (v) of a galaxy is equal to its distance (D) multiplied by the Hubble constant (H0), which describes the rate of expansion at the current time.
In the nearly 100 years since Hubble’s discovery, we’ve built up a detailed picture of how the universe has developed over time. Granted, there are still some niggles, such as the identities of dark matter and dark energy, but our understanding reached its peak in 2013 with the results from the Planck mission of the European Space Agency (ESA).
Launched in 2009, Planck used microwave detectors to measure the anisotropies in the CMB – the slight temperature variations corresponding to small differences in the density of matter just 379,000 years after the Big Bang. The mission revealed that only 4.9% of the universe is formed of ordinary baryonic matter. Of the rest, 26.8% is dark matter and 68.3% is dark energy. From Planck’s observations, scientists also deduced that the universe is 13.8 billion years old, confirmed that the universe is flat, and showed how baryonic acoustic oscillations (BAOs) – sound waves rippling through the plasma of the very early universe, resulting in the anisotropies – neatly matched the large-scale structure of matter in the modern universe, which we know has expanded according to the Hubble–Lemaître law.
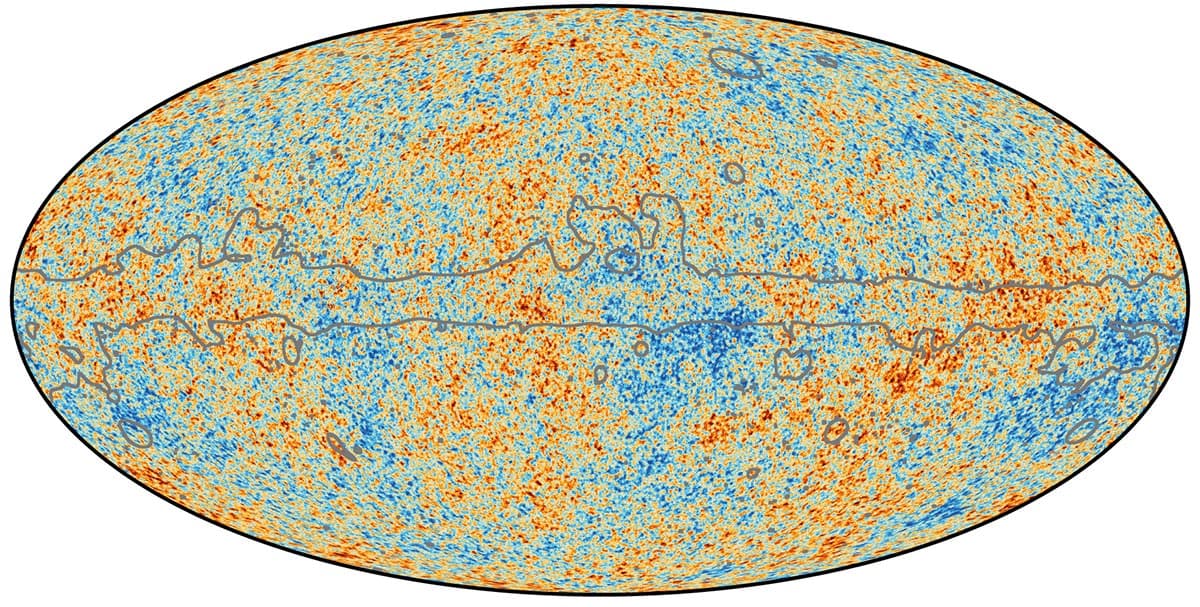
Mapping the universe By measuring the temperature anisotropies of the cosmic microwave background – as demonstrated in this 2018 map – the Planck mission provided the most precise measurement of the Hubble constant to date: 67.4 km/s/Mpc with just 1% uncertainty. (Courtesy: ESA and the Planck Collaboration)
Planck’s view of the CMB is the most detailed to date. Plus, by mapping our best cosmological models to fit Planck’s observations, a whole host of cosmological parameters have come tumbling out, including H0. In fact, scientists were able to extrapolate the value of H0 to the greatest precision ever, finding it to be 67.4 km/s/Mpc, measured to an uncertainty of less than 1%. In other words, every stretch of space a million parsecs (3.26 million light-years) wide is expanding by a further 67.4 km every second.
With Planck’s results, we thought that this picture was complete, and that we knew exactly how the universe had expanded over those 13.8 billion years. Yet it turns out that we may be wrong (see box "Not a constant constant over time").
Not a constant constant over time
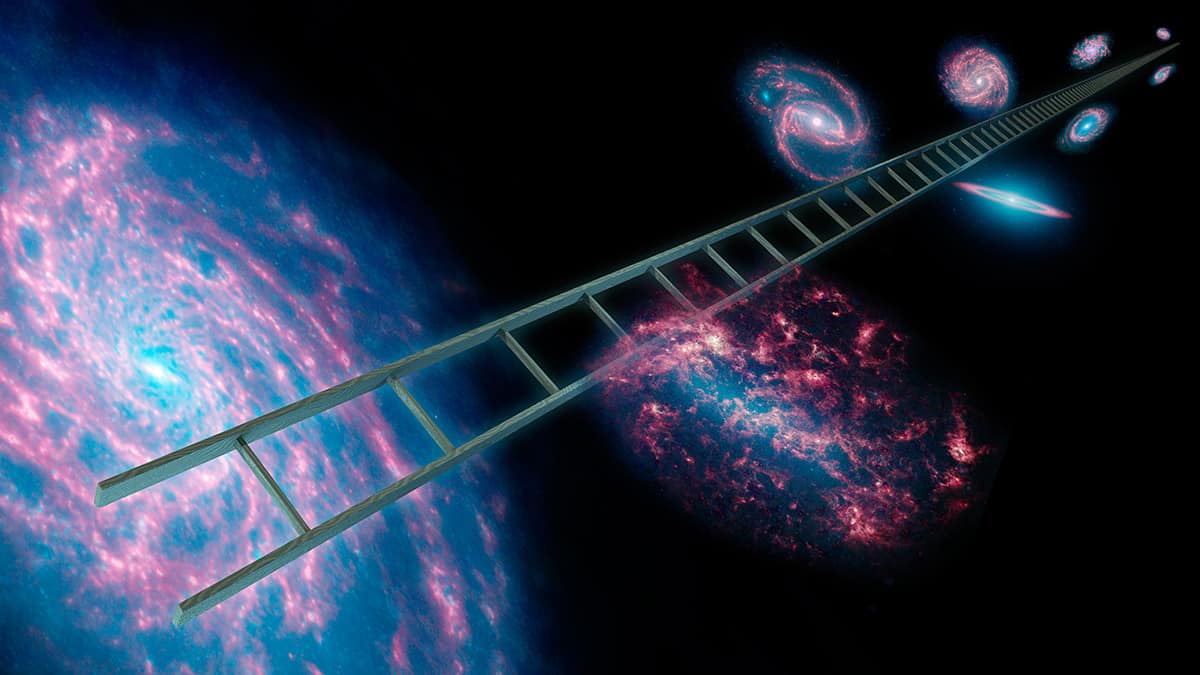
Cosmic distance ladder Astronomical distance is an important part of measuring H0. (Courtesy: NASA/JPL-Caltech)
Describing H0 as “the Hubble constant” is a little bit of a misnomer. It is true that it is a constant at any given point in time since it describes the current expansion. However, the expansion rate itself has changed throughout cosmic history – H0 is just the current value of a broader quantity that we call the Hubble parameter, H, which describes the expansion rate at other times. Therefore, while the local measurement, H0, should only have one value, H can take on different values at different points in time. Prior to the discovery of dark energy, it was assumed that the expansion of the universe was slowing down, and hence H would be larger in the past than in the future. On the face of it, since dark energy is accelerating the expansion, you might therefore expect H to increase with time, but that’s not necessarily the case. Rearranging the Hubble–Lemaître law such that H = v/D, where v is an object’s recession velocity, we see that H depends strongly on distance D, since in a universe with accelerating expansion, the distance is increasing at an exponential rate. The bottom line is that H is likely to be decreasing with time, which is what we think is happening, even though the recession velocity and hence the expansion are still increasing with distance.
Moving parts
Traditionally, H0 is determined by measuring the distance and recession velocity of galaxies using “local” standard candles within those galaxies. These include type 1a supernovae – the explosion of white-dwarf stars with a certain critical mass – and Cepheid variable stars. The latter have a robust period–luminosity relationship (discovered by Henrietta Swan Leavitt in 1908) whereby the longer the period of the star’s variability as it pulses, the intrinsically brighter the star is at peak luminosity. But as astrophysicist Stephen Feeney of University College London explains, these standard candles have many “moving parts”, including properties such as stellar metallicity, differing populations at different redshifts, and the mechanics of Cepheid variables and type Ia supernovae. All the moving parts lead to uncertainties that limit the accuracy of these observations and we have seen over the years how the resulting calculations of H0 can vary quite a bit.
A star's pulse Cepheid variable stars – such as this one in galaxy M100 – have a strong period-luminosity relationship that allows astronomers to work out how far away they are. (Courtesy: Wendy L Freedman, Observatories of the Carnegie Institution of Washington/NASA)
On the other hand, Planck’s value of H0 is a relatively straightforward measurement – even if it does depend on the assumption that lambda cold dark matter (ΛCDM) cosmology – which incorporates the repulsive force of dark energy (Λ) and the attractive gravitational force of cold dark matter (CDM) – is correct. Still, when all the known uncertainties and sources of error are taken into account, Planck’s value of H0 is to a precision greater than ever before, to just 1%.
Although the Planck value of H0 is calculated from measurements of the CMB, it is important to note that it is not the expansion rate at the time of the CMB’s creation. Rather, “think of the CMB measurement as a prediction instead”, says Feeney. It extrapolates from what the CMB tells us the universe was like 379,000 years after the Big Bang, factoring in what we know of how the universe would have expanded in the time since based on the Hubble–Lemaître law and ΛCDM, to arrive at an estimate of how fast the universe should be expanding today. In other words, however we measure H0, whether it be with the CMB or more local measurements of Cepheid variables and supernovae, we should get the same answer.
A spanner in the works
In 2013, when the Planck measurement was revealed, this wasn’t a problem. Although local measurements differed from the Planck value, their uncertainties were still large enough to accommodate the differences. The expectation was that as the uncertainties become smaller over time with more sophisticated measurements, the local measured value would converge on the Planck value.
However, in 2016 a major milestone was reached in local measurements of H0 that brought our understanding of the universe into question. It involved Adam Riess of Johns Hopkins University, US, who in 1998 had co-discovered dark energy using type Ia supernovae as standard candles to measure the distance to receding galaxies based on how bright the supernovae appeared. He was now leading the cumbersomely named SH0ES (Supernova, H0, for the Equation of State for dark energy) project, which was set up to calibrate type Ia supernovae measurements to determine H0 and the behaviour of dark energy. In order to provide this calibration, the SH0ES team used a lower rung on the “cosmic distance ladder”, namely Cepheid variables. The project aimed to identify these pulsating stars in nearby galaxies that also had type Ia supernovae, which would mean that the Cepheid distance measurement could then be used to calibrate the supernova distance measurement, and this new calibration could in turn be used on supernovae in more distant galaxies. The method produced a value of H0 with an uncertainty of just 2.4%.
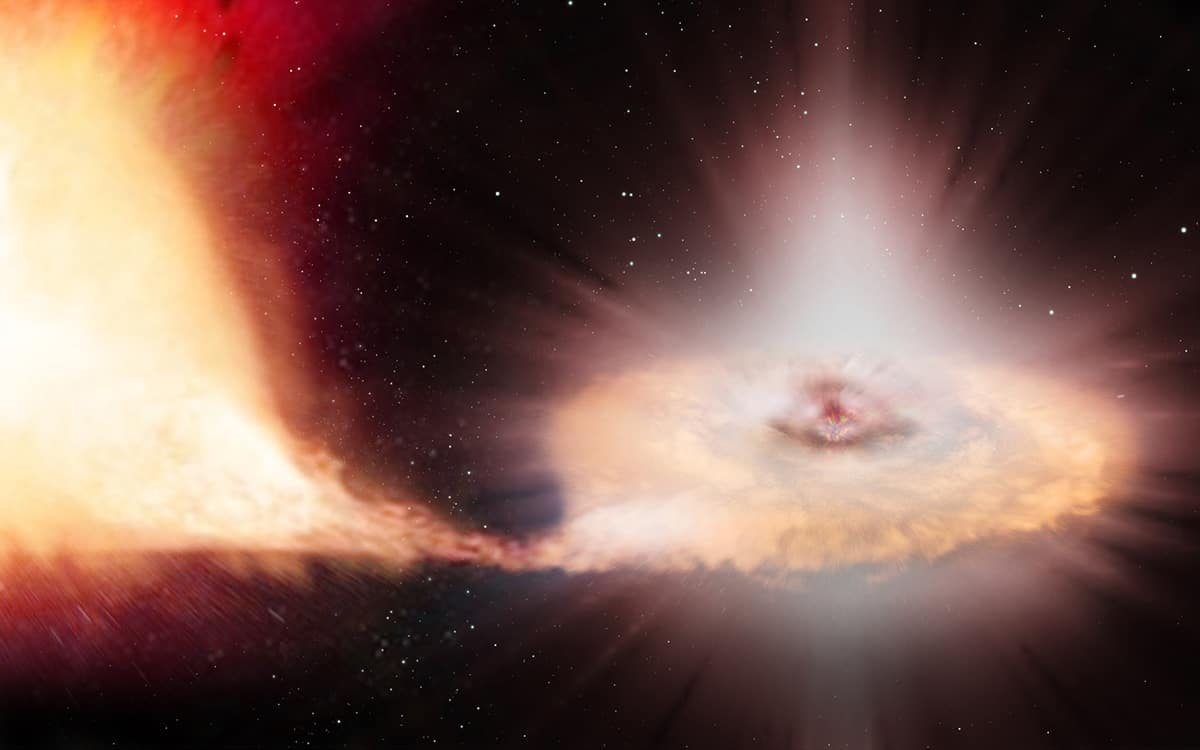
A star's death A type 1a supernova – as illustrated here in an artist’s impression – results from the destruction of a white dwarf star above a critical mass. Their standardizable luminosity makes them a useful rung on the cosmic distance ladder. (Courtesy: ESA/ATG medialab/C Carreau)
Riess and his group were stunned by their result, however. Using the local cosmic distance ladder, they inferred a value of H0 as 73.2 km/s/Mpc. With the vastly reduced uncertainties, there was no way this could be reconciled with Planck’s measurement of 67.4 km/s/Mpc. If these results are correct, then there is something deeply wrong with our knowledge of how the universe works. As Sherry Suyu of the Max Planck Institute for Astrophysics in Garching, Germany, says, “We may need new physics.”
Rather than assume Planck’s high-precision H0 is wrong and therefore rush to take apart the fundamentals of our best cosmological models, a scientist’s first instinct should be to test whether there has been an experimental mistake that means something about our measurement of the cosmic distance ladder is awry.
“That’s where my instinct still lies,” admits Daniel Mortlock of Imperial College London, UK, and Stockholm University, Sweden. Mortlock works in the field of astro-statistics – that is, drawing conclusions from incomplete astrophysical data, and accounting for various kinds of uncertainty and error in the data. It’s worth remembering there are two types of error in any measurement. The first is statistical error – errors in individual measurements, for example read-out noise from the detector, or uncertainties in the sky background brightness. Statistical errors can be reduced by simply increasing your sample size. But the other kind of errors – systematic errors – aren’t like that. “It doesn’t matter if you have a sample five times, or 10 times, or 50 times as large, you just get this irreducible uncertainty,” says Mortlock. An example of a systematic error might be the reddening of a star’s light by intervening interstellar dust – no matter how often you measure the star’s brightness, the star’s light would always be obscured by the dust, and its effect would increase the more you measure it.
Mortlock has considered that this could be what is happening with the local measurements of H0 – there may be some systematic error that astronomers have not yet identified, and if found, the tension between the Planck measurement and the local measurement of H0 could go away. However, Mortlock acknowledges that the evidence for the discrepancy in the H0 values being real “has been steadily growing more convincing”.
Einstein to the rescue
Presented with such an exceptional result, astronomers are double-checking by measuring H0 with other, independent means that would not be subject to the same systematic errors as the Cepheid variable and type Ia supernovae measurements.
One of these can be traced back to 1964, when a young astrophysicist by the name of Sjur Refsdal at the University of Oslo, Norway, came up with a unique way to measure the Hubble constant. It involved using a phenomenon predicted by Einstein but which at the time had not been discovered: gravitational lenses.
The general theory of relativity describes how mass warps space, and the greater the mass, the more space is warped. In the case of so-called “strong gravitational lensing”, massive objects such as galaxies, or clusters of galaxies, are able to warp space enough that the path of light from galaxies beyond is bent, just like in a glass lens. Given the uneven distribution of mass in galaxies and galaxy clusters, this lensing can result in several light paths, each of slightly different length.
Refsdal realized that if a supernova’s light passes through a gravitational lens, then its change in brightness would be delayed by different amounts in each of the lensed images depending on the length of their light path. So, image A might be seen to brighten first, followed a few days later by image B, and so on. The time delay would tell astronomers the difference in the length of the light paths, and the expansion of space during those time delays would therefore allow H0 to be measured.
Einstein's lenses Gravitational lensing, as seen in galaxy cluster Cl 0024+17, presents another means of determining cosmic distances, and therefore calculating Hubble’s constant. (Courtesy: NASA, ESA, M J Jee and H Ford (Johns Hopkins University))
Unfortunately, even after the first gravitational lens was discovered in 1979, it turned out that gravitationally lensed supernovae are exceptionally rare. Instead, quasars – luminous active galactic nuclei that also exhibit brightness variations – have been found to be the more common lensed object. That was what led Suyu to launch a project in 2016 to study lensed images of quasars in order to provide an independent measure of H0. It goes under the even more cumbersome name of H0LiCOW, which stands for H0 Lenses in COSMOGRAIL’s Wellspring, where COSMOGRAIL refers to a programme called the COSmological MOnitoring of GRAvitational Lenses, led by Frédéric Courbin and Georges Meylan at the École Polytechnique Fédérale de Lausanne.
Throughout this analysis, Suyu and team kept the final result hidden from themselves – a technique known as blind data analysis – to avoid confirmation bias. It was only at the very end of the process, once they had completed all their data analysis and with their paper describing their observations almost completely written, that they revealed to themselves the value of H0 that they had measured. Would it come out in favour of Planck, or would it boost the controversial SH0ES result?
The value that they got was 73.3 km/s/Mpc, with an uncertainty of 2.4%. “Our unblinded result agrees very well with the SH0ES measurement, adding further evidence that there seems to be something going on,” Suyu tells Physics World.
It’s still too early to claim the matter settled, however. The initial H0LiCOW analysis involved only six lensed quasars, and efforts are being made to increase the sample size. Suyu is also returning to Refsdal’s original idea of using lensed supernovae, the first example of which was discovered by the Hubble Space Telescope in 2014, followed by a second in 2016. Hundreds are expected to be discovered by the Vera C Rubin Observatory in Chile, formerly known as the Large Synoptic Survey Telescope, which will begin scientific observations in October 2022.
“It would be really interesting if the H0LiCOW measurements can be shown to be correct and in agreement with the Cepheid measurements,” says Feeney, who for his part is pursuing another independent measurement of H0, using another phenomenon predicted by Einstein: gravitational waves.
On 17 August 2017 a burst of gravitational waves resulting from the collision of two neutron stars in a galaxy 140 million light-years away triggered the detectors at the Laser Interferometry Gravitational-wave Observatory (LIGO) in the US and the Virgo detector in Italy. That detection has allowed Feeney and a team of other astronomers including Mortlock and Hiranya Peiris, also of University College London, to revive an idea, originally proposed by Bernard Schutz in 1986, to use such events to measure the expansion rate of the universe.
The strength of the gravitational waves indicates how distant a neutron-star merger is, but the merger also produces a handy burst of light known as a kilonova. This can be used to pinpoint the host galaxy, the redshift of which in turn provides the galaxy’s recession velocity. Feeney and Peiris have estimated that a sample of 50 kilonovae would be required to derive an accurate determination of H0, but Kenta Hotokezaka of Princeton University, US, and colleagues have found a way to speed this up. They point out that we would see the gravitational waves from a neutron-star merger at their strongest if we looked perpendicular to the plane of the collision. The merger produces a relativistic jet that’s also moving perpendicular to the plane, so measuring the angle at which we see the jet will tell us how large our viewing angle is from the plane, and therefore allow a determination of the true strength of the gravitational waves and hence the distance. Hotokezaka estimates that a sample size of just 15 kilonovae studied in this fashion will be enough to provide an accurate assessment of H0. Unfortunately, so far astronomers have observed just one kilonova, and based on that sample of one, Hotokezaka calculates H0 to be 70.3 km/s/Mpc, with a big uncertainty of 10%.
Other approaches abound
A red rung The red giant star β Ceti has begun fusing helium, and can therefore be used as a standard candle. (Courtesy: NASA/CXC)
Cepheid variables and type 1a supernovae are common rungs on the cosmic distance ladder that are used to find a local value for Hubble’s constant. But researchers led by Wendy Freedman of the University of Chicago have used another. They looked at the brightness of red giant stars that have begun fusing helium in their cores, to measure the distance to galaxies in which these stars can be seen. Initially they calculated H0 as 69.8 km/s/Mpc – but then things got complicated. Their data was reanalysed by Wenlong Yuan and Adam Riess to account for dust reddening, resulting in a revised measurement of 72.4 km/s/Mpc with an uncertainty of 1.45%. However, Freedman’s team have performed the same reanalysis and got a value of 69.6 km/s/Mpc, with an uncertainty of 1.4%, so the jury is still out on that one.
Meanwhile, the Megamaser Cosmology Project makes use of radio observations tracking water masers in gas orbiting supermassive black holes at the centres of distant galaxies. The angular distance that the masers traverse on the sky allows for a straightforward geometrical distance measurement to their host galaxy, producing a value of 73.9 km/s/Mpc for H0 with an uncertainty of 3%.
Changing the game
Taken together, all the available evidence seems to be pointing towards the dichotomy between the local measurements and the Planck measurement being real – and not some unidentified systematic error. However, a greater sample size is required before these results can be considered truly robust. With new observatories coming online, we could have the required observations within 10 years.
“If either the gravitational waves or the lensing methods give very strong results that match the SH0ES result, then I think that will change the game,” says Mortlock.
However, don’t expect a speedy resolution. After all, we’re still grappling with the nature of dark matter and dark energy, and current research is focused on trying to identify the dark-matter particle and trying to characterize the behaviour of dark energy. “Whatever is going on with the Hubble constant is still several steps behind those,” says Mortlock. “People are still debating whether the effect is real.”
The value of H0 will have many consequences. It will dictate the age of the universe, and the history of how the universe expanded and allowed large-scale structure to form
One way or another, figuring out whether the discrepancy in our measurements of H0 is real or not will have significant repercussions for cosmology. Feeney describes the local and Planck values of H0 as “a really potent combination of measurements, because you are constraining the universe now and how it looked 13.8 billion years ago, so you pin down the universe at both ends of its evolution”.
The value of H0 will have many consequences. It will dictate the age of the universe (a higher H0 would mean the universe might be substantially younger than 13.8 billion years, which would contradict the age of some of the oldest stars that we know). It would also influence the history of how the universe expanded and allowed large-scale structure to form. And if new physics is needed, as Suyu suggests, then it’s impossible as yet to say how dramatic an effect that would have on cosmology, since we don’t yet know what shape that new physics might take.
“It would be something in addition to our current ΛCDM model,” says Suyu. “Maybe we are missing some new, very light and relativistic particle, which would change Planck’s measurement of H0. Or it could be some form of early dark energy that’s not in our current model.”
Or it could be neither of these, but instead something we’ve not thought of yet. The prospect is tantalizing researchers, but Suyu warns about jumping the gun.
“First we need to get the uncertainties down to the 1% level on multiple methods to see if this tension is real,” she says. So we need to be a little bit patient, but if we come back in 10 years’ time, we may find that the universe is suddenly a very different place indeed.
Rather than the kilometre-length observatories of today, future gravitational-wave detectors could be just a few metres long. That is the goal of physicists in the UK and the Netherlands, who have put forward a design for a matter-wave interferometer that would rely on the superposition of tiny objects such as diamond crystals rather than laser beams. They say that the device would be sensitive to low- and mid-frequency gravitational waves.
Gravitational waves were first observed directly in 2015, when the LIGO observatory in the US picked up the emission from a pair of merging black holes. These black holes broadcast a series of ripples through space-time that caused the pairs of perpendicular arms making up LIGO's interferometers to undergo a series of miniscule expansions and contractions. Those tiny changes were registered as variations in the interference between laser beams sent along the arms.
Such laser-based observatories, however, are very large. A passing gravitational wave will typically induce fractional length changes on the order of 10-19 or less, meaning that the detector's arms must be several kilometres long if the facility is to yield a reasonable signal above the many sources of background noise. In the case of LIGO, each arm extends for 4 km.
Tiny wavelength
The latest work proposes a far smaller type of observatory based on interfering beams of matter rather than light. The particles in question would have a mass of about 10-17 kg, corresponding to a de Broglie wavelength of 10-17 m. This is about 100 billion times smaller than the wavelength of laser light used in existing observatories and could be exploited in an interferometer measuring as little as 1 m in length.
The scheme has been put forward by Sougato Bose, Ryan Marshman and colleagues at University College London, together with researchers at the universities of Groningen and Warwick. It involves a Stern-Gerlach interferometer and nanometre-sized crystals containing embedded spins. Although several types of crystal could do the job, the researchers suggest diamond containing a nitrogen-vacancy centre spin - a system already used to make spin-qubit quantum computers.
The device has yet to be built, but it would involve trapping, uncharging and cooling the crystals before using microwaves to place their spins in a superposition of spin-0 and spin-1. Released from the trap and exposed to a suitable magnetic-field gradient, the two spin states would then separate out in space so that the spin-0 component travels forward horizontally while the spin-1 part follows a parabolic trajectory. After a certain distance, the two spin states would meet up again.
Spin-separated states
Bose and colleagues originally developed this type of interferometry to make very precise measurements of gravitational acceleration to study the quantum character of gravity. The idea is that the spin-separated states experience different accelerations as they follow different paths through the gravitational field. This results in a phase difference between them at the far end, which can be measured by counting the relative abundance of spin states over a given number of runs.
However, the researchers realized that the device could in principle be made sensitive enough to also detect gravitational waves. In this case, a wave changes the spatial separation of the two paths as it passes through the apparatus - resulting in a sinusoidal oscillation of the spin states' phase difference.
Bose and colleagues say that their device would have a number of significant advantages compared to laser interferometers. Because the phase difference accumulates only while the crystals are traversing the interferometer, the output signal would be independent of any thermal, seismic or other noise that occurs before the particles are placed in a superposition. What is more, the absence of laser-based position measurements removes radiation pressure noise, while exact knowledge about the number of nanoparticles in the interferometer avoids shot noise.
Underground or in space
The researchers say that their interferometer – with perhaps several copies operating in parallel - would be most sensitive to relatively low-frequency gravitational waves. Located underground, they say it could cover part of the range to be targeted by the LISA space-based observatory - about 10-6 Hz-10 Hz. If operated in space, it should be able to cover all LISA's proposed territory.
Shimon Kolkowitz of the University of Wisconsin-Madison in the US points out that many other proposals based on matter-wave interferometry use atoms to detect laser phase rather than gravitational waves themselves. The new approach is therefore more direct, he says, but also riskier. “[It is] based off of a technology that has yet to be realized and that will require major technical breakthroughs,” he says. “But it could be quite impactful.”
Bose says that he and his colleagues are confident they can overcome all the technical hurdles. In particular, they are looking to create a large magnetic-field gradient without having to generate a particularly high field – by sequentially turning on a series of flat carbon nanotubes in a stepped formation to approximate a particle's parabolic trajectory. Looking to build a small-scale prototype within a decade, he “optimistically” estimates that the cost of reliable solid-state qubits and a large-scale atomic interferometer could each run into the tens of millions.