How to train the medical physicists of the future

Radiotherapy is a continually evolving modality, with technology advances enabling increasingly personalized and adaptive treatments. Alongside, the medical physicists of the future will need to keep up with these developments.

At the recent ESTRO 38 meeting in Milan, a conference debate examined the skills that medical physicists will require in 10 years’ time, and asked how training for medical physicists specializing in radiation oncology should develop over the next decade. Five expert speakers presented their thoughts — and then let the audience decide.

Imaging is essential

First up, Daniela Thorwarth from University Hospital Tübingen made the case that imaging knowledge will be the most important for future medical physicists.

She began by looking at the current radiotherapy training regime for medical physicists in Europe. This includes areas such as fundamental radiation biology, basic radiation protection, exposure effects and how to deal with accidental exposure. There are also special courses covering, for example, clinical dosimetry or treatment planning. None of these, however, involve imaging.

But imaging plays an integral role in all areas of radiotherapy, Thorwarth emphasized. CT is used for treatment planning, dose calculation and target delineation; images are used for patient positioning, tumour staging, response monitoring, functional characterization, plan adaptation and proton range verification; the list goes on.

“Imaging already has place in clinical practice,” Thorwarth told the delegates. “We need to know how to handle these images properly.” And in future, medical physicists need to be ready to incorporate even more imaging into their working days. “I believe that in 10 years, every patient will receive personalized, online-adaptive, functional image-guided, biologically individualized radiotherapy,” she said.

And the future has already started, Thorwarth added, citing the emergence of MRI-guided radiotherapy, which enables daily online guidance. Quantitative imaging, using PET/MR imaging, for example, will enable further personalization of radiotherapy dose prescriptions. This will require additional training, and “dedicated QA procedures that may take us out of our comfort zone,” she notes.

“To be ready for the future of radiation oncology, we need to train medical physicists to become experts in imaging for radiotherapy,” Thorwarth concluded.

Modelling masterclass

The second speaker was Ludvig Muren from Aarhus University, who proposed that what medical physicists will really need is training in mathematical modelling. He pointed out that predictive models form the very basis of radiotherapy, namely the radiation dose–response curves, which were generated from radiobiological modelling. “This is an underexplored interdisciplinary area,” he said.

Muren explained that medical physicists have a natural talent for identifying, describing and solving problems, by building mathematical models and fitting complex data to these models. But they may not necessarily be as skilled at understanding the limitations of model assumptions when working with real-life data. Citing his experience as a journal editor, he noted that basic statistics knowledge is one of the most common problems in submitted research papers.

Moreover, trends in radiobiological modelling are changing and increasing in complexity as new data types are available as model inputs. For instance, future models for tumour control and normal tissue effects may account for inter- and intra-fraction variations and spatial effects, or incorporate time-dependent endpoint definitions. “I think this is a very interesting area for medical physics research,” Muren said.

Another factor is the introduction of “big data”, which aims to make all outcome data available. While existing models are mostly based on clinical trial data, with some 97% of patients treated outside trials, big data could provide a major opportunity. There are considerable challenges, such as standardization and data accessibility, for example, but Muren predicts that these can be solved.

“Medical physicists should strengthen their basic medical statistics knowledge and learn how to apply and validate increasingly complex radiobiological models,” Muren concluded.

Computational skills

In a similar vein, Ben Heijmen from Erasmus MC argued that medical physicists should receive training in broad computational skills. “Computation is the future of our field,” he said.

In 10 years, Heijmen predicted, physicists will need the expertise to deal with areas such as workflow automation, computer optimization, artificial intelligence and machine learning, as well as advanced statistical modelling and image processing. “I don’t think this is needed only for predictive modelling, computational skills have more broad applications,” he noted.

One example is the use of deep learning algorithms for automated image delineation, an emerging application that could save clinicians time during treatment planning. “The ability to automate in a reliable way will have a big impact,” said Heijmen. Elsewhere, statistical modelling could be used to verify treatment plans, and virtual SPECT/CT scans could be generated for functional avoidance-based planning. “Complex computation is responsible for major breakthroughs and will increasingly do so,” he added.

Another example is beam calibration, one of principal responsibilities of a medical physicist. “We have to do this in a more clever, faster, automated way,” said Heijmen. “We are good at computational methods, and if we get more training, it’ll be much easier and more fun.”

Heijmen rounded off his talk by sharing the topics on offer at the forthcoming 3rd ESTRO Physics workshop. These include computational methods for target volume definition, data fusion for decision support systems, and implementation of artificial intelligence techniques. “If you don’t believe me, believe them,” he told the audience. “Computation is where it will go.”

Taking charge

Next up, Julian Malicki from the Greater Poland Cancer Centre suggested that management and leadership skills will be most essential for future medical physicists. “I believe that this is something that physicists need to acquire because they want a better position for their group in the healthcare system,” he explained.

As a leader, Malicki noted, one can influence the direction that others follow, the field that gets the most resources and, ultimately, the discipline that develops the fastest. As such, it is important to be a leader or at least to have a leader from within your own group, he pointed out.

He described how some people naturally want to be leaders, are skilled and well trained and become a success. Others come to leadership via hard work and competency. “We should, as a group of physicists, actively seek this opportunity to be leaders,” he said. Possible roles include head of a radiotherapy department, head of an entire cancer institute or even a university Dean. Such roles are not usually held by medical physicists, but why not, Malicki asked.

Malicki concluded by emphasizing the importance of having a physicist in a leadership position. A leader can allocate money and manpower, and make the life of a medical physics group easier, he said. Crucially, they can also prevent a decline of the position of physicists within the healthcare system. And to enable this, it’s vital that management and leadership competences are included in the curriculum for future training of medical physicists.

Back to basics

The final speaker was Giovanna Gagliardi from the Karolinska Institutet. Gagliardi aimed to persuade the audience that future training must simply include more basic physics skills or, equivalently, must reinforce physics knowledge. “We have a responsibility in training the next generation,” she said.

She listed some of the techniques current deployed in clinical departments. These include imaging modalities such as CT, MR, PET/CT and on-board imaging devices; plus treatment systems, including CyberKnife and tomotherapy, brachytherapy, and proton and heavy ion systems. Tasks today include basic dosimetry, physics of radiation interactions with matter and creating treatment planning algorithms, to name just a few.

Future requirements will include calculating the passage of charged particles in a magnetic field for MR-linac treatments, physics with kilovoltage photons used in animal irradiations, mixed modalities and more. “In 2019, there is an enormous quantity of heavy technology that requires basic physics knowledge,” Gagliardi explained. “And the requirement of physics knowledge is getting larger.”

Medical physicists are increasingly tasked with delivering radiotherapy that is safe, high-quality, justified, optimized, state-of-the-art and individualized. “We need to know physics because we need to know what to do,” she said.

Gagliardi cited an example from the past — the introduction of stereotactic body radiotherapy — which needed a large quantity of physics knowledge. Today, the increasing proliferation of proton facilities requires “major education to learn the required physics”. Looking to the future, she cited GaToroid, a non-rotating hadron therapy gantry under development at CERN. “Physics is very good at inventing new solutions and applying them,” she pointed out. “These sorts of ideas can be important for the future of radiotherapy.”

“Training in more basic physics is not about cutting-edge skills,” she concluded. “It is the understanding and application of well-established physics. This is what the content of future education courses should be.”

The audience decides…

In an ensuing discussion, some delegates pointed out that medical physicists can’t be all things to all people. For example, mathematicians and other physics groups will be looking at big data, and it may be better to collaborate with them. One audience member emphasized that medical physicists are already trained to be scientists. “We probably need to know something about all of these things, and need to know what we don’t know and where to find that from,” he said.

The ultimate winner was decided by a show-of-hands vote. And the winner? The ESTRO delegates decided that basic physics skills are the most important training requirements for future medical physicists.

Science needs to improve the transparency of research results, says report

Researchers must describe in a “clear, specific and complete way” how they obtain scientific results if reproducibility and replicability in science is to be upheld. That is according to a new report by the US National Academies of Sciences, Engineering and Medicine, which also calls on funding agencies to invest in open-source, usable tools to boost reproducibility in science.

The report, released yesterday, says that although scientists usually understand the difference between reproducibility and replicability, some fields interchange the terms or have one as an umbrella expression for both. The report defines reproducibility as “obtaining consistent results using the same input data, computational steps, methods, code and conditions of analysis”, while replicability is “obtaining consistent results across studies aimed at answering the same scientific question, each of which has obtained its own data”.

The report states that while reproducibility and replicability are not pertinent methods when observing unique events or ephemeral phenomenon, rigorous descriptions and record keeping are still required to help understand and communicate the result. The NASEM report also recommends that journals should consider ways to ensure reproducibility for publications that make claims based on computational methods, “to the extent ethically and legally possible”. This could, for example, involve journals appointing a “reproducibility editor” to oversee such endeavours, according to Lorena Barba, a mechanical and aerospace engineer from George Washington University, who served on the 13-strong committee that wrote the report.

While not a model for all science, the report highlights how the CERN particle-physics lab shares data and results in a very complex environment. The Geneva lab uses a four-step process to handle the huge volume of data emerging from proton-proton collisions. Data are first collected, processed and stored before being released for analysis. The third step involves the resulting analysis and related documentation being preserved in a trusted long-term digital repository and then finally published for public consumption.

Transparent not opaque

Report chair Harvey Fineberg, president of the Gordon and Betty Moore Foundation, told Physics World that the report stresses that it is “essential” for scientists to characterise uncertainty in every finding. “We wanted to put this report and its focus on the concepts of reproducibility and replicability in the context of this larger purpose of gaining confidence in the knowledge that emerges from science,” he says. “If there is a theme I would stress in this report it is the concept of transparency – the notion of making available the data, the code, the computer and computational environment, the digital artefacts that support going from original data to whatever conclusions you reached.”

Barba notes that the committee understands that transparency is not easy given that most scientific endeavours are highly computational and reliant on complex data flows. “There are, of course, challenges to changing our norms of communication in fields like physics and my field of computational fluid dynamics,” Barba told Physics World. “What we are calling for is changing those norms to give importance to the full set of digital objects that are part of a scientific study and acknowledging that the scientific paper is insufficient today in its methods section to include all of the information needed for another researcher to confirm the results or build from those results.”

Water is magnetized when taken for a spin

Physicists in the US have shown that rotating matter at high speeds can magnetize atomic nuclei – 104 years after physicist Samuel Barnett showed the same could be done with electrons. The researchers found that by spinning a small sample of water at thousands of revolutions a second inside a nuclear magnetic resonance device, they could increase the magnetization of hydrogen nuclei by up to about 3%. The result has been touted as the first-ever observation of the nuclear Barnett effect, however, a scientist in Japan points-out that similar work was done there in 2014.

The idea that an object’s rotation and magnetization are coupled was first predicted by Owen Richardson in 1908. He reasoned that the angular momenta of electrons in an unconfined and uncharged object placed in a magnetic field would tend to line up along the axis of magnetization. Electrons would therefore rotate around that axis, with conservation of momentum then dictating that the object’s bulk turns in the opposite direction.

Albert Einstein and Wander Johannes de Haas observed this effect seven years later by suspending a ferromagnetic rod inside a cylindrical coil that set up a magnetic field along the rod’s axis. They found that when they switched on the current in the coil the rod started to rotate, so demonstrating that magnetism is in fact due to the combined magnetic moment of orbiting electrons. In a curious twist, the angular momentum they recorded agreed with theory at the time, but was later shown to be twice as big as it should have been once electron spin was factored in.

Correct value

At the same time, however, Barnett demonstrated the opposite effect. He showed in a long series of experiments that a freely-hanging ferromagnetic rod is magnetized when rotated along its axis at high speeds. What is more, the magnitude of the effect that he measured was close to the correct value, even though it seemed wrong at the time.

Now, Tycho Sleator and Mohsen Arabgol at New York University have measured this “Barnett effect” in nuclei, rather than electrons. Doing so is more difficult because protons and neutrons are far heavier than electrons, meaning they have far smaller magnetic moments.

The duo used nuclear magnetic resonance (NMR), which subjects a sample to a strong magnetic field to align the spins of certain nuclei – in this case protons (hydrogen nuclei) within water. The proton spins can exist in one of two energy states, and when exposed to electromagnetic pulses with just the right frequency some proton spins will flip to the higher energy state. After each pulse, protons return to the lower energy state and precess around the magnetic field lines as they do so. This modulates the magnetic field at the precession frequency and this signal is detected in a receiving coil. The basic idea of this latest experiment is to rotate a sample of water at high speed inside an NMR machine and measure the extent to which the proton spins are aligned, or polarized, by being rotated — after accounting for the effect of the machine’s magnetic field.

Spin cycle

The researchers originally intended to exploit the effect in brain imaging, by shining X-rays with orbital angular momentum at a person’s head to rotate water molecules and so enhance the output signal. That was not a success, but the duo discovered they could buy commercial high-speed spinning devices and so opted instead to rotate samples of molecules mechanically.

“We stumbled on this and realized we might be able to do the experiment by spinning the sample,” says Sleator.  “And it seemed like no one had done that before.”

They put water inside a capsule 8 mm long and 2 mm in diameter. This was placed within the commercial spinner, which was then put inside an NMR device. They set the spinner rotating at different rates and measured how proton polarization varied as a result. If the protons really were being polarized by sample rotation, then the NMR signal – which is proportional to the magnetization and precession frequency – should have risen in line with the spin rate.

Theory predicts that there should be a 1% rise in magnetization at 4500 revolutions per second (rps), a 2% increase at 9000 rps, and a 3% jump at 13,500 rps. And that, within experimental error, was what they observed. They also confirmed that the higher magnetization was not due to any real magnetic field being set up inside the sample, since they saw no rise in the precession frequency, which is proportional to magnetic field strength.

Writing in Physical Review LettersArabgol and Sleator say, “We have made the first observation of the nuclear Barnett effect”. However, one researcher who wishes to remain anonymous questions just how novel the latest research is. In 2014 a group at the Japan Atomic Energy Agency reported observing “emergent Barnett fields” by rotating an NMR coil together with various powdered solids at high speeds. “Nuclear magnetization is proportional to magnetic fields,” says one of the group members, “and, for me, these two findings convey almost the same message”.


Local prosumers or global supergrids: a question of scale

Most people can now, in theory, generate at least some of their own energy using solar cells. Some say that photovoltaic (PV) solar self-generation by “prosumers” represents an archetypical “destructive innovation”, challenging and changing market and industrial paradigms. In a seminal paper in the journal Energy Policy, Ruggero Schleicher-Tappeser said that PV allowed consumers of all sizes to produce power themselves: “new actors in the power market can begin operating with a new bottom-up control logic”. He added that the “increasing autonomy and flexibility of consumers challenges the top-down control logic of traditional power supply and pushes for a more decentralised and multi-layered system”.

That harks back to the radical agenda outlined by the late Hermann Scheer in his 2005 Solar Manifesto: “Since everybody can actively take part, even on an individual basis, a solar strategy is ‘open’ in terms of public involvement. It will become possible to undermine the traditional energy system with highly efficient small-technology systems, and to launch a rebellion with thousands of individual steps that will evolve into a revolution of millions of individual steps.”

He argued that large scale Desertec-type “supergrid” schemes, importing power long-distance from huge solar projects in North Africa, would “duplicate the current system” of centralized power and institutional control, whereby energy production and distribution is concentrated in the hands of a few multinational companies. In 2009 he told the Guardian that “we should be looking instead at decentralizing the system, and looking closer to home for our energy supplies, such as solar panels on homes or harnessing wind energy on the coasts, or inland”.

That is basically what happened in Germany. The proposed Desertec scheme was sidelined and most of the effort has gone into local- and national-level projects, with a lot of PV prosumers emerging, along with many community-based projects and green energy co-ops. Around 40% of Germany’s green power comes from them.

Small is beautiful

The small-scale decentralist position certainly has many merits. Technically, it can avoid long-distance transmission energy losses. Politically, it has become clear that locally controlled and owned projects are far more acceptable to local people than large projects imposed on them by corporate groups.

Nevertheless, not everyone is convinced that, technically, renewables can be developed sufficiently to meet all energy needs just on a small-scale local basis, using technologies like wind and PV. Solar may well be suited to local small-scale deployment but some of the other technologies are much more efficient on a large scale, for example wind turbines. If they are located on higher wind speed sites than are available to most urban/suburban communities, their energy output will benefit from the square law on blade size and the cube law on wind speed. Similar economies of scale apply to offshore wind, wave and tidal projects, most of which will be geographically remote from centres of population. What’s more, there is the issue of balancing power. It is harder to do that at the local level — you need a wider geographical spread.

A 2015 Greenpeace scenario suggested that in theory, in most places up to 70% of energy could be generated and used on a local basis, with only perhaps 30% involving larger-scale systems and grid trading. However, the 70/30 ratio seems unlikely to be viable except in some areas. Renewable sources are not available to all to the same extent. A fully decentralised system, based on local prosumers and community-scaled projects, would need more (oversized) local capacity in order to maintain stable supplies than if you could rely on grid imports and longer-distance supergrids. So there could be a cost implication.

The debate continues to this day, with local storage adding a new dimension — in theory it should aid localization. Indra Overland, a member of the International Renewable Energy Agency’s research panel on the geopolitics of the energy transition, has said “for prosumers to get by without grids, radically improved energy storage technology would have to emerge”. However, that’s what is emerging with new cheaper batteries and there are certainly examples of attempts to go for local power backed up with storage, along with many inspiring community-led initiatives and plans, as I reported in an earlier post, even if most of these involve grid links and, increasingly, the development of local mini-grid-based trading.

Supergrids are back

At the other end of the scale, meanwhile, there has been a revival of supergrid ideas. For example, there have been proposals for supergrid projects in Asia, linking proposed concentrated solar power (CSP) Gobitec projects in Mongolia and the Gobi desert to energy demand centres in China, South Korea and even Japan. A variant of this idea, promoted by the Japanese Softbank Group and Japan’s Renewable Energy Institute, is the so-called Golden Ring. Wind energy generated in Mongolia would be transmitted to China and South Korea and, undersea, on to Japan along with hydro from Russia. Companies in each region have expressed interest, with the costs for transmission put at 10.5 cents/kWh or less — about the same as the cost of coal-fired power in Japan.

Going even further, a recent study looked at possible long-distance links between Asia and Europe — an electric “silk road”. Another study investigated a 4 GW link between North America and Europe, which it is claimed would be cost-effective. What’s more, China has reportedly been looking seriously at the idea of a global grid.

Long-distance power transfer is not as fanciful as it might seem. As a first step, many existing national grids can be linked up fairly easily without major new cabling. But for longer distances, full supergrids are needed. That’s where high-voltage direct current (HVDC) links come into their own. HVDC, and ultrahigh-voltage DC even more so, can have much lower losses, at 2-3%/1000 km compared to conventional HVAC grids at up to 10%/1000 km. These DC links allow power to be transmitted from places where it is currently available to where it is needed. That’s being done in China, with 30,000 km of 8 GW capacity UHVDC links, coupled with local HVAC links, already in place to connect the big demand centres in the south and east to the main green energy sources in the north and west. With the technology improving, we can expect more like that. New higher speed high-voltage AC/DC switchgear allows for easier local uploading and downloading of power and, combined with “smart” grid management systems, can improve system integration and efficiency. So smart supergrid networks could become even more suited to balancing variable renewables, regionally and possibly even globally.

However, there are some issues. While it is useful to be able to import green power when there is a local lull, and at other times to export surpluses, that depends on there being power available to import, or demand for exported power, at the right time and price. Some would say it will be safer and more secure from a national perspective to store any excess for later use locally.

Linking up the Americas

That issue has surfaced in a new study by Lappeenranta University of Technology in Finland and the University of São Paulo in Brazil, who looked at North and South America. It concludes that both can get to 100% renewables, as studies by Mark Jacobson et al and earlier Energy Watch Group/LUT studies have shown, and that area/regional grids can help with balancing and trade. However, it found that North–South links are harder, not just because the distances are too great – HVDC should be able to cope with that – but also since access paths south are constrained and major centres of population are not handily located.

The analysis of the Americas is complicated by the approach that has evolved in the US, where there are few inter-links between the main regional grid systems, which cover very large multi-state areas. The lack of long-distance integration is under challenge but in many US renewable energy studies “integration” still just means local regional grid upgrades. Perhaps unsurprisingly then, local storage is often favoured – it’s getting cheaper too.

That pattern shows up in this new study; local storage often looks easier. It’s further complicated by the fact that the US uses a lot of piped and/or tanked gas and oil. The new study looks at shipments by tanker of Brazilian synthetic natural gas (SNG), as liquefied natural gas (LNG), which may fit with the existing pattern better than long-distance power transmission – partly since it can be stored.

The paper’s one-line summary says, a little baldly: “Long-distance transmission lines cannot compete with energy storage technologies.” However, it is less keen on large focused solar CSP projects with molten salt heat storage, which is seen by Jacobson et al as a key part of their proposed US balancing system. The grid vs storage debate can clearly get quite complex and intense. So can the linked debate over large hydro — see my next post.

A question of timing

SpaceX Crew Dragon 2

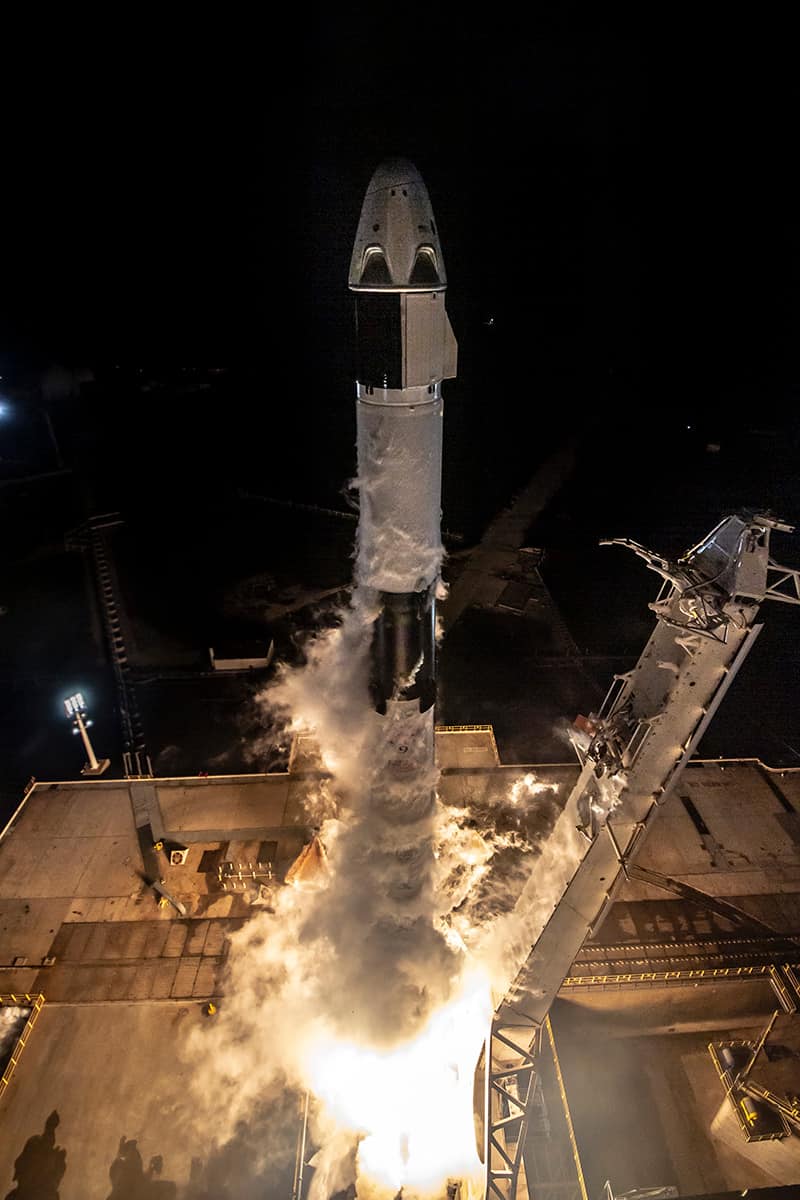
I hope you didn’t miss the recent excitement surrounding the private US space company SpaceX. Back in March it launched a space capsule called Crew Dragon that docked with the International Space Station (ISS) and then returned to Earth. What made this mission so momentous – and for me had the real “wow factor” – was that the capsule was fired into space using a reusable launch rocket.

On any space mission, the launch rocket contains the main engines and most of the fuel needed to blast the satellite or capsule into space. Usually this first stage detaches from the rocket a few minutes after launch and returns unceremoniously to Earth, most often by crashing into the sea as scrap. With SpaceX’s rockets, however, the first stage is designed to make a controlled descent back to Earth – either landing on solid ground or on one of the company’s autonomous drone ships.

While the Crew Dragon capsule contained just a dummy astronaut, the mission proved that the commercial space sector is now firmly in the business of launching not just satellites, but people too.

SpaceX has been working on this technology since 2011 and what makes it good business sense is that it costs just a few million dollars to refurbish the launch rocket, whereas building one from scratch each time would be a whole lot more. Founded by the entrepreneur Elon Musk in 2002, SpaceX carried out 21 separate test launches in 2018. The odd booster rocket missed its landing spot, but hey, that’s all just part of getting a product debugged.

Perhaps the most notable mission that year took place on 6 February 2018 when the Falcon Heavy rocket blasted off. It can take 64 tonnes of kit into space – twice as much cargo as any other platform at apparently a third of the cost. But realizing it was risky to carry commercial cargo on a first launch, Musk decided to launch it with his own, personal cherry-red Tesla Roadster electric sports car.

Installed with a dummy astronaut at the wheel – named Starman after the 1972 David Bowie hit – the car was sent into an elliptical orbit beyond the orbit of Mars. Musk is a sometimes controversial figure, but I had to admire the sheer showmanship of this mission, especially when the car’s satnav screen showed the message DON’T PANIC in reference to the Douglas Adams novel The Hitchhiker’s Guide to the Galaxy.

In this particular SpaceX launch, the two orbital boosters landed elegantly side by side on the launch pad, showing that the firm’s reusable launch system has become a reality – obviously the way forward.

Electric dreams

Like many successful entrepreneurs, Musk, 47, has a history of getting his timing right. Having studied physics and business at the University of Pennsylvania, he began a PhD in applied physics at Stanford University in 1995, just as the Web was taking off. Musk dropped out after barely two days, co-founding Zip2, a Web software company that was bought by Compaq in 1999 for $340m. With the dot.com boom in full stride, Musk then set up X.com, an online bank that became PayPal and was bought by eBay for $1.5bn in 2002. By 2016 Forbes magazine had listed him as the world’s 21st most powerful person.

Musk’s success with electric vehicles (Tesla) has been another example of his good sense of timing. Electric cars aren’t a new idea of course. First prototyped in the 1830s, they came to prominence after the French physicist Gaston Planté invented the rechargeable lead–acid battery in 1859. Well-heeled customers, particularly in US cities, liked the fact that electric vehicles started easily, weren’t smelly or noisy, and didn’t require gears. Indeed, by the turn of the 20th century, 38% of all cars sold in the US were electric, with 40% being powered by steam and 22% by petrol – this was the first golden age of electric vehicles. But not being able to travel fast or far, electric vehicles dwindled in popularity, relegated to niche products like milk floats.

Musk, however, saw the growing viability of electric cars, driven by rising petrol prices, growing environmental concerns plus huge advances in battery technology and electric motors. In 2004 he began investing in Tesla Motors, which had been founded the previous year by the US engineers and entrepreneurs Martin Eberhard and Marc Tarpenning. With Musk as chair of the board, Tesla’s goal was to commercialize electric vehicles, starting with a premium sports car aimed at “early adopters” before moving into more mainstream vehicles.

In deciding to invest in Tesla, Musk realized that all the issues with electric vehicles – poor range, long charge time, lack of charging networks, high operating costs and low speeds – could and would be addressed through a manageable programme of technological development. In fact, I would say that Tesla – under Musk’s leadership – has changed how people think about electric cars.

The one remaining hurdle is that electric cars are expensive, although Tesla seems to be addressing that issue with its family-sized Model 3 car. However, for electric cars to truly become mainstream, a further step change is needed in cost that will probably require commercial and government help to deliver. It’s one reason why the UK government in 2017 announced a £250m, four-year Faraday Challenge investment in developing cheaper and better batteries for electric vehicles.

Timing, timing, timing

When it comes to commercial success, timing is all important. Great entrepreneurs, such as Musk, are like master surfers, waiting for the next big wave, which they usually catch perfectly. It requires a different mindset to everyone else, a level of determination and self-confidence to succeed that most people lack.

Not every great entrepreneurial idea works. And sometimes that self-confidence can backfire: Musk had to step down as Tesla chair in late-2018 as part of a fraud settlement with US authorities over his Tweets about the firm’s finances. Still, people like Musk are making physics and engineering really cool again. That’s one thing that’s inspiring and great to see.

UK Committee on Climate Change recommends net zero emissions by 2050

On Thursday 2nd May, the morning after the UK Parliament voted to declare a climate emergency, the Committee on Climate Change advised that the UK should completely eliminate net greenhouse gas emissions by 2050.

This would require dramatic changes across all sectors, including aviation, shipping and agriculture. While many cuts could be achieved with changes to technologies and fuels, around 60% would require some societal or behavioural changes.

“This can only be achieved if we pay attention to it throughout all the things we do at home, in our communities, the country, and internationally,” says Joeri Rogelj of Imperial College London.

Nevertheless, the report stresses that net zero could be reached with existing technologies, such as batteries and renewables, as well as some more speculative options such as direct air capture or carbon-neutral synthetic fuels. “There are no unicorns here,” said Chris Stark, Chief Executive of the Committee on Climate Change at the report’s launch.

Thanks to rapid technological improvements, the estimated cost of the transition is just 1-2% of GDP – the same as 80% reductions were expected to cost when that target was set out in 2008.

“It’s an important milestone,” says Josh Burke of the Grantham Research Institute at LSE, “but it’s what should be expected of the UK given our legacy as a highly polluting country in the past.”

Established in 2008, the UK Committee on Climate Change advises the UK government on targets for cutting emissions. Its new report advises that net zero emissions can and should be achieved by the middle of the century for all greenhouse gases, not just carbon dioxide.

Policy pick

Policies the Net Zero report calls for include:

  • a supply of low-carbon electricity, which will need to quadruple by 2050
  • efficient buildings and low-carbon heating throughout the UK’s building stock
  • electric vehicles as the only option from 2035 or earlier
  • developing carbon capture and storage technology and low-carbon hydrogen as a necessity not an option
  • stopping biodegradable waste going to landfill
  • phasing-out potent fluorinated gases
  • increasing tree planting
  • reducing emissions on farms

Peak concern?

The report arrives as concern for the environment is peaking. Climate strikes have seen tens of thousands of young people taking to the streets, while Extinction Rebellion protests have brought disruption – and over one thousand arrests – to London. Coupled with a recent primetime television documentary presented by David Attenborough, mentions of climate change in the media have been at near-record levels.

The call from the Committee on Climate Change follows last year’s special report from the Intergovernmental Panel on Climate Change (IPCC). That report made clear that limiting warming to 1.5 ˚C – an aim of the Paris Agreement – would reduce impacts from extreme weather events, agricultural disruption and species loss.

With warming already at around 1 ˚C, this 1.5 ˚C goal would require global carbon dioxide emissions to fall to net zero by the middle of the century, with other greenhouse gases following in 2070. Aiming for net zero greenhouse gas emissions ahead of this date “shows a level of ambition”, says Burke. However, Rogelj, who was a coordinating lead author on the IPCC report, points out that rich nations could do even more “by supporting developing countries with technologies, know-how, and funding”.

Despite the CCC report’s ambitious proposal, the UK is struggling with the targets it has already set. Electricity generation has decarbonised rapidly and by 2025 half of the UK’s electricity is set to come from renewable sources. But with other emissions sources such as heating and transport seeing little change, the UK is currently on course to miss its legally binding 2030 targets by as much as 20%.

“It is important that the UK walks the talk and ensures that its ambition is translated into effective action,” says Rogelj.

Shifting fundamental constants could be revealed by shrinking crystals

Possible variations in some fundamental physical constants could be detected by the very careful monitoring of the distances between atoms in a crystal. That is the conclusion of a new theoretical study by an international team of physicists including Lukáš Pašteka of Comenius University in Slovakia.  If realized in the lab, experiments that look for tiny changes in the size of crystalline materials could point to extensions to the Standard Model of particle physics.

While the Standard Model of particle physics has been remarkably successful at describing elementary particles and how they interact, we know that the model does not paint a complete picture of nature – it does not describe neutrino masses and dark matter, for example. Physicists are therefore very keen to find further instances of where the model does not apply, which could provide important guidance about how the Standard Model could be extended.

One avenue of exploration is the possible variation of quantities that are assumed by the Standard Model to be fundamental constants of nature and therefore invariant in both space and time. These include the fine structure constant – which is a measure of the strength of the electromagnetic interaction – and the ratio of the masses of the proton and electron.

Sizing-up materials

Past searches for variations include looking for shifts in the atomic and molecular spectra of distant astronomical objects and changes in the timekeeping of highly accurate atomic clocks. So far, however, all attempts have been unsuccessful – at least within their measurement accuracies. Undeterred, a new generation of experiments are being planned and Pašteka’s team believe that systematic measurements of the sizes of solid-state materials should join the ranks.

The team calculated how certain solid-state materials and diatomic molecules would respond to hypothetical changes in the fine structure constant and proton-electron mass ratio. They reckon that a fractional increase in the fine structure constant of 10-17/year (the current experimental upper limit on its temporal variation) would cause a gold bar to shrink by a factor of 10-18/year, while a germanium crystal would grow by a factor of 10-21/year.

Pašteka and colleagues also argue that by monitoring crystals over several years using advanced optical cavity and resonant-mass detection techniques, these tiny changes could be measured. Another possibility put forth by the team is using a set-up like the LIGO and Virgo interferometers – kilometre-scale experiments that detect gravitational waves by measuring fractional changes in length as small as 10-22. With some modification, Pašteka’s team believe that such instruments could be used to look for variations in fundamental constants.

The physicists now hope to further improve the prospects of their method by identifying materials with higher sensitivity coefficients.

The research is described in Physical Review Letters.

One step closer to in vitro blood production

Decellularized cancellous bone implantation

Blood transplantation is currently the treatment of choice for a wide range of medical conditions, including pathologies such as cancer or acute events like severe burns or trauma. Lack of donated blood is a reason for concern, and when it occurs, can represent the difference between life and death for a patient. For this reason, many researchers are focused on achieving blood production, or haematopoiesis, in vitro.

Naoko Nakamura from Shibaura Institute of Technology and colleagues have described the use of decellularized cancellous bone (DCB) derived from porcine rib as an innovative support for the recruitment of haematopoietic stem cells (the source of all blood cells) in vivo. The team was able to decellularize the cancellous bone fragments without affecting the complex microenvironment required to support the homing of haematopoietic stem cells. Once the cells were recruited in vivo, they began to produce fresh blood cells as they would do in their natural environment (ACS Biomater. Sci. Eng. 10.1021/acsbiomaterials.8b01491).

Description of the haematopoietic niche — the microenvironment in which blood production takes place — is the first milestone in the bold challenge of in vivo blood production. Such a description was produced back in 1973, and since then, researchers have isolated, characterized and expanded the various cell types that can be found in such a niche.

Researchers are now working to understand all the complexities of the haematopoietic microenvironment, in order to reproduce it and to achieve in vitro blood production. Such advancement could be helpful, not only to provide a virtually unlimited source of blood, but also as a valuable tool for the study of blood generation and blood pathologies.

Haematopoietic stem cells have already been isolated and cultured. Moreover, they have also been obtained via the differentiation of induced pluripotent stem cells, making it possible to obtain haematopoietic stem cells without the invasive procedure otherwise  needed to isolate them from the patient’s own bone marrow. However, researchers are currently unable to culture them in such a way to obtain the complexity of the native blood. Therefore, efforts are currently underway to produce scaffolds capable of mimicking the native haematopoietic niche.

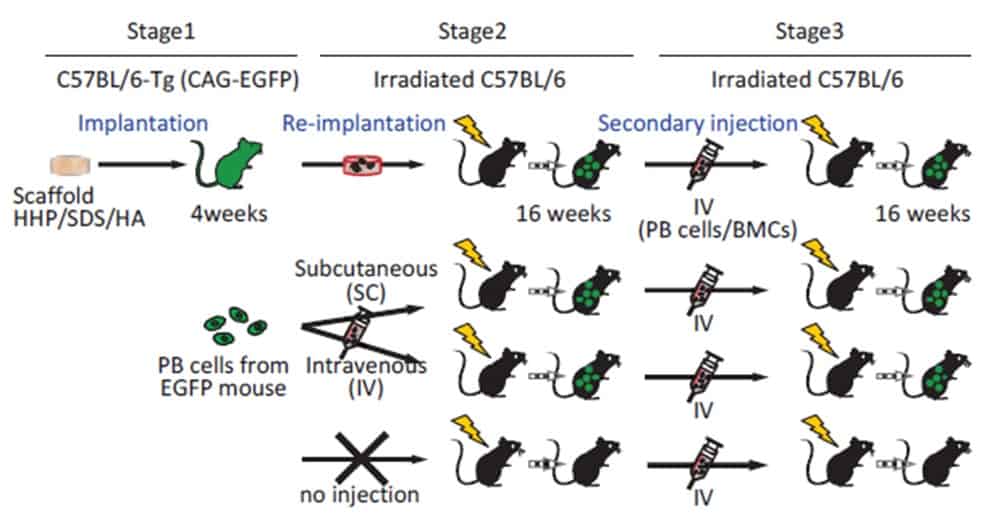
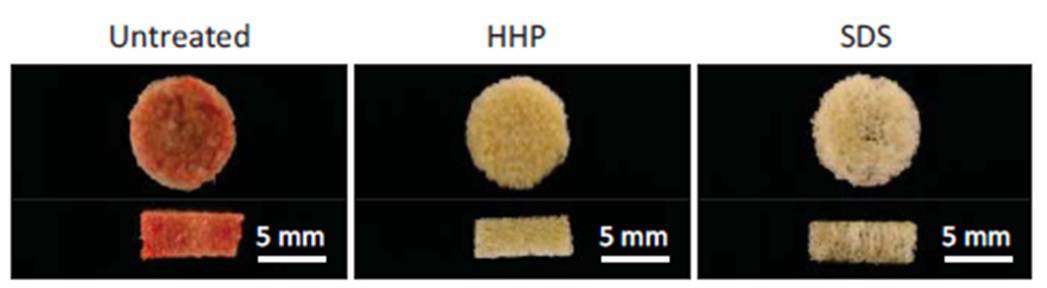
In this study, Nakamura and colleagues evaluated the use of decellularized bone as a scaffold to recruit long-term haematopoietic cells. First, they determined whether high hydrostatic pressure (HHP) or sodium dodecyl sulphate (SDS) treatment would be the best to obtain DCB. To do so, they measured the efficiency in decellularization and evaluated the quality of the obtained scaffolds. The team also examined the ability of DCB to support the growth and differentiation of mesenchymal stem cells, a  supporting cell type for the haematopoietic niche that can help recruit haematopoietic stem cells. Although SDS was superior in the removal of DNA residuals, both methods were equally efficient in cell removal and mesenchymal stem cells support, while only HHP preserved an  intact extracellular environment.

Untreated and treated porcine bone

The team subcutaneously implanted the DCBs in mice, and observed that they were appreciably re-cellularized by their host. A closer look at their cellular population four weeks after implantation showed the presence of numerous blood progenitor cells, indicating an active haematopoietic state.

To understand whether such recruited cells were capable of long-term blood production, the researchers further transplanted the scaffolds into a second set of mice. This second group was depleted of its own haematopoietic stem cells through a lethal irradiation at 8 Gy, meaning that these mice couldn’t produce their own blood, and wouldn’t therefore survive long term without bone marrow transplantation. Interestingly, mice that received the in vivo recellularized HHP-DCB scaffolds survived for four weeks after implantation, with newly produced blood cells flowing in their bloodstream.

The results move researchers one step closer to in vitro blood production.

Weighing water from space

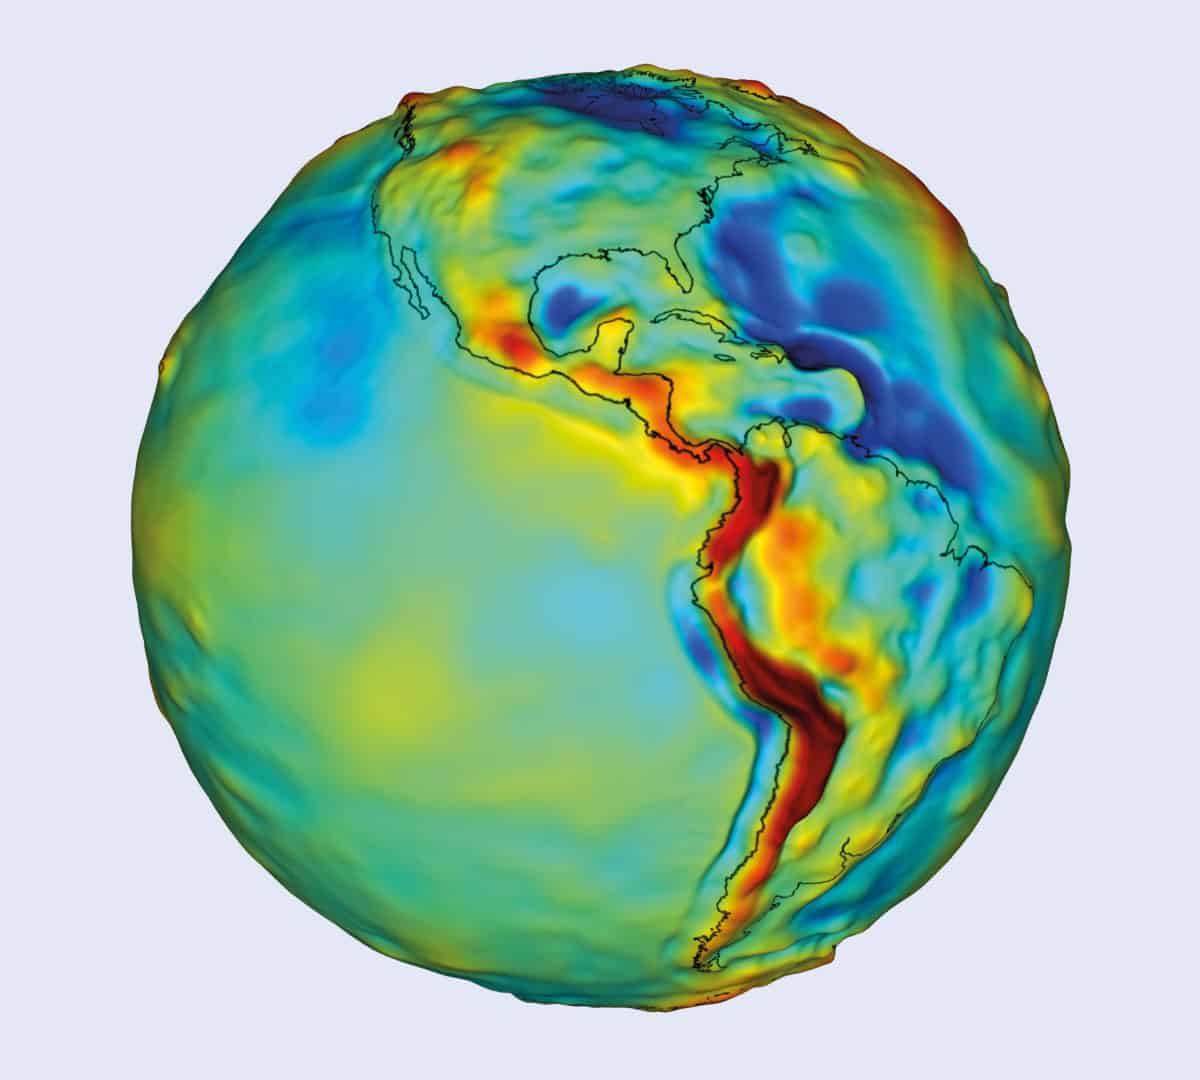
Imagine the sea on a still day, calmer than you have ever seen it, with no wind to stir its surface, and no currents or tides to disturb its depths. Now imagine that the sea has risen to cover the whole face of the planet, submerging the continents and even the highest mountain peaks. What you are seeing approximates the “geoid” – a surface that joins all of the points on the Earth where the strength of gravity is the same. The geoid is the level that a hypothetical global ocean would attain in the absence of forces such as tides, winds and currents, influenced only by gravity and the rotation of the Earth.

You might expect the surface of such an ocean to be a nearly perfect sphere, albeit bulging a little at the equator due to centrifugal forces arising from its rotation. However, this hypothetical ocean is not uniform. Given that the gravitational field varies slightly across the Earth, this ocean would – in finding its natural level – flow towards areas where gravity is strongest. It would pile up over the heavy spots to produce a watery planet with a lumpy, undulating surface.

With only a few hundred vertical metres between the highest and lowest points of this ocean, it would still look remarkably featureless to the naked eye. Exaggerate the scale, however, and you would see a seascape that mirrors the geology and relief of the planet beneath. That’s because the varying field strength is largely to do with the presence of topographic highs and lows, and with density differences in the crust and upper mantle. You would notice, for example, the ocean surface rising over the Andes and Himalayas – where gravity is enhanced by the huge thicknesses of continental crust – and sinking over the Indian Ocean, under which the material of the mantle appears to be unusually light.

But not all of the matter that matters is in rocks. The geoid is also shaped by more transient effects like the phase of the Moon, the motion of the oceans, and the state of the hydrosphere. Overlaid on the relatively static gravitational signature of mountain ranges, ocean trenches and deep geological features, there is therefore a constantly fluctuating signal that reveals how mass is redistributed about the Earth by dynamic processes. One of the most important contributors to this signal arises from the changing disposition of the Earth’s water on a regional and global scale.

Overlaid on the relatively static gravitational signature of mountain ranges, ocean trenches and deep geological features is a fluctuating signal that reveals how mass is redistributed by dynamic processes

A state of GRACE

Detecting the impact of water on the geoid was one of the main aims of a space mission called the Gravity Recovery and Climate Experiment (GRACE), which was launched in 2002 by NASA and the German Aerospace Center (DLR). Its role was to map the geoid with enough sensitivity to observe tiny variations in mass distribution over months and years – the sort that allow scientists to monitor changes in sea level, ice caps and water stored on land.

Running for more than 15 years, the experiment consisted of two identical satellites, GRACE-A and GRACE-B, both orbiting the Earth’s poles at an initial altitude of 490 km (although the height decayed gradually over the course of the mission). The two satellites did not fly together – instead, one orbited between 180 and 220 km ahead of its twin. The precise separation depended on various factors, including solar-radiation pressure, atmospheric drag, and any occasional forced adjustments to the crafts’ trajectory to make them dodge any space debris.

Figure 1

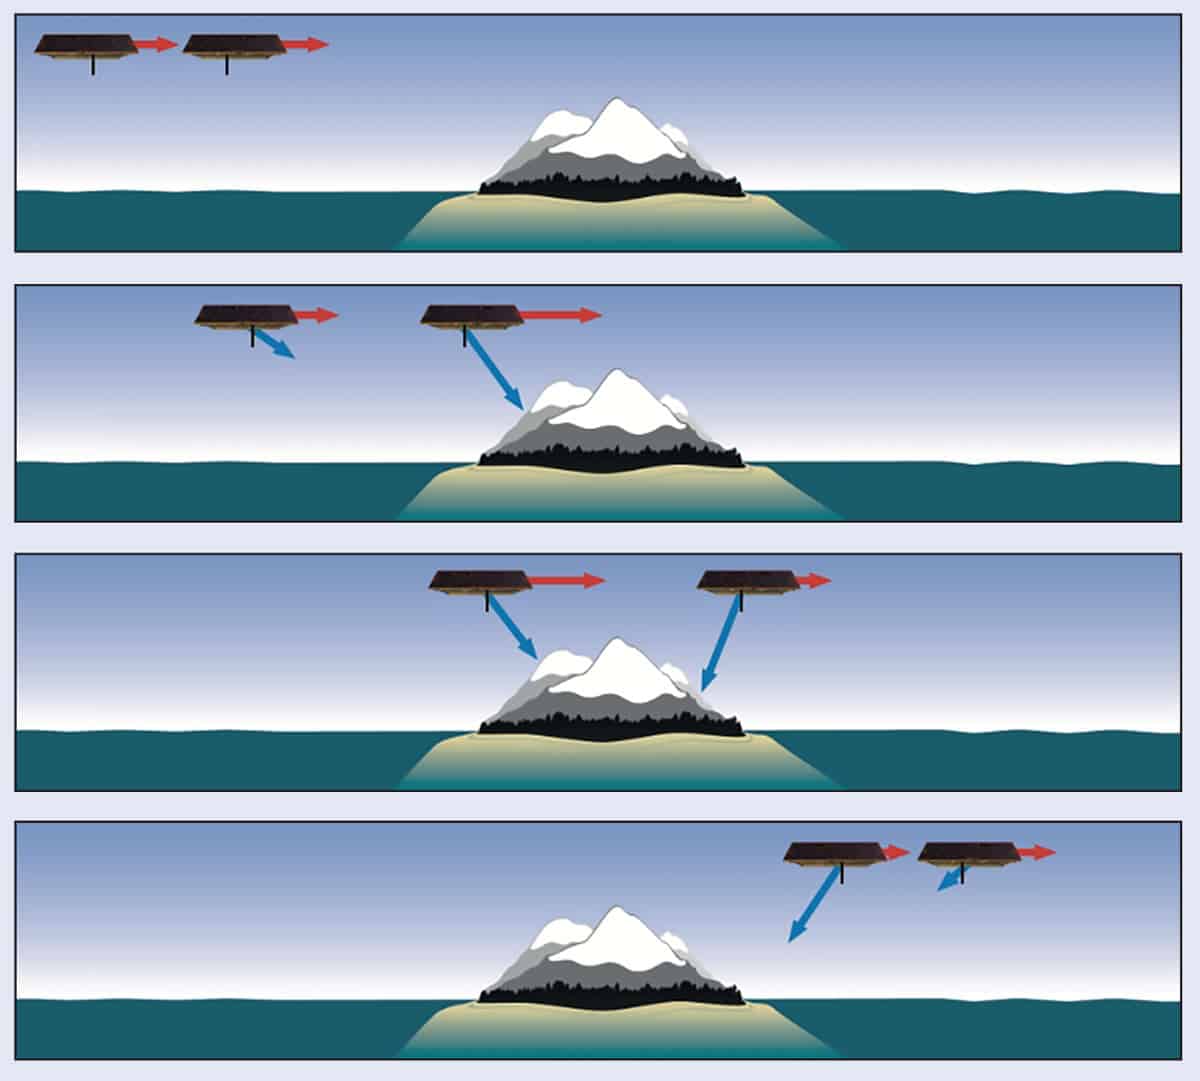
However, all of these factors were just “noise” to be filtered out. The really important influence on the inter-satellite distance – the force that the experiment was designed to measure – was gravity, which increased or decreased as the spacecraft crossed contour lines on the Earth’s geoid. If, say, the satellites’ orbit carried them towards a mass concentration in the Earth below, the leading spacecraft would be the first to feel the greater tug of gravity, which would perturb its trajectory and extend the separation minutely but measurably. When the pair had moved on so that the mass concentration was between them, it would now be the trailing satellite’s turn to feel the extra tug, while the leading satellite was pulled back in its orbit (figure 1).

Circling the Earth 16 times a day and achieving near-total global coverage every 30 days, the GRACE satellites – month by month and year by year – generated a map of where the two craft were pulled apart and where they bunched up. Mission scientists were then able to translate these data into an increasingly detailed picture of the planet’s gravitational field (figure 2).

The initial sketch of the mean gravity field produced by the experiment depicted the Earth’s large-scale geological structure: mountains, by definition, are big, and the gravitational signatures of such features were correspondingly easy to identify. Tracking the relatively small month-to-month changes in how water is distributed over oceans and continents, on the other hand, was a harder proposition.

The general locations of the satellites were measured using the Global Positioning System (GPS). But spotting the variation in satellite separation – and therefore gravity – associated with, for example, a depleted aquifer or a rising lake, required a sub-micron precision that GPS could not provide. Instead, the experiment sent a microwave beam from one satellite to the other, where it interfered with a reference beam on that craft. Changes in the inter-satellite distance would alter the relative phase of the two beams, revealing the shift as a change in the interference pattern.

Ascertaining the satellites’ relative motion so precisely was only half the challenge, however. Also crucial was to carefully account for all the other, non-gravitational sources of perturbation, which would otherwise have overwhelmed the gravity signal. At the initial 490 km orbit height, the biggest of these effects was solar-radiation pressure, which fluctuated constantly as the satellites passed in and out of the Earth’s shadow. This also created a cycle of warming and cooling, requiring sensors to measure each satellite’s thermal expansion. Without this information, any change in the dimensions of one of the spacecraft could have been mistaken for a gravitational effect on the distance between them.

Another significant non-gravitational force that had to be accounted for as the mission progressed was aerodynamic resistance on the GRACE satellites from the Earth’s tenuous upper atmosphere. As with all orbiting bodies, there was a positive feedback effect: the drag made the craft lose height, which in turn made them travel through a denser atmosphere, which led to more drag and so on. Indeed, by the end of 2017 when the two craft finally stopped operating, the satellites were orbiting barely 300 km above the Earth’s surface.

To compensate for all of these non-gravitational forces, each satellite had at its centre a 50 g “proof mass” suspended electrostatically within a cage. Electrodes in the walls of this container corralled the mass to within 30 μm of the satellite’s centre of mass, and simultaneously measured any displacement. Non-gravitational forces applied to the satellite body deflected the proof mass relative to its cage, whereas gravitational perturbations affected the entire set-up equally. Any change in distance that could not be attributed to some non-gravitational force on one of the satellites was therefore taken to be an indicator of unevenness in the geoid.

Watery changes

With the confounding effects removed, the precision of the distance measurement meant that GRACE was sensitive to changes in strength of gravity on the order of a few microns per second squared, or less than a millionth of the value at the surface (roughly 9.81 m s–2). Members of the GRACE team could therefore spot changes in gravitational strength caused by the water level in a large lake or aquifer rising or falling by as little as one centimetre. Every month, they compiled such changes in the Earth’s mass distribution and made the updated map available to researchers around the world.

One of those scientists is Matthew Rodell, head of the Hydrological Sciences Laboratory at NASA’s Goddard Space Flight Center in Maryland, US, who has used these data to map the changing availability of fresh water across the planet, including regions that would otherwise be hard to access. “GRACE revealed and quantified groundwater depletion associated with irrigated agriculture in northern India, the North China Plain and parts of the Middle East, among others,” says Rodell.

Figure 2

Writing in a recent paper in Nature (557 651), he and his team quantified dozens of global trends in freshwater distribution that are expected to affect food and water security in coming decades, and that could spark conflict if not managed carefully. The changes were a mix of natural, climate-change-related and directly human-caused effects, and the work simultaneously captured processes as diverse as ice-cap loss in Greenland and Antarctica, groundwater extraction in the Middle East, and the damming of rivers in China.

This ability to spot links between regional trends, which is a vital part of GRACE’s observations, is illustrated by a discovery made by Rodell’s colleagues at the Jet Propulsion Laboratory (JPL) in California (Geophysical Research Letters 39 L19602). They found that the global mean sea level, which had previously been steadily rising by about 3 mm a year, suddenly dropped between 2010 and 2011 by 5 mm. Carmen Boening from JPL, who began pondering the puzzle with collaborators at JPL, the National Center for Atmospheric Research and the University of Colorado at Boulder, wanted to know if the drop was related to ocean cooling or whether there was simply less water in the ocean.

Using GRACE data, Boening and her colleagues found that the sea-level fall really was due to missing mass, and that it was balanced by a corresponding increase in water stored on land. It turned out that the onset of La Niña conditions in the Pacific – a cyclical variation in ocean-surface temperature – had caused so much rain over Australia, south-east Asia and northern South America that the oceans were temporarily depleted, and the continents made measurably more massive. By 2012 the effect had ended and the rising trend, associated with global warming, had resumed. “So by using GRACE to weigh the ocean, we confirmed that there was less water there, which must have moved to the continents,” Boening says.

Following the trend

The two satellites making up the original GRACE mission were designed to last for just five years, with operations scheduled to end in 2007. Sensitive electronics can only take so much radiation and thermal cycling before they start to break down, and the spacecraft had no means to maintain their orbits in the face of aerodynamic drag. However, in a fashion familiar to fans of NASA’s Mars rover fleet, the GRACE scientists over-delivered, and the mission kept returning data until late 2017, shortly before the two satellites fell from orbit and burned up in the Earth’s atmosphere.

But the mission is not yet over. Recognizing the importance of obtaining further measurements, in 2011 NASA initiated a successor to GRACE, known as the GRACE Follow-On (GRACE-FO). With the US National Academy of Sciences also recognizing in its 2017–2027 Decadal Survey for Earth Science and Applications from Space that mass-change measurements are vital for tracking long-term trends in the hydrosphere, GRACE-FO was duly launched in May 2018 from the Vandenberg Air Force Base in California. To ensure continuity, GRACE-FO essentially duplicates the original experiment, but with a few minor improvements derived from lessons learned along the way.

The most novel aspect is the addition of a technology-demonstration instrument – a laser interferometer for measuring the inter-satellite separation. Developed by researchers from JPL as well as the Max Planck Institute for Gravitational Physics in Hannover and the Leibniz Universität Hannover, the device works on the same principle as the microwave-based method used by the original GRACE craft. It should, however, deliver a precision a hundred times greater because of the beam’s shorter wavelength. “It’s a really incredible piece of technology,” says GRACE-FO project scientist Frank Webb from the JPL. “The sensitivity limit is at the hundreds-of-picometres level, which is about half the size of a water molecule – over a distance of 200 km.”

In the current set-up, other sources of error are too large to do justice to the new instrument, so the increased precision cannot be fully utilized. Indeed, during routine operations, GRACE-FO will employ the same microwave-based method used by the original satellites. The laser interferometer is intended only as a validation of the technology for future missions, which will be able to make better use of the device to measure mass changes on the ground with greater accuracy and resolution. Even so, Webb will be surprised if scientists do not find some way to relate test data from the new device to mass change on the Earth. “The scientists are pretty clever, and they should be able to tease out a little more information from this new capability,” he says.

GRACE-FO is slated to work for five years, but whether it can continue working for as long as its predecessor will depend in part on the strength of the next cycle of solar activity, which will start in late 2019. When the Sun is especially active, the increase in emitted ultraviolet radiation adds energy to the Earth’s upper atmosphere. This makes the atmosphere “puff up”, increasing the drag in low Earth orbit and accelerating orbital decay. The craft would then burn up, as its predecessors did, albeit much sooner. “A strong solar cycle will push the satellites lower, earlier,” Webb says.

Follow on following on

Not content with GRACE-FO as a successor to GRACE, there are already plans for a follow-on to the follow-on. These missions will not only continue the geoid observations, but will also incorporate design changes that minimize uncertainty from other quarters, such as the sensitivity of the accelerometer, letting scientists make full use of the increased resolution afforded by the laser interferometer. This will let researchers measure even smaller mass changes over finer spatial scales, potentially revealing additional trends not glimpsed by the satellites launched so far.

And while GRACE-FO – and its successors – will measure changes in the Earth’ gravity field, a similar device could be used by another mission to observe gravitational signals from beyond. That’s because the successful demonstration on GRACE-FO is a major milestone in the development of the European Space Agency’s Laser Interferometer Space Antenna (LISA). Planned for launch in 2034, LISA will comprise three satellites arranged at the corners of a triangle 2.5 million kilometres on a side. Circling the Sun far from the noisy environment of low Earth orbit, the interferometer used on this mission will be able to detect a change in distance of just picometres – sufficient to spot the infinitesimal flexing of space due to the passage of gravitational waves from across the universe.

Results from the GRACE-FO demonstration will provide a practical lesson on how to operate, diagnose and, if necessary, debug the instrument after launch. Members of the LISA team – many of whom also work on GRACE-FO – will be watching keenly in preparation for when they turn their gravitational gaze outward from the Earth.

Food dye helps 3D-print vascular networks

An unexpected ingredient – food dye – could be used to 3D print biomaterials that contain intricate, physically intertwined networks similar to the vasculature in native tissue. This is the new finding from researchers at Rice University and the University of Washington in the US who have used the technique to make tissue that mimics the structure of the lung and liver-like tissue that they have successfully transplanted into mice.

One of the goals of 3D bioprinting is to engineer tissue and organs in the laboratory. In this technique, 3D objects are printed layer-by-layer according to a pre-programmed design using liquid or semi-liquid bioinks (hydrogels) containing living cells. The perfusable structures produced are kept in a bioreactor that supplies them with nutrients so that they can develop into mature tissue.

Although researchers have already managed to print a variety of biocompatible tissues using 3D bioprinting, it is proving difficult to engineer vascular networks in engineered biomaterials using the method. Vascular networks are responsible for carrying nutrients to tissues and organs and examples in the body include bile ducts and blood vessels in the liver and airways in the lung.

One way of creating complex vascular bioarchitectures is using a 3D printing method called projection stereolithography, which converts photoactive liquid resins into structured solid materials via photopolymerization reactions. Although a highly efficient technique, the light-blocking chemicals employed to stop the polymerization are unfortunately highly genotoxic carcinogens and thus cannot be used in biofabrication.

Non-toxic photoabsorbers

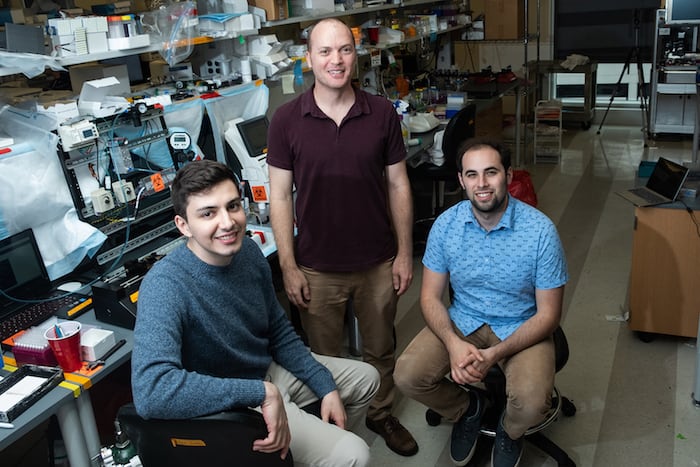
A team led by Jordan Miller of Rice University and Kelly Stevens of the University of Washington have now discovered that common food dyes – both synthetic and of a natural origin – can make for powerful biocompatible photoabsorbers and be used to produce complex and functional vascular networks within hydrogels.

Rice University bioengineers

The researchers found that aqueous pre-hydrogel solutions containing tartrazine or E102 (which is yellow), curcumin (from turmeric) and anthocynanin (from blueberries) can be used in this context.

In this work, Miller and colleagues focused on tartrazine. They created a new open-source bioprinting technology, the ‘stereolithography apparatus for tissue engineering’ or SLATE, to test out their technique, which prints layers of hydrogels from a liquid pre-hydrogel solution that solidifies when exposed to blue light. As each layer solidifies in turn, an overhead arm in the printing apparatus raises the growing 3D gel by just the right amount so that a very fine layer of liquid is exposed at each light exposition step.

By adding a food dye that efficiently absorbs light in this wavelength range, the technique can produce biocompatible gels with an intricate internal architecture in just minutes, says Miller. Such a short time frame is advantageous for live cells that do not survive very long and which need to be put back in a perfusion culture as quickly as possible.

Lung-mimicking structure

The team, which also includes bioengineers from Duke University, Rowan University and Nervous System in Massachusetts, made a structure that mimics a lung and found that it was robust enough to withstand pulsatile “breathing” (or tidal ventilation and distension) – an intake and output of air that simulates the pressures and frequencies of human breathing. The red blood cells in the structure could take up oxygen as they flowed through the vasculature in the breathing air sac, in a way that is similar to the gas exchange that takes place in the lung’s alveoli.

“We were very interested in the architecture of the lung because it is such an incredibly complicated design and really challenging from an engineering viewpoint,” says Miller. “Although we can mathematically describe alveolar morphology as 3D space-filling tessellation (or tiling) of polyhedra, making such structures in the lab is no easy task since it requires ensheathing vasculature that closely encompasses the curvature of the 3D airways.”

To overcome this problem, Miller and colleagues developed a new bioinspired alveolar model that mimics this vasculature in the so-called Weaire-Phelan topology that contains both convex and concave regions resembling natural alveolar sacs with a shared airway atrium supporting alveolar buds. They extended the air surface in the structure in the normal direction and removed faces and ensheated edges in a smooth polygonal mesh to form a highly branched vascular network containing 185 vessel segments and 113 fluidic branch points that encompasses the airway and follows its curvature. This work was done in collaboration with researchers at Nervous System.

Liver-like construct

The team also printed 3D tissues and loaded them with primary liver cells aggregates before successfully implanting them into mice with chronic liver injury. The tissues are multi-material and have separate compartments for blood vessels and liver cells.

“The liver is a particularly interesting organ to be able to biofabricate since it is the largest solid organ in the body and carries out hundreds of crucial tasks that depend on its structural topology,” says Stevens. “There is currently no machine or therapy that can replace all these functions when it fails.”

“Our dye-based bioprinting techniques can also produce intravascular features such as bicuspid valves that allow for unidirectional fluid flow,” explains Miller. “In humans, such valves are also found in the heart, leg veins and networks like the lymphatic system that lacks a pump to drive flow.

“By creating multi-vascular and intravascular structures, we’re introducing an extensive set of design freedoms for engineering living tissue and we now have the freedom to build many of the intricate structures found in the body.”

Indeed, Miller, Stevens and study lead author Bagrat Grigoryan say they are commercializing key aspects of their research through a start-up company, Volumetric, which is based in Houston.

Form and function

“The form of a biological structure is an evolutionary consequence of its function,” Miller reminds us. “As evolution advances, we get more refined structures so the question we asked ourselves in this work was: can we reproduce this relationship in bioengineering by building more complex structures?”

The team, reporting its work in Science 10.1126/science.aav9750, is now using its (freely available) 3D-prinitng design to produce even more complex structures than those thus produced. “The idea is to look at the unit cell structures of different tissue, and then build an interconnected structure that better mimics real tissue,” Miller tells Physics World.

“We would like other groups to pick up our tech, even if they utilize some future 3D printing technology that doesn’t exist today. We believe that 3D bioprinting, which has been around for over 40 years already, will be a crucial aspect of medicine in the next 20 years,” he states.

Copyright © 2026 by IOP Publishing Ltd and individual contributors